Lightweight Edge-Based Intrusion Detection for Power Monitoring Systems
Yan Li1, Cen Chen1,*, Zhuo Lyu1 and Zhaoyang He2
1State Grid Henan Electric Power Research Institute, State Grid Henan Electric Power Company, State Grid, Zhengzhou 450052, China
2Huaqing Weiyang (Beijing) Technology Co. Ltd., Beijing 100094, China
E-mail: liyan@ha.sgcc.com.cn; sunshinecen1@outlook.com; zhuanzhuan2325@sina.com; hezhaoyang@huaqing.ai
*Corresponding Author
Received 25 June 2026; Accepted 28 July 2026
Abstract
The network security threats faced by the power monitoring system in the open network environment are becoming increasingly complex, and the attack forms are diversified and concealed. Undetected attacks may lead to abnormal monitoring data, control command failures, or even critical equipment shutdown, thereby threatening the security and stability of the power system. Therefore, network security protection methods that balance detection accuracy, response speed, and edge deployment efficiency have significant engineering application value. To improve the security protection capabilities and real-time response performance in a dynamic network environment, a network security protection method that integrates lightweight intelligent sensing and edge collaborative deployment is constructed. Through multi-source feature fusion and lightweight detection models, combined with the cloud-edge collaborative mechanism, efficient detection and low-latency response to complex attacks are achieved. Experiments showed that the Macro-averaged F1-score reached 0.93, which was 2.08–8.60% higher than that of baseline methods, respectively. The proportion of high-confidence samples of the proposed method was more than 77%, and it could still maintain an attack detection rate of more than 0.94 under different attack traffic proportions. The results show that the method achieves a good balance between detection accuracy, robustness and deployment efficiency, making it suitable for resource-constrained edge devices that require real-time detection and rapid response. This provides technical support for building a low-latency, deployable network security protection system for power monitoring systems.
Keywords: Power monitoring system, network security protection, lightweight detection model, multi-source feature fusion, cloud-edge collaborative.
1 Introduction
Affected by the informatization and digitization of the power system, the power monitoring system has gradually evolved towards networking and intelligence, which has greatly improved the operating efficiency and management level. However, in an open network environment and multi-source heterogeneous device access, the network security risks continue to increase, facing multiple complex threats such as malicious intrusions, abnormal traffic attacks, lateral penetration, and covert data tampering [1–3]. Once the key control system is attacked, it may cause equipment loss of control, data anomalies and even large-scale power outages, seriously affecting the safe and stable operation [4, 5]. Therefore, building efficient, real-time and deployable network security protection methods has become a crucial research direction in the current power information security. Traditional power network security protection methods mostly rely on rule matching, feature library detection and shallow machine learning models. They are effective in identifying known attacks, but have obvious limitations in new attacks, variant attacks and complex dynamic environments [6, 7]. Deep learning technology has made significant progress in the field of network intrusion detection [8]. However, existing deep models usually have complex structures, large parameter scales, and high computational overhead, making them difficult to directly deploy on resource-constrained power edge devices. With the development of edge computing technology, sinking security detection capabilities to the edge nodes of the power monitoring network to achieve local rapid perception and response has become an important means to improve system security protection capabilities [9]. The study proposes a network security protection method for power monitoring systems that integrates lightweight intelligent sensing and edge deployment to achieve lightweight model design and efficient edge deployment while ensuring detection accuracy. A lightweight detection model is built based on You Only Look Once version 8 (YOLOv8). Mobile Network version 3 (MobileNetv3) backbone network and efficient convolution structure are introduced to achieve model compression and acceleration.
The innovation of this paper lies in constructing a lightweight edge intrusion detection method for power monitoring systems. This method first models network traffic, protocol, and behavioral characteristics, and represents key attack features through weighted fusion and attention mechanisms. Then, based on YOLOv8, MobileNetv3 and Grouped Shuffle Convolution (GSConv) are introduced to reduce the number of model parameters and computational complexity. Finally, it combines a cloud-edge collaborative deployment mechanism to collaboratively optimize attack detection, local response, and cloud model updates, thereby balancing detection accuracy, real-time performance, and edge deployment capabilities.
This paper addresses the shortcomings of traditional intrusion detection in power monitoring systems, such as insufficient real-time performance, high computational overhead of deep learning models, and difficulty in deployment on resource-constrained edge devices. It presents a solution with practical engineering applications. The proposed method maintains high detection accuracy and robustness while reducing inference latency and resource consumption, and demonstrates stable performance under varying attack traffic ratios. This research can provide technical support for real-time security awareness, rapid alarm, and proactive edge protection in power monitoring systems.
The structure of the paper is arranged as follows. Section 2 reviews related research progress. Section 3 introduces the proposed method. Section 4 gives results and analysis. Section 5 summarizes the full paper and looks forward to future research directions.
2 Related Work
Network security protection technology for power monitoring systems has become a hot research topic. Hu et al. proposed a MimicStudio comprehensive development framework to address the complex heterogeneous processing, difficult dynamic management, and availability maintenance in dynamic heterogeneous redundant architecture application development. Through mechanisms such as standardized workflow, zero-copy synchronization, parallel construction, multi-core collaborative debugging and dynamic structure adjustment, flexible and efficient support for the characteristics of dynamic heterogeneous redundant fault-tolerant systems was achieved [10]. Rabie et al. built a new detection method that integrated optimization and classification models to address the complexity of security threat detection faced by smart grid Supervisory Control and Data Acquisition (SCADA) systems. Min-max normalization was used for noise removal, the correlation estimation mechanism was used for feature dimensionality reduction, and the Holistic Harris Hawks Optimization (H3O) algorithm was used to select the optimal features, thereby efficiently identifying normal data and attack data [11]. Aiming at the insufficient anomaly recognition and differentiation efficiency, Tong et al. proposed a video anomaly recognition algorithm that combined multi-instance learning to optimize the wavelet transform algorithm and Long Short-Term Memory Network (LSTM). The method achieved an overall recognition accuracy and image classification accuracy of more than 90%, improving the substation safety management [12].
To address the problem that SCADA industrial IoT systems face multiple network attack threats such as attacks, deceptions, and advanced intrusions, and existing intrusion detection systems are insufficient in accuracy, scalability, and adaptability, Kuncham et al. proposed the CyberFortis network security framework. By integrating the twin dual-deep Q network and the autoencoder, and using the PopHydra optimizer to calculate the reinforcement learning discount factor, the system’s protection against emerging threats was improved [13]. Qi et al. built a causal inference method based on SCADA data to address the problem that existing power system operating variable relationship analysis methods mainly rely on mathematical models and component parameters and lack data-driven spatio-temporal characteristics analysis. A multi-data sequence regression model was constructed, and a priori causal knowledge and real variable amplitude effects were introduced to achieve a higher-precision analysis of the spatiotemporal causality of power system operating variables [14]. Li and Shen proposed an infrared sensing detection solution based on edge computing to solve the insufficient fault detection efficiency of power electronic equipment. A communication network between edge nodes and power servers was established to realize intelligent processing and scheduling of infrared data [15]. Jain et al. proposed a fog computing architecture as a solution for smart city infrastructure in response to the massive data processing and real-time requirements brought about by the proliferation of 5G IoT devices. Data storage, control and communication were implemented at the edge layer, combined with algorithm optimization and architecture design, thereby reducing network latency [16].
In summary, existing research has made certain progress in network security protection of power monitoring systems. However, most research focuses on a single data source or a single model structure and lack comprehensive modeling capabilities for multi-source heterogeneous data in power monitoring systems. In addition, although some deep models have high detection accuracy, the model scale is large and it is difficult to directly adapt to the computing and energy consumption constraints of edge devices. Therefore, the research builds a lightweight network security detection model based on YOLOv8, combined with multi-source feature modeling and edge collaborative deployment mechanism, aiming to collaboratively improve detection accuracy and real-time performance. The research introduces the MobileNetv3 backbone network and GSConv to improve YOLOv8, and combines the multi-source feature fusion mechanism to improve the representation ability of complex attacks, achieving efficient deployment on edge devices.
3 Research Methods
3.1 Multi-source Network Security Perception and Feature Modeling Method
To improve the power monitoring system’s ability to identify multiple types of attack behaviors in complex network environments, the study starts from the perspective of multi-source data fusion and constructs a multi-dimensional security perception model that integrates traffic characteristics, protocol characteristics and behavioral characteristics. Considering that the SCADA power monitoring system has diverse data sources, complex protocol types, and dynamic changes in behavior patterns, it is difficult for a single feature modeling method to comprehensively describe attack behavior, so multi-source heterogeneous data are unified modeled and expressed [17, 18]. The overall modeling process is presented in Figure 1.
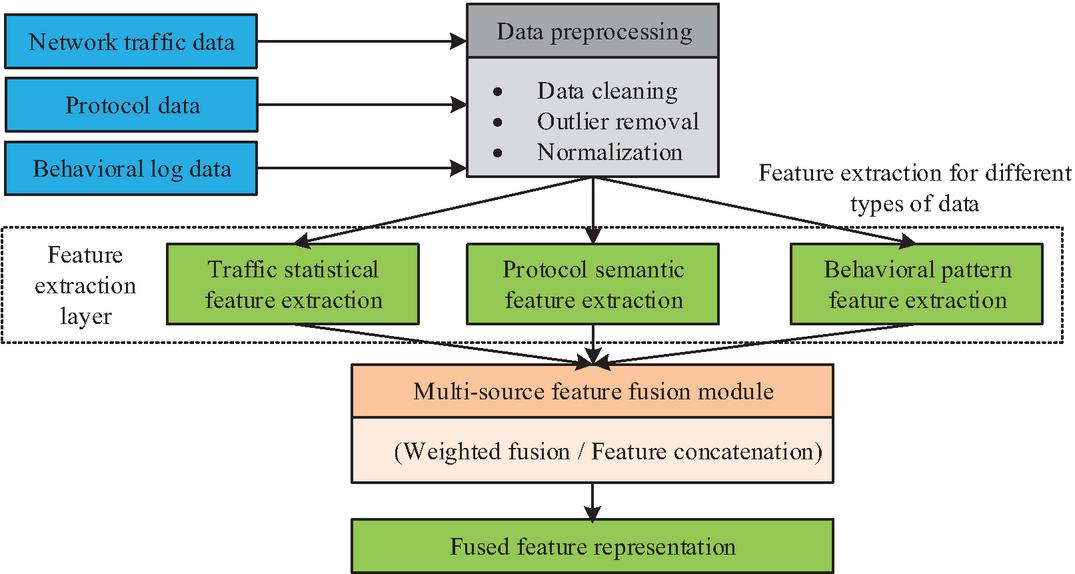
Figure 1 Multi-source cybersecurity data fusion and processing pipeline.
From Figure 1, the original data from the power monitoring network is first collected and preprocessed. The data sources include network traffic data, communication protocol data, and system behavior logs. According to the feature differences, representative traffic features, protocol features, and behavioral features are extracted. The original data set is signifies the number of samples and signifies the th network behavior sample. Each sample is composed of multi-source features, as presented in Equation (1).
| (1) |
where represents the flow characteristics (such as packet length, flow rate), represents protocol characteristics (such as port, protocol type), represents behavioral characteristics (such as access frequency, session sequence). and are the corresponding feature dimensions, respectively. During the feature processing process, to eliminate the impact of different feature dimension differences on model training, the original features are normalized. The min-max normalization method maps the features of each dimension to a unified numerical interval, given in Equation (2) [19].
| (2) |
where represents the original eigenvalue, represents the normalized eigenvalue. and respectively represent the minimum and maximum values of the feature in the data set. On this basis, multi-source features are fused and modeled, a unified feature vector is constructed using splicing, and a weighted fusion mechanism is introduced, as shown in Equation (3).
| (3) |
where signifies the feature splicing operation, , and represent the weight coefficients of traffic, protocol, and behavior features, which are trained as learnable parameters along with other model parameters. During training, the three weights are normalized using the Softmax function to satisfy the constraints of non-negativity and a sum of 1. Backpropagation is performed based on the detection loss, and gradient descent is used to automatically update the weights of various features. is the fused feature representation. In addition, an attention mechanism is introduced to model feature importance to enhance the ability to represent complex attack behaviors. The feature importance score is calculated and normalized through the Softmax function to obtain the attention weight. The details are shown in Equation (4) [20].
| (4) |
where signifies the feature importance score, signifies the learnable weight vector, represents the -th component in the fused feature vector, represents the bias term, signifies the importance weight of the -th dimension feature, represents the feature dimension. Finally, the weighted feature representation is obtained, as shown in Equation (5).
| (5) |
where signifies the feature vector after introducing the attention mechanism. The multi-dimensional feature construction and encoding structure is shown in Figure 2.
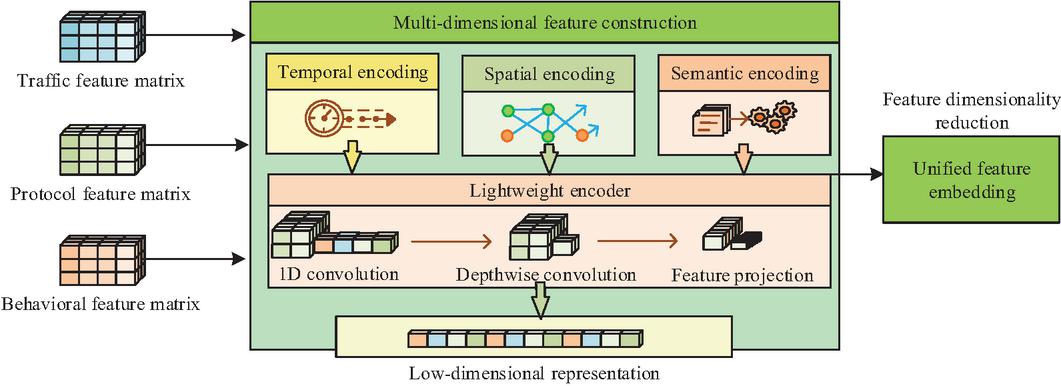
Figure 2 Multi-dimensional feature construction and encoding structure.
In Figure 2, the fused features are first mapped and encoded to form a high-dimensional representation, and then the key feature information is enhanced through the attention mechanism, thereby generating the final feature vector used to detect the input of the model. The proposed method can more comprehensively characterize complex attack behavior and improve the ability to identify covert attacks and variant attacks.
3.2 Lightweight Intelligent Detection Model Construction Method
On the basis of completing the multi-source feature modeling, to realize the efficient identification and edge deployment requirements of network attacks in the power monitoring system, the research further constructs a lightweight intelligent detection model based on YOLOv8. Compared with models that directly process tabular data, YOLOv8’s convolutional structure can extract local combination relationships between different security features. Its multi-scale feature fusion structure can simultaneously characterize single abnormal features and complex attack patterns [21, 22]. Meanwhile, YOLOv8 has high parallel inference efficiency and a mature lightweight deployment foundation, making it more suitable for resource-constrained power monitoring edge devices [23].
As the fused traffic features are one-dimensional vectors, while YOLOv8 uses a two-dimensional convolution, the fused features must undergo tensor transformation. First, the normalized traffic features, protocol features, and behavioral features are concatenated in a fixed order to form a fused feature vector of length . The arrangement of features in each dimension is determined based on their importance, and this arrangement is mapped to a two-dimensional feature tensor of size . When the feature dimension is less than , zero-padding is performed at the ends of the vector; when the feature dimension exceeds the target tensor capacity, features with higher importance are retained according to attention weights. The input feature tensor is . and represent the height and width of the input feature map, respectively. represents the number of input channels. After basic feature extraction, a multi-scale feature set can be obtained. represent feature maps at different scales, which are used to represent attack mode information at different levels. Considering that the original YOLOv8 backbone network still has a high computational burden in edge scenarios, MobileNetv3 is introduced to replace the original backbone network to reduce the amount of parameters and floating point operations. MobileNetv3 is built based on depth-separable convolution and lightweight attention mechanism, which not only ensures feature extraction capabilities, but also reduces computational complexity [24]. For the input feature , after the YOLOv8 backbone network is replaced with a depthwise separable convolution structure, the convolution operation process is decomposed into two parts: channel-by-channel convolution and point-by-point convolution, as shown in Equation (6).
| (6) |
where represents the activation function, represents intermediate features, represents the output features, represents the channel-by-channel convolution kernel, represents the point-wise convolution kernel. To optimize the feature expression ability, a channel attention mechanism is introduced based on depth-separable convolution to adaptively weight the feature channels. The output feature of the backbone network is , and its weight calculation process can be shown in Equation (7).
| (7) |
where GAP represents Global Average Pooling (GAP), and are weight matrices, and represent ReLU and Sigmoid functions, respectively. The final output feature is shown in Equation (8).
| (8) |
where represents channel-by-channel multiplication. Figure 3 presents the improved backbone network.
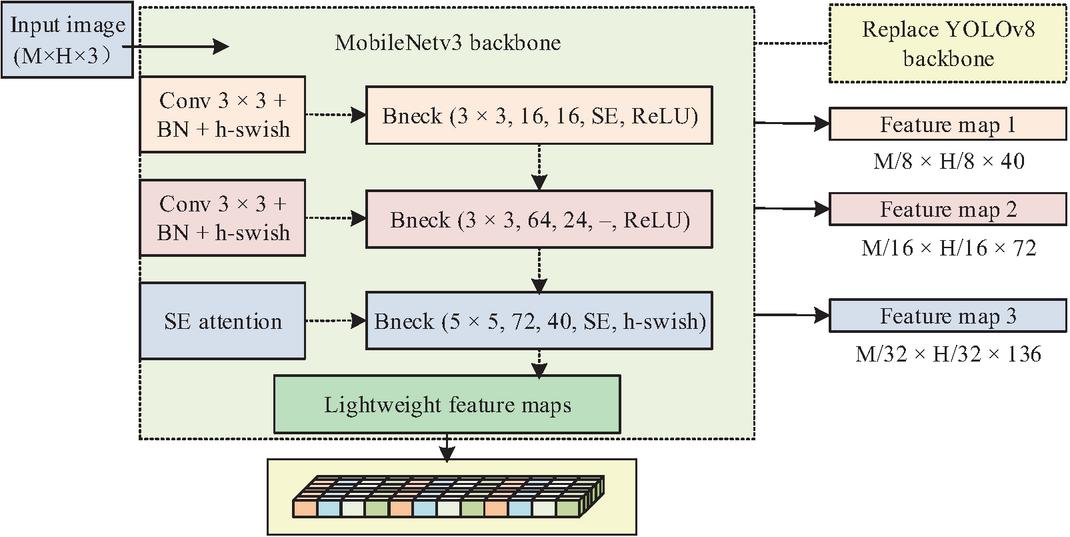
Figure 3 Lightweight backbone architecture based on MobileNetv3.
From Figure 3, the improved backbone network employs the MobileNetv3, replacing standard convolutions with depth-separable convolutions. Through this structure, the model calculation complexity is reduced from to , where signifies the number of output channels.
After completing the lightweighting of the backbone network, the feature fusion network Neck of YOLOv8 is further optimized. Traditional feature fusion usually relies on standard convolution to achieve cross-layer information transfer, which suffers from computational redundancy. Therefore, GSConv is introduced to replace some standard convolution structures to reduce parameters and improve feature fusion efficiency. GSConv first performs grouped convolution operations and enhances information interaction between different groups through channel rearrangement to obtain the final output features, given in Equation (9) [25].
| (9) |
where represents the activation function, means dividing the input channels into groups and performing convolution operations, respectively, Shuffle indicates channel rearrangement. Through the grouping calculation and channel interaction mechanism, GSConv can reduce the computational complexity while maintaining the feature expression ability. Its computational complexity is approximately expressed as . In addition, in the detection output stage, the Anchor-free mechanism is used to directly predict the target category and location parameters, and attack types and abnormal locations are collaboratively learned through joint optimization of classification loss and regression loss. The structure of the improved YOLOv8 lightweight model based on MobileNetv3 and GSConv is shown in Figure 4.
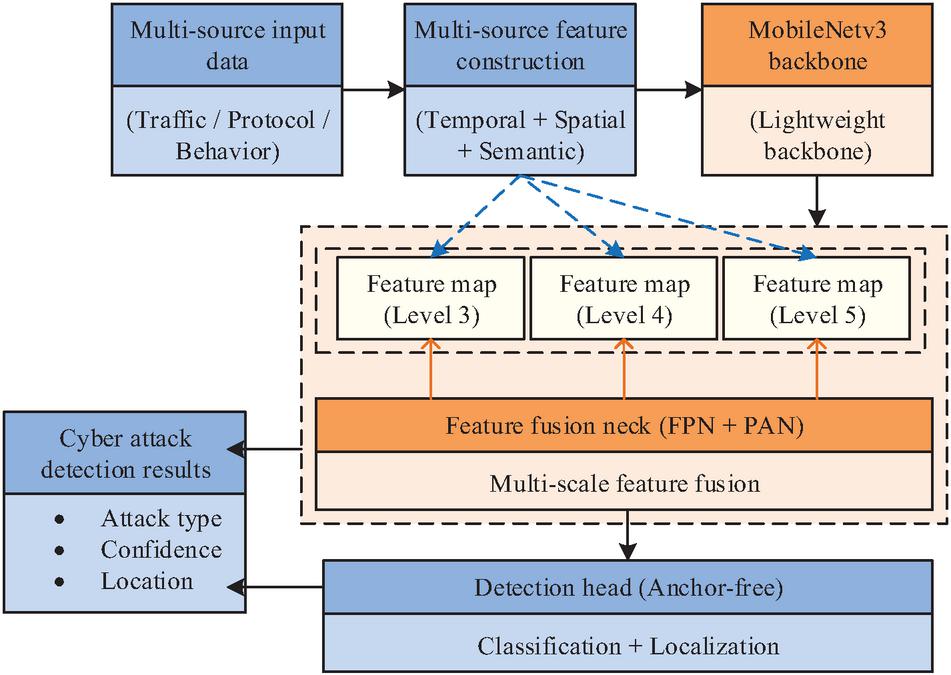
Figure 4 Overall architecture of the improved lightweight YOLOv8-based cybersecurity detection model.
From Figure 4, the entire model consists of an input feature layer, a lightweight backbone network, an optimized feature fusion network, and a detection output layer. The input layer receives high-dimensional feature representation obtained by multi-source feature modeling. The backbone network is responsible for low-complexity feature extraction. The feature fusion network realizes multi-scale information interaction. The detection head completes attack category identification and abnormal location prediction.
3.3 Edge Deployment and Collaborative Protection Methods
To satisfy real-time and low latency of the power monitoring system, the research further deploys the improved YOLOv8 lightweight model in the edge computing environment. A cloud-edge collaborative network security protection mechanism is built. The data in the power monitoring system has high-frequency generation and distributed characteristics. If all data is transmitted to the cloud for centralized processing, it will result in large communication overhead and response latency. Therefore, the core detection task is moved to the edge side to achieve rapid local perception and response. On the edge side, the input feature is , the lightweight detection model is denoted as , and its reasoning process can be expressed as Equation (10).
| (10) |
where represents the edge side model parameters and represents the detection output result. To characterize the real-time performance of edge nodes, the inference process is decomposed into three stages: pre-processing, model inference, and post-processing. The total latency can be expressed as Equation (11).
| (11) |
where represents the data preprocessing time, represents the model forward inference time, represents the result analysis and output time. On this basis, to further reduce the overall system latency, some non-critical data and detection results are uploaded to the cloud for centralized analysis. The uploaded data set is , the cloud model parameter is , and the update process can be expressed as Equation (12).
| (12) |
where represents the loss function and represents the learning rate. The updated model parameters are synchronized to each edge node through the network to achieve dynamic optimization and continuous learning of the model. In the cloud-edge collaborative process, the overall response time of the system can be expressed as Equation (13).
| (13) |
where represents the data transmission latency between the edge and the cloud. represents cloud processing time. In addition, to ensure that the system has the ability to respond quickly when an attack occurs, a local decision-making mechanism based on confidence is introduced at the edge node. The detection output confidence is and the threshold is . The alarm triggering rule is expressed as Equation (14).
| (14) |
where Alarm represents whether to trigger local security protection operations. When the detection result exceeds the threshold, the edge node can immediately implement blocking, isolation or alarm strategies, thereby reducing the risk of attack spread. The overall cloud-edge collaborative security protection architecture is shown in Figure 5.
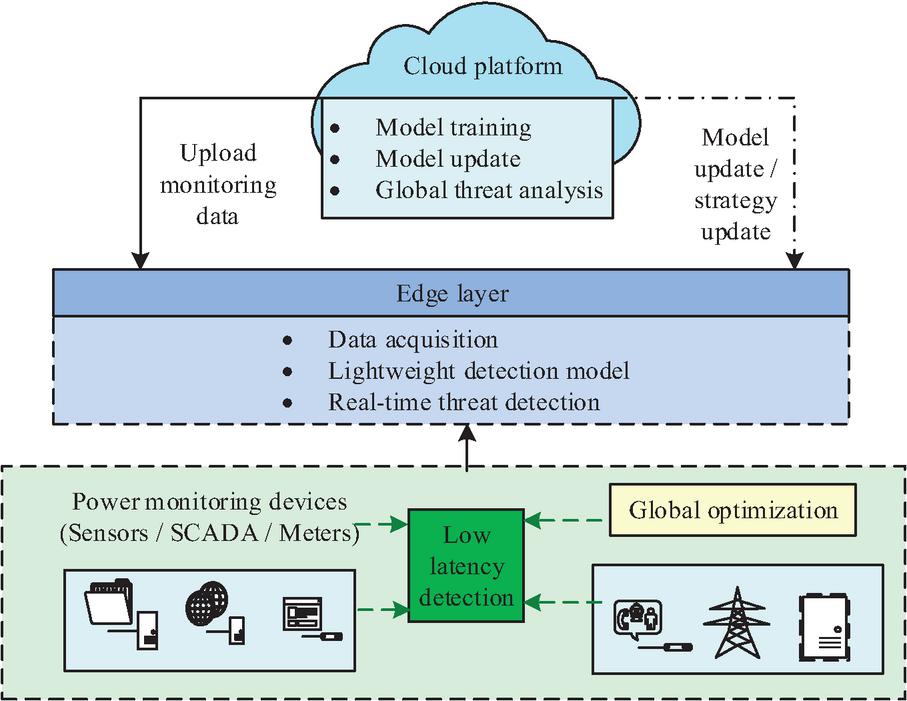
Figure 5 Cloud-edge collaborative cybersecurity framework for power monitoring systems.
From Figure 5, the system has a data collection layer, an edge computing layer and a cloud platform layer. The data completes real-time detection and preliminary response on the edge side, and key data is uploaded to the cloud for in-depth analysis and model updating. The updated model is then fed back to the edge node.
4 Results
4.1 Experimental Setup
To verify the effectiveness and engineering applicability of the proposed method, experimental settings and evaluations were conducted. The specific software and hardware configurations are presented in Table 1.
Table 1 Experimental setup
| Category | Item | Specification |
| CPU | Intel Xeon Silver 4210 @ 2.20 GHz | |
| Hardware (Server) | GPU | NVIDIA RTX 3090 (24 GB) |
| Memory | 64 GB | |
| Storage | 1 TB SSD | |
| Device | NVIDIA Jetson Xavier NX | |
| Hardware (Edge device) | GPU | 384-core Volta GPU |
| Memory | 8 GB | |
| Storage | 128 GB | |
| Operating system | Ubuntu 20.04 | |
| Framework | PyTorch 2.0 | |
| Software environment | CUDA | CUDA 11.8 |
| Inference engine | TensorRT 8.x | |
| Programming language | Python 3.8 |
The server in Table 1 is used for model training and parameter optimization, while Jetson Xavier NX simulates resource-constrained power monitoring edge nodes, and TensorRT accelerates model inference. The Canadian Institute for Cybersecurity Intrusion Detection System 2017 dataset (CICIDS2017) and the University of New South Wales Network-Based 2015 dataset (UNSW-NB15) were selected as basic data sources, and filtered and reconstructed based on the communication characteristics. By extracting traffic characteristics, protocol characteristics and behavioral characteristics, multi-source feature input data is constructed. To unify the data structures of CICIDS2017 and UNSW-NB15, this study first merges the original labels according to attack behavior semantics, retaining normal traffic and the main attack categories related to power monitoring networks. Secondly, the feature names, data types, and units in the two datasets are standardized, removing duplicate records, invalid values, and features with overlapping physical meanings, retaining only common features that correspond between the two data types. Continuous features are normalized using Min-Max, discrete protocols and connection states are encoded using one-hot encoding, and missing values are imputed using the median. After completing category mapping and feature alignment, the two datasets are merged according to a unified field order, and stratified sampling and dataset partitioning are performed. Finally, six categories of samples are retained: normal traffic, denial-of-service attacks, reconnaissance scans, brute-force attacks, vulnerability exploits, and malware attacks. The data set contains 120,000 samples, of which normal samples account for 40% and attack samples account for 60%. The data set is split into training, verification and test sets according to the 70%, 15% and 15%, and normalization processing and stratified sampling strategy are used to optimize the training stability. During the model training process, the stochastic gradient descent algorithm optimizes the model parameters. The initial learning rate was 0.01, the batch size was 32, and the quantity of training rounds was 100. A learning rate decay strategy was introduced to improve model convergence performance. To address class imbalance, this study employs a synthetic minority class oversampling technique applicable to mixed continuous and discrete features only on the training set to generate minority class attack samples, thereby improving the model’s ability to identify minority class attacks. The validation and test sets maintain the original class distribution to avoid data leakage and ensure the objectivity of the evaluation results.
4.2 Model Performance and Detection Effect Analysis
To assess the performance in the power monitoring system network security detection task, machine learning methods such as Support Vector Machine (SVM), Random Forest (RF) and typical deep learning models such as Convolutional Neural Network (CNN), LSTM and YOLOv5 were selected for comparison. The Macro-averaged F1-score (Macro-F1) and weighted F1 values of different models under different training data proportions are shown in Figure 6.
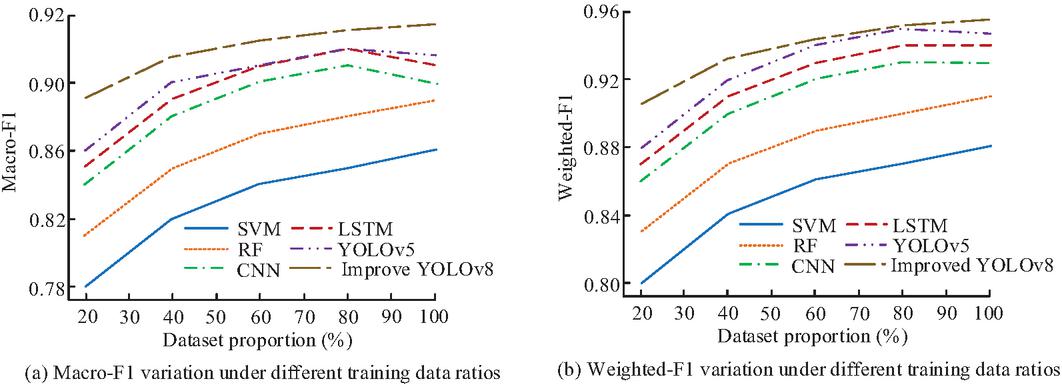
Figure 6 Performance variation under different training data ratios.
From Figure 6(a), as the training data ratio increased from 20% to 100%, the proposed model performed optimally under each data ratio. At 100% data ratio, the Macro-F1 of improved YOLOv8 reached 0.93, which was 8.60%, 4.36%, 3.20%, 2.98% and 2.08% higher than that of SVM, RF, CNN, LSTM and YOLOv5, respectively. Under the low data ratio (20%), the Macro-F1 of the proposed model still reached 0.89, which was 14.23% and 3.60% higher than that of SVM and YOLOv5, respectively, indicating that the model has stronger feature learning capabilities in small sample scenarios. Combined with Figure 6(b), the weighted F1 value of the proposed model reached 0.96 under 100% data ratio, which was 8.64%, 5.05%, 2.80%, 1.70% and 0.95% higher than that of the other five baseline methods, respectively. The performance improvement of the proposed method is more obvious in small sample scenarios, reflecting good data utilization capabilities and robustness. The evaluation results of the Macro-Area Under the Receiver Operating Characteristic Curve (Macro-AUC) and Matthews Correlation Coefficient (MCC) of different models are shown in Figure 7.
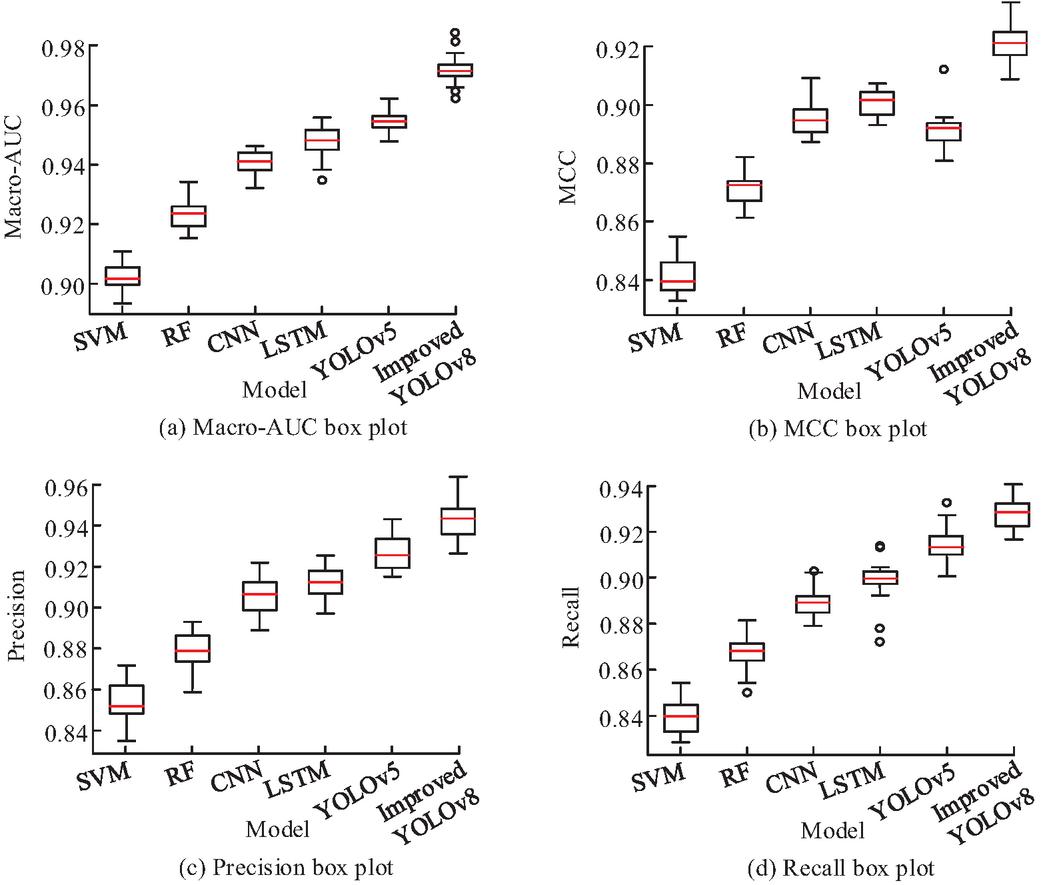
Figure 7 Statistical distribution of model discriminative performance.
From Figure 7(a), the improved YOLOv8 had the highest median on the Macro-AUC index, at 0.97, which was 7.64%, 5.08%, 3.29%, 2.53% and 1.78% higher than that of SVM, RF, CNN, LSTM and YOLOv5, respectively. From the overall trend, improved YOLOv8 performed best among all models. In addition, the box range was significantly more concentrated and the interquartile range was smaller, indicating that the model had better stability and consistency under different experimental conditions. In Figure 7(b), the median MCC of the improved YOLOv8 was about 0.92, which was significantly better than that of other methods, and the box height was lower. This shows that the proposed model has smaller fluctuations in multiple experiments. From Figures 7(c) and 7(d), the precision and recall of the improved YOLOv8 were also significantly better than those of comparison methods, indicating its effectiveness and robustness in network security detection tasks. The prediction confidence distribution of different models on the test set is illustrated in Figure 8.
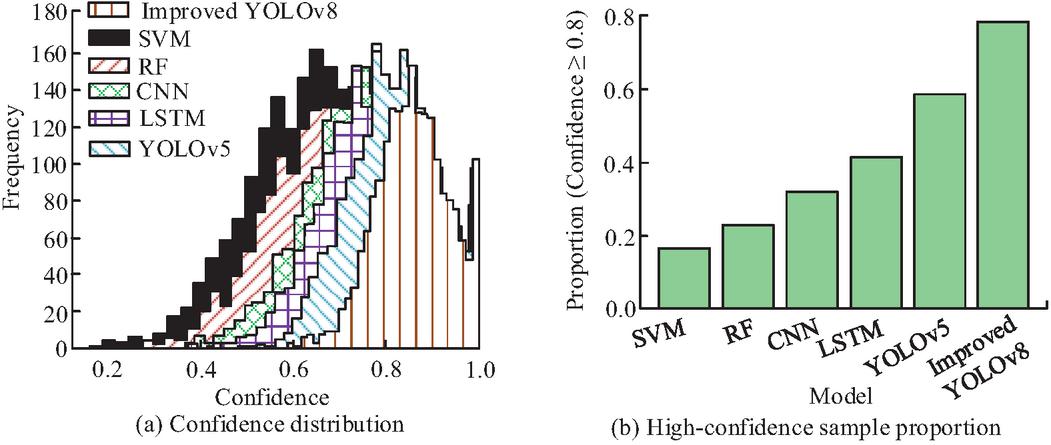
Figure 8 Prediction confidence distribution and high-confidence sample proportion analysis.
From Figure 8(a), the confidence of traditional models (SVM and RF) was mainly concentrated in the 0.4–0.7 range, while the deep learning models (CNN and LSTM) gradually moved to the 0.6–0.8 range. In contrast, the confidence distribution of YOLOv5 and improved YOLOv8 was obviously concentrated in the high confidence area (above 0.8). The distribution peak of improved YOLOv8 was mainly located around 0.85, and the overall distribution was most shifted to the right, indicating that the model has stronger discrimination certainty and output consistency in the prediction process. Figure 8(b) shows the high confidence sample proportion (Confidence 0.8). The improved YOLOv8 reached 77.80%, which was the best among all comparison models, and the advantage was more obvious in the high confidence interval. The rightward shift of the confidence distribution and the increase in the proportion of high-confidence samples indicate that the model not only has strong classification capabilities in complex network attack detection tasks, but can also output more stable and reliable prediction results.
4.3 Lightweight and Deployment Performance Analysis
To further verify the effectiveness in actual network security protection scenarios, the MobileNet-based Intrusion Detection System (MobileNet-IDS) was compared with the lightweight target detection model Tiny-YOLOv5, and the security protection capabilities and deployment performance were compared. The results of the Attack Detection Rate (ADR) and False Alarm Rate (FAR) under different attack traffic proportions are shown in Figure 9.
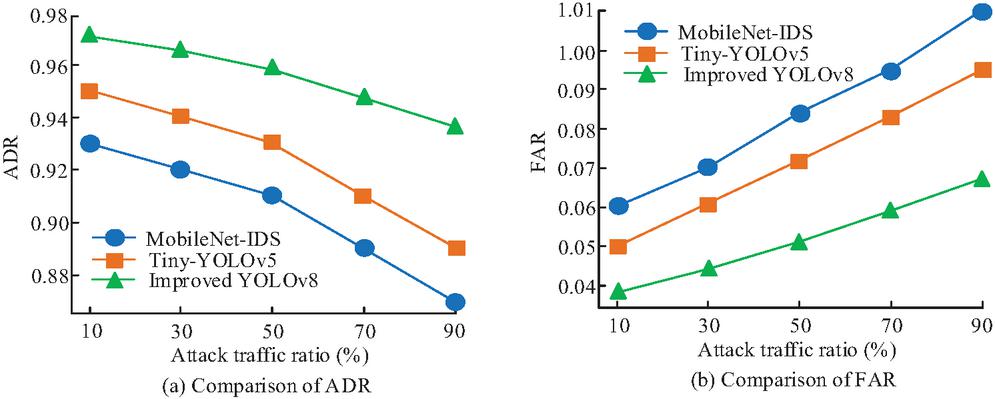
Figure 9 Security performance variation under different attack traffic ratios.
From Figure 9(a), when the attack ratio was 50%, the ADR of improved YOLOv8 reached 0.958, which was 5.27% and 3.01% higher than that of MobileNet-IDS and Tiny-YOLOv5, respectively. Under high attack intensity (90%) conditions, the improved YOLOv8 still maintained a detection rate of 0.94, indicating that the model is more robust in complex environments. Combined with Figure 9(b), the improved YOLOv8 maintained the lowest FAR under various conditions, and the FAR growth rate under high attack load conditions was significantly lower than that of the comparison model. The model has better stability and anti-interference ability in complex environments. The real-time processing capability and performance change trends under different lightweight configuration conditions are shown in Figure 10.
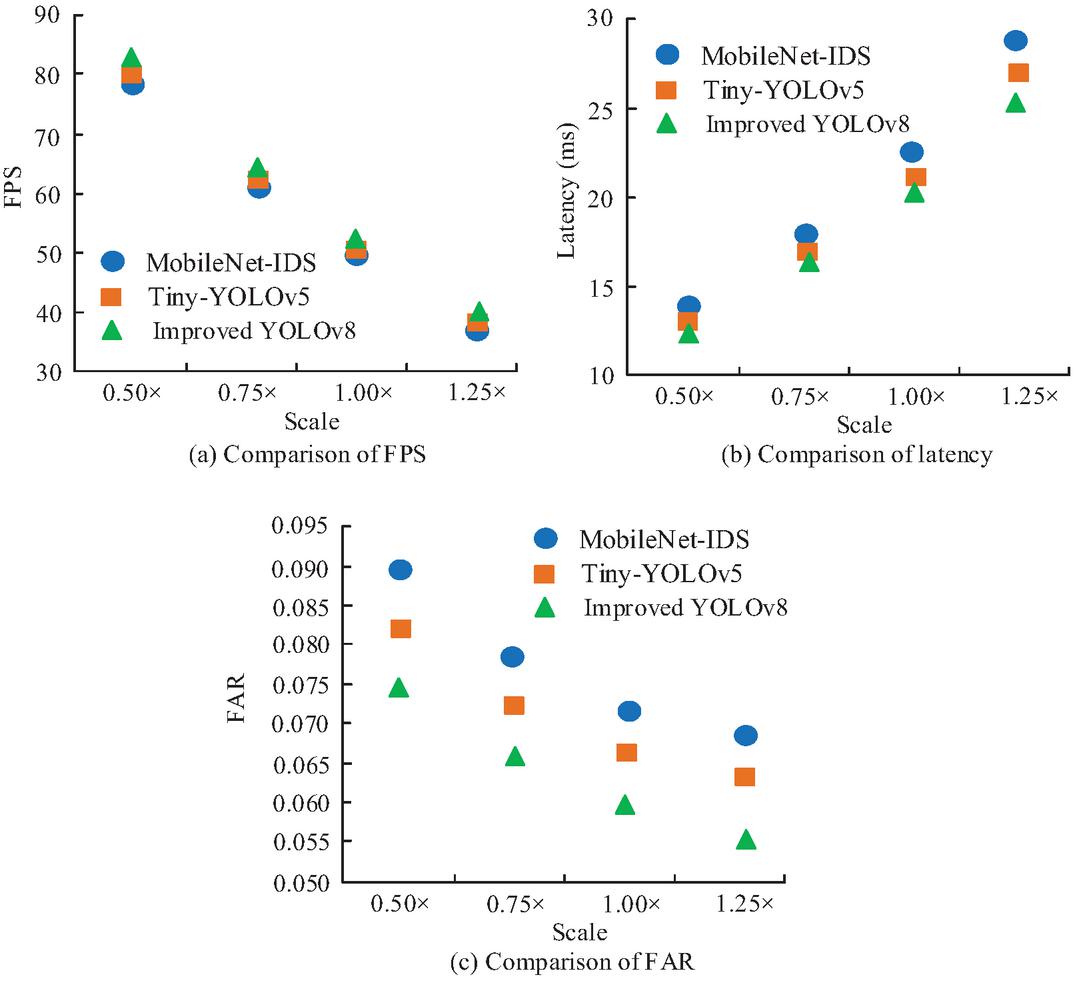
Figure 10 Deployment performance comparison under different model scales.
From Figure 10(a), as the model size increased, the inference speed of each method showed a downward trend. The improved YOLOv8 maintained the highest frame rate (Frames Per Second, FPS) at all scales. The FPS of improved YOLOv8 at 1.0 scale increased by 5.34% and 3.01% compared with MobileNet-IDS and Tiny-YOLOv5, respectively, indicating that the model has advantages in computational efficiency. In Figure 10(b), the latency of improved YOLOv8 at 1.0 scale was reduced by 9.59% and 4.81% respectively compared with MobileNet-IDS and Tiny-YOLOv5. Combined with Figure 10(c), the improved YOLOv8 showed the lowest FAR under various scale conditions. This shows that the proposed model effectively reduces the FAR while maintaining high inference speed and low latency, and collaboratively optimizes detection efficiency and safety performance. Finally, the study further evaluated the practical deployment feasibility of the three methods on edge devices, as shown in Table 2.
Table 2 Model resource consumption and deployment overhead
| Model | Parameter (M) | FLOP (G) | Memory (MB) | Power (W) | Latency (ms) |
| MobileNet-IDS | 3.42 | 8.75 | 986.37 | 10.84 | 21.87 |
| Tiny-YOLOv5 | 4.18 | 10.96 | 1123.58 | 12.27 | 20.73 |
| Improve YOLOv8 | 5.12 | 13.85 | 1286.94 | 13.76 | 19.83 |
From Table 2, MobileNet-IDS had the lowest parameters and Floating Point Operations (FLOPs), showing better lightweight characteristics. Tiny-YOLOv5 was slightly higher in model size and computational overhead. Its parameter volume and FLOPs were 4.18 M and 10.96 G, respectively, and its memory usage and power consumption were 1123.58 MB and 12.27 W, respectively. In contrast, compared with improved YOLOv8 and MobileNet-IDS, the proposed method increased memory usage and power consumption by 30.47% and 26.93%, respectively. Compared to Tiny-YOLOv5, the improved YOLOv8 increases performance by approximately 14.54% and 12.14%, respectively. Combining the aforementioned detection performance and inference efficiency results, while the proposed model consumes slightly more resources than the two lightweight comparison models, it outperforms in attack detection rate, false positive rate, Macro-F1 score, and inference speed. Particularly at the model scale, the proposed model achieves inference speed improvements of 5.34% and 3.01% compared to MobileNet-IDS and Tiny-YOLOv5, and reduces inference latency by 9.59% and 4.81%, respectively. Therefore, the slight increase in memory usage and power consumption are justified by higher detection accuracy, lower false positive rate, and faster response speed, achieving a favorable balance among security performance, computational cost, and deployment efficiency. This renders the model particularly suitable for resource-constrained edge scenarios in power monitoring, where real-time responsiveness is critical.
5 Conclusion
Power monitoring systems face challenges in network security protection, including high model complexity, insufficient real-time response, and limited edge deployment. To address these issues, this study proposes a protection method that integrates lightweight intelligent sensing with cloud-edge collaborative. First, a multi-source feature modeling method fusing traffic features, protocol features, and behavioral features is constructed, and an attention mechanism is used to enhance the representation of key attack features. Second, to achieve model lightweighting, MobileNetV3 and GSConv are incorporated into the YOLOv8 framework. Furthermore, cloud-edge collaborative deployment and a confidence-based local response mechanism are combined to achieve coordinated optimization of attack detection, rapid alarm, and model updates. Experiments verify the basic assumptions of this paper: multi-source feature fusion and lightweight edge deployment can improve the power monitoring system’s ability to identify complex network attacks and its real-time response performance while controlling computational overhead.
Results show that the proposed method achieves Macro-F1 and Weighted-F1 scores of 0.93 and 0.96, and Macro-AUC and MCC scores of 0.97 and 0.92, respectively. In terms of security performance, the model achieves a detection rate of up to 0.96 and a false positive rate as low as 0.05 under complex attack scenarios, maintaining good stability even under high attack loads. Regarding edge deployment performance, the model achieves an inference speed of 82.4 FPS on Jetson Xavier NX, with single inference latency controlled within 25 ms, and both memory usage and power consumption are within acceptable ranges. The proposed method achieves a good balance between detection accuracy, robustness, computational cost, and deployment efficiency, providing a low-latency, deployable real-time network security protection solution for power monitoring systems.
Although the proposed method achieves a good balance between detection performance and edge deployment efficiency, current research is mainly based on the CICIDS2017 and UNSW-NB15 public datasets for validation and has not yet been tested on real-world industrial SCADA or power monitoring system operational data. Public datasets may differ from actual power field conditions in communication protocols, equipment heterogeneity, attack distribution, and environmental noise. Therefore, the current results primarily validate the feasibility and deployment potential of the proposed method, rather than its real-world performance. Its long-term stability and cross-scenario generalization capabilities in real-world scenarios still require further evaluation. Future research will combine anonymized SCADA communication traffic and security event data to conduct online detection, cross-scenario migration, and long-term operational tests on real or semi-physical power monitoring platforms. Furthermore, federated learning and adaptive update mechanisms will be introduced to enhance the model’s continuous adaptability to unknown attacks, data distribution drift, and complex operating environments.
Funding
This work is supported by the Science and Technology Program of SGCC: Research on Key Technologies for Identification, Assessment and Decision-making of Highly Covert Cyber Threats in Power Monitoring Systems (Grant No. 521700250014-153-ZN).
References
[1] Du D, Zhu M, Li X, Fei M, Bu S, Wu L, Li K. A review on cybersecurity analysis, attack detection, and attack defense methods in cyber-physical power systems. Journal of Modern Power Systems and Clean Energy, 2022, 11(3): 727–743. https://doi.org/10.35833/MPCE.2021.000604.
[2] Asiri M, Saxena N, Gjomemo R, Burnap P. Understanding indicators of compromise against cyber-attacks in industrial control systems: a security perspective. ACM Transactions on Cyber-Physical Systems, 2023, 7(2): 1–33. https://doi.org/10.1145/3587255.
[3] Zhu, Z S. AI-based malware detection and classification algorithms. Journal of Cyber Security and Mobility, 2026, 15(3):525–548. https://doi.org/10.13052/jcsm2245-1439.1531.
[4] Cheng M, Zhang D, Yan W, He L, Zhang R, Xu M. Power system abnormal pattern detection for new energy big data. International Journal of Emerging Electric Power Systems, 2023, 24(1): 91–102. https://doi.org/10.1515/ijeeps-2022-0209.
[5] Zhao, X, Wu, Q, Wang, P. Network security posture assessment algorithm based on multilayer perceptron of graph convolutional neural networks. Journal of Cyber Security and Mobility, 2026, 15(01), 1–24. https://doi.org/10.13052/jcsm2245-1439.1511.
[6] Sahani N, Zhu R, Cho J H, Liu C C. Machine learning-based intrusion detection for smart grid computing: A survey. ACM Transactions on Cyber-Physical Systems, 2023, 7(2): 1–31. https://doi.org/10.1145/3578366.
[7] Tirulo A, Chauhan S, Dutta K. Machine learning and deep learning techniques for detecting and mitigating cyber threats in IoT-enabled smart grids: a comprehensive review. International Journal of Information and Computer Security, 2024, 24(3–4): 284–321. https://doi.org/10.1504/IJICS.2024.141601.
[8] He K, Kim D D, Asghar M R. Adversarial machine learning for network intrusion detection systems: A comprehensive survey. IEEE Communications Surveys & Tutorials, 2023, 25(1): 538–566. https://doi.org/10.1109/COMST.2022.3233793.
[9] Roy S D, Debbarma S, Iqbal A. A decentralized intrusion detection system for security of generation control. IEEE Internet of Things Journal, 2022, 9(19): 18924–18933. https://doi.org/10.1109/JIOT.2022.3163502.
[10] Hu J, Li Y, Sun Y, Yu B, Liu Q, Wu J. MimicStudio: one-stop development framework for dynamic heterogeneous redundancy architecture. China Communications, 2026, 23(1): 125–139. https://doi.org/110.23919/JCC.fa.2023-0398.202601.
[11] Rabie O B J, Selvarajan S, Alghazzawi D, Kumar A, Hasan S, Asghar M Z. A security model for smart grid SCADA systems using stochastic neural network. IET Generation, Transmission & Distribution, 2023, 17(20): 4541–4553. https://doi.org/10.1049/gtd2.12943
[12] Tong B, Li Y, Chen X. A neural network-based intelligent system for substation surveillance video analysis with edge and IoT integration. EURASIP Journal on Wireless Communications and Networking, 2025, 2025(1): 95–118. https://doi.org/10.1186/s13638-025-02528-y.
[13] Kuncham Sreenivasa Rao, Kotoju R, Reddy B R, Al-Shehari T, Alsadhan N A, Singh S, Selvarajan S. Unveiling CyberFortis: A unified security framework for IIoT-SCADA systems with SiamDQN-AE FusionNet and PopHydra optimizer. Computers, Materials & Continua, 2025, 85(10): 1899–1916. https://doi.org/10.32604/cmc.2025.064728.
[14] Qi C, Mu G, Liu H, Wang C. Data-sequence modeling based causal evaluation method for power systems and spatiotemporal causality variation patterns. CSEE Journal of Power and Energy Systems, 2025, 11(4): 1429–1441. https://doi.org/10.17775/CSEEJPES.2024.03030.
[15] Li S, Shen Y. Application of an infrared sensor based on edge computing in power electronics technology. International Journal of Energy Technology and Policy, 2025, 20(6): 33–50. https://doi.org/10.1504/IJETP.2025.149453.
[16] Jain S, Gupta S, Sreelakshmi K K, Rodrigues J J. Fog computing in enabling 5G-driven emerging technologies for development of sustainable smart city infrastructures. Cluster Computing, 2022, 25(2): 1111–1154. https://doi.org/10.1007/s10586-021-03496-w.
[17] Pandit R, Astolfi D, Hong J, Infield D, Santos M. SCADA data for wind turbine data-driven condition/performance monitoring: A review on state-of-art, challenges and future trends. Wind Engineering, 2023, 47(2): 422–441. https://doi.org/10.1177/0309524X221124031.
[18] Babayigit B, Abubaker M. Industrial internet of things: A review of improvements over traditional Scada systems for industrial automation. IEEE Systems Journal, 2023, 18(1): 120–133. https://doi.org/10.1109/JSYST.2023.3270620.
[19] Ali P J M. Investigating the impact of min-max data normalization on the regression performance of K-nearest neighbor with different similarity measurements. ARO – The Scientific Journal of Koya University, 2022, 10(1): 85–91. https://doi.org/10.14500/aro.10955.
[20] Guo Y, Mao J, Zhao M. Rolling bearing fault diagnosis method based on attention CNN and BiLSTM network. Neural Process. Lett., 2023, 55(3): 3377–3410. https://doi.org/10.1007/s11063-022-11013-2.
[21] Farooq J, Muaz M, Khan Jadoon K, Aafaq N, Khan M K A. An improved YOLOv8 for foreign object debris detection with optimized architecture for small objects. Multimedia Tools and Applications, 2024, 83(21): 60921–60947. https://doi.org/10.1007/s11042-023-17838-w.
[22] Gui S, Tian H, Wang Y, Dang S, Li Z, Liu K, Tian Z. Enhanced concealed object detection method for MMW security images based on YOLOv8 framework with ESFF and HSAFF. IEEE Sensors Journal, 2025, 25(4): 7630–7641. https://doi.org/10.1109/JSEN.2024.3524441.
[23] Lysyi A, Sachenko A, Radiuk P, Lysyi M, Melnychenko O, Ishchuk O, Savenko O. Enhanced fire hazard detection in solar power plants: An integrated UAV, AI, and SCADA-based approach. Radioelectronic and Computer Systems, 2025, 2025(2): 99–117. https://doi.org/10.32620/reks.2025.2.06.
[24] Cao Z, Li J, Fang L, Li Z, Yang H, Dong G. Research on efficient classification algorithm for coal and gangue based on improved MobilenetV3-small. International Journal of Coal Preparation and Utilization, 2025, 45(2): 437–462. https://doi.org/10.1080/19392699.2024.2353128.
[25] Sheng G, Min W, Yao T, Song J, Yang Y, Wang L, Jiang S. Lightweight food image recognition with global shuffle convolution. IEEE Transactions on AgriFood Electronics, 2024, 2(2): 392–402. https://doi.org/10.1109/TAFE.2024.3386713.
Biographies

Yan Li received his bachelor’s degree in Electric Power System from Wuhan University, China, in 1995. He currently serves as Deputy Director of the Dispatching and Control Center of State Grid Henan Electric Power Company. He has long been engaged in work related to the safe operation of power grids. He has won two third prizes of Henan Science and Technology Progress Award, two first prizes of Science and Technology Progress Award from Henan Society for Electrical Engineering, as well as a number of science and technology progress awards from State Grid Henan Electric Power Company. He has published several core journal papers and been granted a number of patents.

Cen Chen obtained her master’s degree in Electronic Science and Technology from the University of Science and Technology of China (USTC) in 2016. She currently serves as a Specialist at the Electric Power Research Institute of State Grid Henan Electric Power Company. She has published more than 20 academic papers and been granted over 10 invention patents. She has participated in numerous national-level cyber security defense exercises and security support for the Two Sessions, and has received letters of appreciation from State Grid, provincial power companies and the North China Branch. Her research interests include cyber security and artificial intelligence.

Zhuo Lyu received his master’s degree in Information Security from Shanghai Jiao Tong University, China, in 2011. He is currently a Senior Expert at State Grid Henan Electric Power Company. He serves as a reviewing expert for the Industrial Information Security Skills Competition of the National Industrial Information Security Industry Development Alliance, an external expert for the Henan Industrial Information Security Industry Development Alliance and Zhengzhou Public Security Bureau, and a master’s supervisor at Shanghai University of Electric Power. He has long been engaged in research on key technologies for cybersecurity protection of industrial control systems and vulnerability discovery, and has participated in cybersecurity support for many major national-level events. He has received one first prize and five second prizes of provincial and ministerial Science and Technology Progress Awards (two as the first completer). He has published more than 30 academic papers, been granted over 20 invention patents, and co-compiled more than 10 standards.

Zhaoyang He is currently the Chief Technology Officer of AscendGrace, Beijing, China, where he leads the company’s AI research and product strategy. His work focuses on large language models and agentic AI systems, including LLM-based autonomous agents, multi-agent collaboration, tool use, and reasoning, as well as their applications in intelligent software analysis. He has led the development of several AI platforms and built a domain-specific large language model, and holds over ten AI-related patents. He won the First Prize in the AI Special Track of the 6th Qiangwang Cup. His areas of interest include LLM agents, AI-driven code intelligence, and applied machine learning.
Journal of Cyber Security and Mobility, Vol. 15_5, 1391–1418
doi: 10.13052/jcsm2245-1439.15510
© 2026 River Publishers