Random Number Generators Based on EEG Non-linear and Chaotic Characteristics
Dang Nguyen, Dat Tran, Wanli Ma and Dharmendra Sharma
Faculty of Science and Technology, University of Canberra, ACT 2601, Australia
E-mail: Dang.van.Nguyen@canberra.edu.au; dat.tran@canberra.edu.au
Received 1 December 2017; Accepted 13 December 2017;
Publication 2 January 2018
Abstract
Current electroencephalogram (EEG)-based methods in security have been mainly used for person authentication and identification purposes only. The non-linear and chaotic characteristics of EEG signal have not been taken into account. In this paper, we propose a new method that explores the use of these EEG characteristics in generating random numbers. EEG signal and its wavebands are transformed into bit sequences that are used as random number sequences or as seeds for pseudo-random number generators. EEG signal has the following advantages: 1) it is noisy, complex, chaotic and non-linear in nature, 2) it is very difficult to mimic because similar mental tasks are person dependent, and 3) it is almost impossible to steal because the brain activity is sensitive to the stress and the mood of the person and an aggressor cannot force the person to reproduce his/her mental pass-phrase. Our experiments were conducted on the four EEG datasets: AEEG, Alcoholism, DEAP and GrazA 2008. The randomness of the generated bit sequences was tested at a high level of significance by comprehensive battery of tests recommended by the National Institute of Standard and Technology (NIST) to verify the quality of random number generators, especially in cryptography application. Our experimental results showed high average success rates for all wavebands and the highest rate is 99.17% for the gamma band.
Keywords
- Random number generator
- EEG
- NIST Test Suite
- Security
- Cryptography
1 Introduction
Random number generators (RNGs) are algorithms designed to produce sequences of numbers that appear to be random. RNGs play a crucial role in many applications such as cryptography, machine learning, Monte Carlo computation and simulation, industrial testing and labeling, hazard games, lotteries, and gambling.
In applications where provability is essential, randomness sources (if involved) must also be provably random; otherwise, the whole chain of proofs collapses. In cryptography, due to Kerckhoffs principle where all parts of protocols are publicly known except a secret (the key or other information) that only the sender and the recipient know, it is clear that the secret must not be predictable or calculable by an eavesdropper, i.e., it must be random. For example, the well-known BB84 quantum key distribution protocol [7] would be completely insecure if only an eavesdropper could predict (or calculate) either Alices random numbers or Bobs random numbers or both. From analysis of the secret key rate presented therein, it is obvious that any predictability of random numbers by the eavesdropper would leak relevant information to him, thus diminishing the effective key rate. It is intriguing [34] that in the case that the eavesdropper could calculate the numbers exactly, the cryptographic potential of the BB84 protocol would be zero. Indeed one of the recent successful attacks on quantum cryptography exploits the possibility to control local quantum RNGs by exploiting a design flaw of two commercial quantum cryptographic systems and one practical scientific system. This example shows that the local RNGs assumed in BB84 are essential for its security and may not be exempt from the security proof.
Lotteries are yet another serious business where random numbers are essential. Due to the large sum of money involved (estimated six billion USD annually only online and only in the USA [18]), some countries have set explicit requirements for RNGs for use in online gambling and lottery machines and have set certificate issuing authorities. For example, the Lotteries and Gaming Authority (LGA) of Malta has prescribed a list of requirements for RNGs, stipulated in the Remote Gaming Regulations Act. An RNG that does not conform to this act may not be legally used for gambling business. These rules have been put forward in order to ensure fair game by providers and to prevent possibility that gamers manipulate the system by foreseeing outcomes.
RNGs have been an occupation of scientists and inventors for a long time. Whole branches of mathematics have been invented out of a need to understand random numbers and ways to obtain them. At the dawn of the modern computing era, John von Neumann was one of the first to note that deterministic Turing computers are not able to produce true random numbers, as he put it in his well-known statement that Anyone who considers arithmetical methods of producing random digits is, of course, in a state of sin.
RNGs are one of the hottest topics of research in recent years. There have been about 83 patents per year in the last decade, 1418 in total since 1970, and countless scientific articles published regarding true RNGs. Still, a sharp discrepancy between the number of publications and the very modest number of products (only four quantum RNGs and a handful of Zener noise-based mostly phased-out RNGs) that ever made it to the market clearly indicate the art of immaturity.
Historically, there have been two approaches to random number generation which are algorithmic (pseudo-random) approach and physical process (nondeterministic) one.
Pseudo-random number genrators (RNGs) are also known as deterministic methods that use a mathematical algorithm to produce a long sequence of random numbers. PRNGs have requirements on seed to output a number. If the seed is secret and the algorithm is well-designed, the output number will be unpredictable. Advantages of PRNGs are their low cost, ease of implementation, and user-friendliness, especially in a CPU-available environment such as a PC computer. Moreover, a good RNG should work efficiently, which means that it should be able to produce a large amount of random numbers in a short period of time. For applications like stochastic simulation, stream ciphers, the masking of protocols, and online gambling, huge amounts of random numbers are necessary and thus fast RNGs are required.
While most modern PRNGs pass all known statistical tests, there are myths about some PRNGs being much better than the others. The truth is that every PRNG shows its weakness in some particular application. Indeed PRNGs are often found to be the cause of erroneous stochastic simulations and calculations [11, 13]. As for cryptographic purposes, all major families of PRNGs have been cryptanalyzed so far [32], and use of PRNG where an RNG should be used will therefore present a big security risk for the protocol in question.
For example, the pseudo-random number generator (PRNG) used in Windows operating system is the most commonly used PRNG. The pseudo-randomness of the output of this generator is crucial for the security of almost any application running in Windows. Nevertheless, its exact algorithm was never published. In [12] an attacker can learn future outputs in O(1) time and compute past outputs in O(223) time. These attacks can be run within seconds or minutes on a modern PC and enable such an attacker to learn the values of cryptographic keys generated by the generator. The attacks on both forward and backward security reveal all outputs until the time the generator is rekeyed with system entropy. Given the way in which the operating system operates the generator, this means that a single attack reveals 128 KBytes of generator output for every process.
On the other hand, true random numbers or physical non-deterministic random number generators (TRNGs) seem to be of an ever-increasing importance. Today, true random numbers are most critically required in cryptography and its numerous applications to our everyday life such as mobile communications, e-mail access, online payments, cashless payments, ATMs, e-banking, Internet trade, point of sale, prepaid cards, wireless keys, general cyber security, and distributed power grid security.
However, the characteristics of TRNGs are opposite to those of PRNGs. TRNGs are often biased, this means for example that on average their output might contain more ones than zeros and therefore does not correspond to a uniformly distributed random variable. This effect can be balanced by different means, but this post-processing reduces the number of useful bits as well as the efficiency of the generator. Another problem is that some TRNGs are very expensive or need at least an extra hardware device. In addition, these generators are often too slow for the intended applications. Despite the arguments above, TRNGs have their place in the arsenal. They are used to generate the seed or the continuous input for RNGs.
For implementation, RNGs can be implemented in either hardware or software. Random number generation performed by software utilizes a mathematical algorithm that produces a sequence of statistically independent numbers following a uniform distribution. However, this sequence is deterministic given the algorithm and the seed. While it is possible to implement a mathematical algorithm in hardware and call it a “hardware random number generator”, these particular RNGs clearly belong to the category of pseudo-random number generators because they require a seed and produce a deterministic sequence of numbers. True random number generation in hardware depends upon the random characteristics of some physical systems; for example lava lamps, radioactive decay of atomic nuclei, or noise from a resistor or diode. One of the most important properties of such generators is that they do not need any seed to start producing random sequences.
Biometrics is the science and technology of measuring and statistically analyzing biological data. In information technology, biometrics usually refers to techniques for measuring and analyzing human body characteristics such as fingerprints, eye retinas and irises, voice patterns, facial patterns, and hand measurements, especially for authentication and identification. This kind of application needs to study stationary properties uniquely determined by the attributes of each individual.
Moreover, we believe biometrics have another potential application. Inherent to each biometric measurement is a variability, which is the result of different measurement conditions and ways in which the user presents his or her features to the scanner. This variability effectively represents randomness, which, if extracted, could then be used as a seed for pseudo-random number generators, or directly as a random number sequence: [15, 16, 35]. However, they have some limitations because they are not very secret as expected that can affect to the biometrics-based RNGs in random number regeneration. For example, fingerprint can be changed through human’s life, face and iris information can be photographed, and handwriting may be mimicked [22]. Voice can be recorded while a user is speaking. In addition, an adversary can be easy to capture these biometrics by forcing the legitimate user such as threatening with a gun.
In this paper we propose to improve and advance the current state of biometric-based random number generators from EEG source which has disadvantages of low sampling rate and low resolution, but has several advantages: 1) it is noisy, complex and chaotic, and non-linear in nature [1, 28, 31], 2) it is very difficult to mimic because similar mental tasks are person dependent, and 3) it is almost impossible to steal because the brain activity is sensitive to the stress and the mood of the person: an aggressor cannot force the person to reproduce his/her mental pass-phrase [20].
The major contributions of this article are as follows. We explore the randomness of EEG data in order to use them (after codification in integer or bit format) as seeds for pseudo-random number generators or, directly, as random number sequences. We choose the EEG data as a new and promising information source, and develop an algorithm for extracting the inherent randomness. We investigate the use of individual frequency wavebands as random number generators because the wavebands may yield more accurate information about constituent neuronal activities underlying the EEG and consequently, certain changes in the EEG that are not evident in the original full-spectrum EEG may be amplified when each sub-band is analyzed separately [2]. We validate the randomness of four EEG datasets which are Australian EEG, Alcoholism, DEAP, GrazA 2008 datasets. The randomness of the generated bit sequences was then verified at a high level of significance by the standard NIST Test Suite (recommended by the National Institute of Standards and Technology).
These results therefore will open potential possibilities of generating true random numbers for biometrics-based systems to be added to the traditional ones based on physical systems. The main advantage of this alternative in eventual implementations would be, apart from privacy, to provide random bits in real time in a simple and very portable way.
2 Related Work
Since the variability effectively represents randomness, however, biometrics present opportunities for use in random number generation mechanisms as a source of randomness, if such variability can be extracted in a meaningful way.
This concept has been first explored by Sczepanski et al. in [35]. Their method is based on the observation that measurements of physical phenomena yield values that fluctuate randomly in their rightmost decimal digits. The values are partitioned into numbered intervals and then used to generate bits based on interval membership, one bit per value. The authors have tested the method on neurophysical brain signals and galvanic skin response, and statistical tests show that the resulting binary sequences have good randomness properties. The generic construction of the method also makes it possible for the method to be used with any biometrics where the results of the measurements can be quantized to decimal values in a meaningful manner. However, the method requires large datasets of values to generate longer bitstrings, and its security is dependent on the security of the measurement process of the biometrics used. They tested their binary sequences on FIPS statistical tests including four tests: monobit test, poker test, run test, and long run test, Mau-rer universal test and the Lempel-Ziv complexity test. Except the Lempel-Ziv test was been withdrawn by the NIST, other tests belong to the NIST STS that are more difficult to pass.
Moreover, a true random number generator based on the data of fingerprint (FPTRNG) is designed in [39], from the fact that middle grayscale pixels of fingerprint image have large random information. The FPTRNG extracts random information from fingerprint image. It is a true random number generator and is able to produce high quality random number. Its efficiency is high. As the fingerprint image always has large information and the random number generated from it is dedicated to using in fingerprint authentication system, it meets the system requirement for random number. In addition, [15] presents and evaluates the idea of using variability in captured samples could be potentially used to obtain truly random bit sequences, which could be used as a seed for PRNG, or as a random number by itself. The proposed method uses fingerprints as the measured biometric and aims to provide a readily available means of generating random numbers on mobile devices equipped with fingerprint readers.
In [16], strong random numbers are generated from using physical, bio-metric data by investigates how to combine biometric feature extraction and random number generation, how to generate the random numbers and how to verify claimed randomness properties. Simulation results are presented. Their idea presents that, independent from the biometric modality, the only requirement of the proposed solution is feature vectors of fixed length and structure. Each element of such a feature vector is analysed for its reliability, only unreliable positions, which cannot be reproduced coherently from one source, are extracted as bits to form the final random bit sequences. Optionally a strong hash-based random extraction can be used. The practicability presents testing vascular patterns against the NIST-recommended test suite for random number generators.
A recent study [10] indicates that the EEG signals can be treated as indirect random number generator that uses a transformation to output a random number. However, this method only works for input data as integers to generate three-sequence output. Another proposal proposes the use of EEG directly as random number generator in [26]. The limitation of this method may be that it is only applied for the positive real numbers, and this method generates only seven sequences of bits that are quite small.
3 EEG Characteristics
EEG is measurement of the electrical field over the scalp. This electrical field is generated by the synaptic currents within the dendrites of many neurons in the cerebral cortex. The membrane transport proteins pump ions across their neuron membranes and make the neurons electrically charged. This exchanging of ions helps the neuron maintain resting potential and to propagate action potentials. Ions of similar charge repel each other. These ions, after being pushed out, can push their neighbouring ions who in turn push their neighbours. This process creates a wave of ions and is known as volume conduction. When this wave reaches the electrodes on the scalp it creates the difference in voltages between any two electrodes, and can be measured by a voltmeter which gives us the EEG [31].
Because the human head is composed of a number of layers including the scalp, skull, brain and others in between, only the synchronous activity of a large number of active neurons can generate enough potential to be picked up by EEG. EEG activity, therefore, represents a sum of the activity of millions of neurons having similar spatial orientation. Pyramidal neurons of the cortex are well-aligned together. Therefore they are thought to be the main-source EEG signal. By comparison, deep brain activity is more difficult to detect because the voltage fields drop by a factor of the square of distance [31].
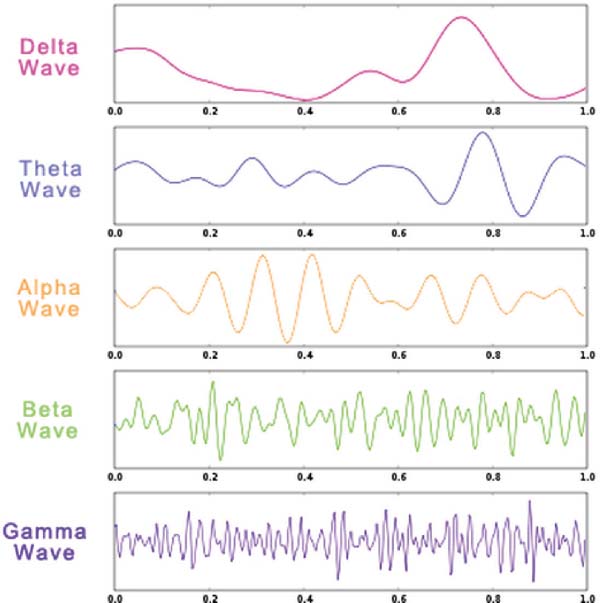
Figure 1 Wavebands example. It can be seen that the gamma and beta wavebands change less widely than others.
3.1 Rhythms of EEG
The amplitudes and frequencies of EEG signals change according to the state of a human such as consciousness or unconsciousness [31]. There are five major brainwave patterns differentiated by their frequency ranges including delta (δ), theta (𝜃), alpha (α), beta (β), and gamma (γ) (see Figure 1).
- Delta waves: Delta wave frequency lies between 0.5 and 3 Hz, with variable amplitude [24]. Delta waves are associated with deep sleep, and are thought to indicate physical deficiencies in the brain when in the waking state.
- Theta waves: Theta waves are within the range of 4 to 7 Hz, with an amplitude usually greater than 20 μV. Theta waves are caused by emotional stress, such as frustration or disappointment. Theta waves are associated with creativity and deep contemplation [24].
- Alpha waves: The frequency of alpha waves ranges from 8 to 13 Hz and has a voltage ranging from 30 to 50 μV . Alpha waves are associated with relaxed awareness and inattention; however, they seem to indicate an empty mind rather than a relaxed one.
- Beta waves: For beta waves the rate of change lies between 14 and 30 Hz, and has 5–30 μV amplitude [24]. Beta waves are the brainwaves of alertness, and a wakeful state. They are usually associated with logic, analytical and intellectual thinking, active attention and concrete problem solving.
- Gamma waves: Gamma waves lie within the range > 30 Hz and above. Gamma waves usually have low amplitudes, rare occurrence, and relate to left index finger, right toes, and tongue movement [31].
The first human EEG recording was made by Hans Berger in 1924. An EEG recording is obtained by placing on the scalp electrodes which are attached to a cap, net or headset. Conventional EEG sensors use a conductive gel or paste for the electrodes, but many new systems use dry electrodes. These greatly reduce the preparation time, making EEG more accessible to new users [4]. Most applications and studies use a small number of electrodes around the movement-related regions, with locations and names used from the International 10–20 system. Additional electrodes can be added to the standard set-up when a demanding clinical or research application is required. Some high-density arrays can have 256 electrodes. Figure 2 illustrates a typical set of EEG signals in a normal adult brain activity.
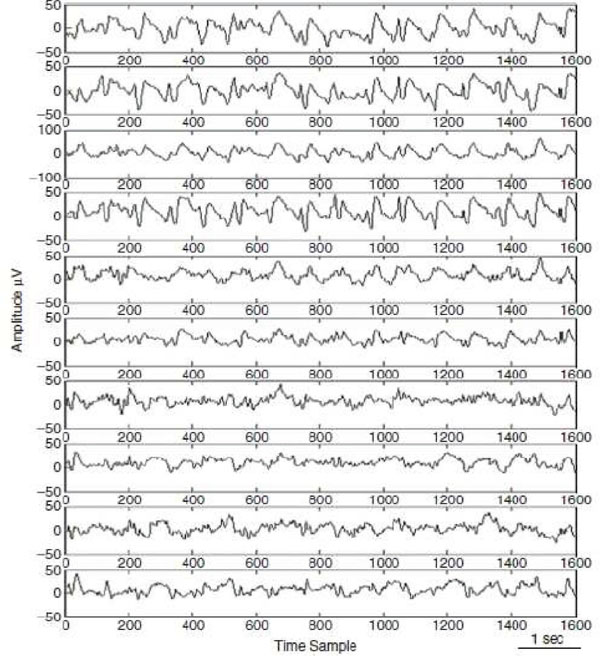
Figure 2 A typical set of EEG signal in a normal adult brain activity [31].
Despite several disadvantages, such as low spatial resolution, poor signal-to-noise ratio and an inability to determine neural activities deeply below the cortex, the EEG has a number of advantages. First, hardware costs are significantly lower than other techniques such as Functional magnetic resonance imaging (fMRI), Positron emission tomography (PET) or Magne-toencephalogram (MEG) [37]. Second, EEG sensors are more portable than those used in other techniques (fMRI, PET, MEG). Third, the EEG has very-high temporal resolution, usually between 250 and 2000 Hz in clinical and research settings. Finally, the EEG is relatively tolerant of subject movement and methods exist for eliminating movement artifacts in EEG data [25].
3.2 EEG Analysis of Non-linear and Chaotic Characteristics
Linear analysis of EEG signals includes frequency analysis (e.g. Fourier and Wavelet Tranforms) and parametric modeling (e.g. autoregressive models). In general, linear methods can be successfully applied in the study of several problems [3, 5, 14]. However, despite good results have been obtained with linear techniques, they only provide a limited amount of information about the electrical activity of the brain because they ignore the underlying non-linear EEG dynamics. As it is widely accepted, the underlying subsystems of the nervous system that generates the EEG signals are considered non-linear or with non-linear counterparts [38]. Even in healthy subjects, the EEG signals show the chaotic behavior of the nervous system. A brain is also considered a chaotic dynamical system and hence their generated EEG signals are generally chaotic [31, 36].
Besides that, an EEG signal is chaotic in another sense, because its amplitude changes randomly with respect to time. Therefore, due to this non-linear nature of EEG, additional information provided by techniques non-linear dynamics and chaos theory have been progressively incorporated in neurophysiology with the aim to understand the complex brain activity from EEG signals that cannot be measured from linear methods [33]. In particular, non-linear dynamics methods have been used to analyse epilepsy, depth of anesthesia, autism, depression and Alzheimers disease, mental fatigue, brain computer interfaces and emotion recognition [29].
4 NIST Statistical Test Suite
The NIST STS battery consists of 15 empirical tests specially designed to analyse binary sequences (bitstreams). The tests examine randomness of data according to various statistics of bits or statistics of blocks of bits. All NIST STS tests examine randomness for the whole bitstream. Several tests are also able to detect local non-randomness and these tests divide the bitstream into several typically large parts and compute a characteristic of bits for each part. All these partial characteristics are then used for the computation of the test statistic. Each NIST STS test is defined by the test statistic of one of the following three types and examines randomness of the sequence according to:
- bits – these tests analyse various characteristics of bits like proportion of bits, frequency of bit change (runs) and cumulative sums,
- m-bit blocks – these tests analyze distribution of m-bit blocks (m is typically smaller than 30 bits) within the sequence or its parts,
- M-bit parts – these tests analyse complex property of M-bit (M is typically larger than 1000 bits) parts of the sequence like rank of the sequence viewed as a matrix, spectrum of the sequence or linear complexity of the bitstream.
All tests are parametrized by n which denotes the bitlength of a binary sequence to be tested. Several tests are also parametrized by the second parameter denoted by m or M. Since the reference distributions of NIST STS test statistics are approximated by asymptotic distributions (χ2 or normal), the tests give accurate results (p-values) only for certain values of their parameters. Table 11 summarizes appropriate values of the parameters for each particular test recommended by NIST [30].
Table 1 The recommended size n of the bitstream for each particular test. Some tests are parameterized by a second parameter m, M, respectively. The table shows meaningful settings for the second parameter and the number of sub-tests executed by each particular test
| Test # | Test Name | n | m or M | # sub-tests |
| 1 | Frequency | n ≥ 100 | 1 | |
| 2 | Frequency within a Block | n ≥ 100 | M = 128 | 1 |
| 3 | Runs | n ≥ 100 | 1 | |
| 4 | Longest run of ones | n ≥ 128 | 1 | |
| 5 | Rank | n ≥ 38912 | 1 | |
| 6 | Spectral | n ≥ 1000 | 1 | |
| 7 | Non-overlapping TM | n ≥ 8m – 8 | m = 9 | 148 |
| 8 | Overlapping TM | n ≥ 106 | m = 9 | 1 |
| 9 | Maurer’s Universal | n ≥ 387840 | 1 | |
| 10 | Linear Complexity | n ≥ 106 | M = 500 | 1 |
| 11 | Serial | m = 16 | 2 | |
| 12 | Approximate Entropy | m = 106 | 1 | |
| 13 | Cumulative | n ≥ 100 | 2 | |
| 14 | Random Excursions | n ≥ 106 | 8 | |
| 15 | Random Excursions Variant | n ≥ 106 | 18 |
Several of the NIST STS tests are performed in more variants, i.e., they execute several sub-tests and examine more properties of the sequence of the same type. For instance, the Cumulative sum test examines a sequence according to forward and backward cumulative sum. Table 1 also summarizes the number of sub-tests performed by each particular test. The Non-overlapping template matching test is marked by an asterisk since the number of its sub-tests is not fixed and depends on the value chosen for the parameter m (the number 148 mentioned in the Table 1 corresponds to the default value of the parameter m = 9).
There are several ways to interpret a set of p-values computed by an empirical test of randomness. NIST adopted the following two ways:
- The examination of the proportion of sequences that pass a certain statistical test relative number of sequences passing the test should lie within a certain interval.
- The uniformity testing of p-values: p-values computed for random sequences should be uniformly distributed on the interval [0; 1). Uniformity of p-values can be tested again using statistical tests (uniformity of p-values forms a hypothesis).
4.1 Proportion of Sequences Passing Tests
The probability that a random sequence passes a given test is 1 -α that is equal to the complement of the significance level α. For multiple random sequences, the ratio of passed sequences to all sequences in a given test is usually different but close to 1 - α and hence should fall into a certain interval around 1 - α with a high probability. The interval is computed using the significance level α as
where k is the number of tested sequences. The acceptable ratio of passed sequences to all tested sequences should fall within the interval 0.99 ± 0.02985 for the significance level α = 0.01 and the total number of sequences k = 100. It means that if a data set of 100 sequences is tested in a NIST test such as Frequency test that results in more than 4 failed sequences, this data set is marked by an asterisk (*). This data set is considered as non-random for the examination of the proportion of passing tests if it has more than 7 asterisks (4%) [21].
We define the success rate in a test as the ratio of passed sequences to all tested sequences, and the failure rate as the ratio of failed sequences to all tested sequences in the NIST tests.
4.2 Uniformity of p-values
The p-values computed by a singe test should be uniformly distributed on the interval [0,1), and can be interpreted simply as: “the probability that a perfect random number generator would have produced a sequence less random than the sequence that was tested” [30]. For each statistical test, a set of p-values (corresponding to the set of sequences) is produced. The NIST uses one sample χ2 test to assess the uniformity of p-values. χ2 test measures whether the observed discrete distribution (histogram) of some feature follows the expected distribution. The χ2 test works well only for k/10 greater than 5.5. Therefore, the number of tested sequences should be at least 55 (k ≥ 55) to get a meaningful result for the uniformity test. For a fixed significance level, a certain percentage of p-values are expected to indicate failure. The NIST STS documentation recommends a very small value for the significance level α = 0.0001 for the uniformity test, i.e., p-values are considered as non-uniform if a p-value is smaller than 0.0001, and being marked by an asterisk (*). An α of 0.0001 indicates that one would expect one sequence in 10000 sequences to be rejected by the test if the sequence was random. For a p-value ≥ 0.0001, a sequence would be considered to be random with a confidence of 99.99%. For a p-value < 0.0001, a sequence would be considered to be non-random with the same confidence. The dataset of 100 sequences is considered as non-random for the uniformity testing if it has more than 3 asterisks (1.60%) for α = 0.0001 [21].

Figure 3 The frequency of down–down, down–up, up–down, and up–up in the EEG signals of all four datasets. The labels 1, 2, 3, 4 on the x-axis correspond to four datasets: AEEG, Alcholism, DEAP, GrazA 2008 respectively. Apparently, these four patterns are not uniformly distributed, so EEG signals cannot be good RNGs.
We define a non-uniformity rate as the ratio of non-uniform sequences to all tested sequences in the NIST STS. We aim to have a trade-off between the average of success rate, the failure rate and the non-uniformity rate on all tests.
5 Proposed Method of Binary Sequence Generation
According to the study conducted in [10], the EEG signal cannot be used directly as a source of random number generator and a transformation is required to transform the EEG signal into random sequences of bits. We verified the changing pattern frequency of four EEG datasets (described in Section 6) in the same way in [10]. As shown in Figure 3, the results are similar to [10] in which the frequency of four changing patterns, including up-up up-down, down-up, and down-down, are not uniformly distributed. Therefore, the EEG signal cannot be used directly as random number generators. This is clear proof that the EEG signal requires the transformation before used as random number generators.
We have conducted a similar approach to [10] on the Alcoholism dataset [6]. However, we found more failed tests than those presented in [10]. This could be the fact that our EEG dataset is quite different from the datasets in [10] that contain both negative and positive real numbers. Our EEG signals are measured in floating point values and also have small magnitude values. To handle the EEG signals in our case, we propose a new method in order to improve the success rate in randomness testing as follows. Let vector x be an original EEG signal sequence of n real number sample values:
In order to access the fluctuations in the EEG data, we multiply the original EEG data by 10d to keep significant precision up to d precision floating-point value to obtain integer value of EEG data. The value of d is based on the number of digits in fractional part from EEG raw data. Finally, we perform bit shift operation of b to the right. All these operations can be expressed as follows:
Finally, we compute binary sequences z as:
It is noted that yi is a real number after performing the bit shift operation in Equation (3), thus the modular operation yi mod 2 results in a real number.
6 EEG Datasets
6.1 Australian EEG Dataset (AEEG)
The Australian EEG Database is a collaboration project between the University of Newcastle and the John Hunter Hospital to convert 18,500 hospital EEG records into a web-based searchable database that takes 2 years to complete. The database consists of EEG data of patients, ranging from premature infants to people aged over 90 years.
The EEG data set was recorded using 3 common montages (neonate, infant and adult), bipolar connections and standard International System 10–20 electrode placements. Recordings were undertaken in the resting state with eyes open and eyes closed [17].
A subset of this Australian EEG dataset was used in this paper. It consists of EEG recordings of 80 patients. The recordings were downloaded with the search criteria that the recordings come from both men and women of various ages. The recordings were made by 23 electrodes placed on the scalp, sampled at 167 Hz for about 20 minutes.
6.2 Alcoholism
The Alcoholism datasets come from a study of EEG correlates of genetic predisposition to alcoholism Begleiter [6]. The datasets contain EEG recordings of control and alcoholic subjects. Each subject was exposed to either a single stimulus (S1) or to two stimuli (S1 and S2); which were pictures of objects chosen from the 1980 Snodgrass and Vanderwart picture set. When two stimuli were shown, they were presented in either a matched condition (where S1 was identical to S2) or in a non-matched condition (where S1 differed from S2). The 64 electrodes placed on the scalp were sampled at 256 Hz for 1 second.
There are three versions of the EEG datasets at different sizes: small, large and full datasets. This study uses the full dataset that contains 122 subjects with 120 trials for each.
6.3 BCI-Competition Graz Datasets
The Graz dataset A (GrazA 2008) in the BCI Competition 2008 comes from the Department of Medical Informatics, Institute of Biomedical Engineering, Graz University of Technology for motor imagery classification problem in BCI Competition 2008 [9].
The GrazA 2008 dataset consists of EEG recordings from 9 subjects. The subjects were right-handed, had normal or corrected-to-normal vision, and were paid to participate in the experiments. All volunteers sat in an armchair, and watched a screen monitor placed approximately 1 metre away at eye level. The recording was made with a 64-channel EEG amplifier from Neu-roscan at 250 Hz with time length 7 seconds for each trial. The GrazA dataset consists of two sessions on different days with, 288 trials per session. Each subject was required to do 4 motor-imagery tasks (left hand, right hand, foot, tongue). Twenty-two Ag/AgCl electrodes were used and the signals were bandpass-filtered between 0.5 Hz and 100 Hz. Each subject carried out left or right hand-motor imagery on two different days within two weeks. Each session consisted of six runs with ten trials each and two classes of imagery.
6.4 DEAP Dataset
DEAP is a dataset for emotion analysis using EEG (Dataset for Emotion Analysis using Electroencephalogram, Physiological and Video Signals) which is an open database proposed by Koelstra et al. [19]. EEG signals of 32 participants were recorded while they watched 40 one-minute long excerpts of music videos. Participants rated each video in terms of the levels of arousal, valence, like/dislike, dominance, and familiarity. The dataset includes two parts:
- The ratings from an online self-assessment, where 120 one-minute extracts of music videos were each rated by 14–16 volunteers based on arousal, valence and dominance.
- The participant ratings, physiological recordings and face video of an experiment in which 32 volunteers watched a subset of 40 of the above music videos. EEG and physiological signals were recorded and each participant also rated the videos as above.
The data set was recorded at a sampling rate of 512 Hz in two separate locations with 40 channels. The first 22 participants were recorded in Twente and the remaining in Geneva. Then the data was downsampled to 128 Hz, and segmented into 60 second trials and a 3 second pre-trial baseline removed.
6.5 Summary
The summary of those datasets is listed in Table 2, and Figure 4 shows the sample EEG signals of these datasets. In this figure, the four rows of signals from top to bottom are samples EEG signals from the AEEG, Alcoholism, DEAP and GrazA 2008 datasets, respectively.
Table 2 A brief description of EEG datasets
| Datasets | #Subjects | #Trials | #Sessions | Length (s) | Sampling (Hz) | #Channel |
| Australian EEG | 80 | 1 | 1 | 1200 | 167 | 23 |
| Alcoholism | 122 | 120 | 1 | 1 | 256 | 64 |
| DEAP | 32 | 40 | 1 | 60 | 128 | 40 |
| GrazA 2008 | 9 | 288 | 2 | 7.5 | 250 | 22 |
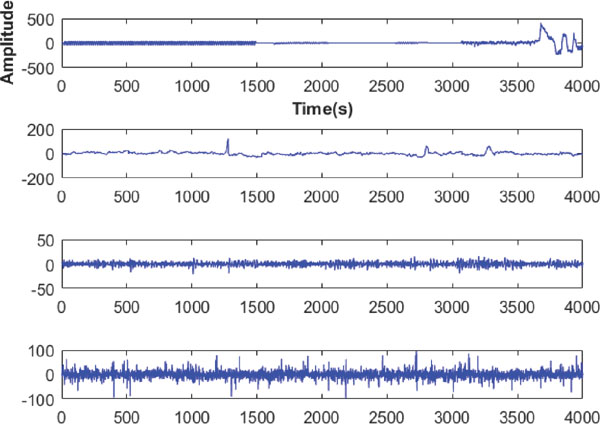
Figure 4 The sample EEG signals of four datasets. From top to bottom are examples from the AEEG, Alcoholism, DEAP and GrazA 2008 datasets, respectively. It can be seen that the EEG signal in GrazA 2008 dataset changes more wildly than other EEG signals.
7 Experimental Results
We carefully set up our experiments to be the two-factor experiments for a number of samples and a number of digits. Some parameters of the proposal can greatly affect the performance, setting different values on them jeopardizes the credibility of experiments. Therefore, we ensure the parameters of the method for all EEG datasets to be the same. For a number of digits, the Alcoholism and Australian EEG datasets adopted a constant number of d = 3, and the DEAP and GrazA 2008 adopted a constant of d = 4 due to the natural originality of their EEG raw data. For another factor, we first removed all subjects of each dataset that did not have enough samples to produce a single binary sequence of a million bits. For the remaining subjects, we combined its number of channels in a one-second EEG sample into a single set, and joined these single sets into an EEG sequence. Then, we used a suitable number of samples to generate a single binary sequence that contained a million bits. For an example of the Alcoholism dataset, we combined 64 channels in an one-second EEG sample into a single set for each subject. There were 112 subjects who had 62 one-second EEG samples, and we joined those 62 single sets into an EEG sequence for each of them. The 10 subjects left did not have enough 62 samples, so finally we produced 112 EEG sequences. Each EEG sequence was long enough to generate a single binary sequence that contained 62 × 64 × 256 = 1015808 bits. Setting parameters for NIST STS was the same as described in Section 4. Table 3 summarizes the experimental set up:
Table 3 Parameter settings for our experiments
| Datasets | Input | Output | ||||
| #Subjects | #Samples | #Channels | d | #Bits | #Sequences | |
| Alcoholism | 122 | 62 | 64 | 3 | 1015808 | 112 |
| AEEG | 80 | 261 | 23 | 3 | 1002501 | 78 |
| DEAP | 32 | 196 | 40 | 4 | 1003520 | 32 |
| GrazA 2008 | 9 | 182 | 22 | 4 | 1001000 | 9 |
In order to verify the randomness of EEG data, we conducted a number of experiments for all of EEG datasets in accuracy comparison of EEG and its five wavebands including alpha, beta, delta, gamma and theta. We also examined the proportion of passing sequences and tested the uniformity of p-values using three metrics: the success rate, the failure rate and the non-uniformity rate in which the non-uniformity rate was computed for 2 datasets due to a small number of sequences in the GrazA and DEAP datasets. We aimed to balance these metrics to maximize the success rate (as high as possible), and to minimize both the failure rate (<4.00) and non-uniformity rate (<1.60). We conducted the experiments in Matlab R2015b on a DELL PC with i5-5200U 2.20 GHz processors, 8.00 GB memory, and Windows 7.0 operating system.
7.1 Can EEG be Random Number Generators?
We firstly tested our method for the EEG signal to investigate whether EEG can be used directly as random number generator. Since the method is based on the number of right-shift bits, we varied the value of b from 1 to the maximum bit of 11. We used the EEG datasets which has the resolution of 11 bits to experiment the effect of b on randomness through by the success rate, the failure rate and the non-uniformity rate. We expected to find out a number of right-shift bits that balances the three rates. Figure 5 demonstrates a variation of these rates on the four datasets, and it shows that these values differ from EEG datasets: 9 for GrazA, 1 for DEAP, 7 for AEEG and 4 for Alcoholism. While two curves of the success and failure rates are nearly constant of high values for the GrazA (Figure 5(a)), the success rate decreases slowly, but the failure rate goes down quickly when b increases for the DEAP (Figure 5(b)). On the other hand, these curves fluctuate for the AEEG, and especially, “randomly” for Alcoholism datasets. The reason can be from the chaotic and complex characteristics of EEG signals [31].
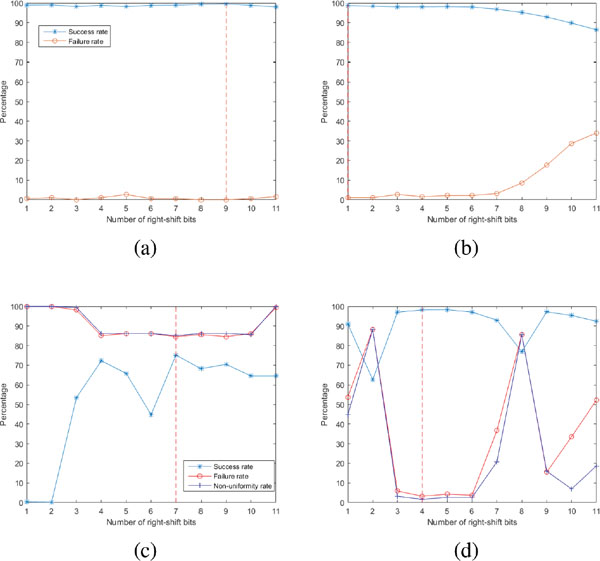
Figure 5 A change of success and failure rates on different right-shift bits: (a) GrazA, (b) DEAP, (c) AEEG and (d) Alcoholism. GrazA and DEAP datasets do not have p-values, but AEEG and Alcoholism have as they contain more than 55 tested sequences.
Table 4 Statistical results of EEG at the trade-off of three rates. The Alcoholism and AEEG have high non-uniformity rate, and the DEAP failed on two important tests of Block frequency and FFT
| Datasets | b | Success Rate | Failure Rate | Non-uniformity Rate |
| GrazA | 9 | 99.52 | 0.00 | – |
| DEAP | 1 | 98.69 | 1.06 (Block frequency, FFT) | – |
| AEEG | 7 | 75.18 | 85.57 | 85.11 |
| Alcoholism | 4 | 98.21 | 3.19 | 1.60 |
Table 4 summarizes the results of statistical tests for the EEG signal that indicates the randomness of GrazA and DEAP datasets. However, the DEAP dataset failed on two important tests including block frequency and FFT, and hence it was not good random. Therefore, only GrazA 2008 can be used as a RNG. This result is similar to others in [10, 27]. It means that EEG signal will be a RNG if a small number of sequences generated but not on other cases.
In the next experiment, we performed our method for the five wavebands to investigate which waveband can be used directly as RNG. Figure 6 shows their performances. The row at bottom reporting for the theta band contains only three figures because the implementation of this band is dumped due to bad sequences generated when b = 9, so we do not present its results here for the Alcoholism dataset.
From Figure 6, it can be seen that except for the AEEG dataset at a number of digits b > 9 and DEAP with the delta band, the success rates for the proposed method are higher than 95%, and the failure and non-uniformity rates are lower 5%. The score gaps among different EEG datasets are also very small. This indicates that the proposed method is relatively effective in dealing with the datasets with separated tasks: GrazA 2008 of motor imaginary, DEAP of emotion, AEEG of epilepsy, and Alcoholism of alcohol. Figure 6 also shows that these sub-bands perform a little difference in which the gamma and beta bands seem to be the two best of performance (the second and fourth rows of curves from the top). The reason could be that these two sub-bands are less chaotic and complex than others [31], and our proposed method is deterministic and stable. As a result, the less chaotic and complex characteristics of the gamma and beta bands make lower variation that leads to higher performance.
7.2 Optimization of b
In this subsection, we investigate the number of digits b to maximize the success rate and minimize the failure and non-uniformity rates for each of sub-band. Table 5 lists scores of these three rates on different EEG datasets with different wavebands. Based on this table, it is hard to optimize b. For example of the alpha band, there are three different options for b being 8 of GrazA 2008, 3 of DEAP and 1 of AEEG and Alcoholism. Therefore, we performed a computational approach to optimize b as follows. We first considered a case for the success rate and the other two rates are computed the same. For each sub-band, we first grouped all scores of the success rate for 4 datasets into a table. Then, we computed an average of those as seen in Table 6 for an example of the alpha band. We finally sorted them by the order of success rate, failure rate and non-uniformity rate.
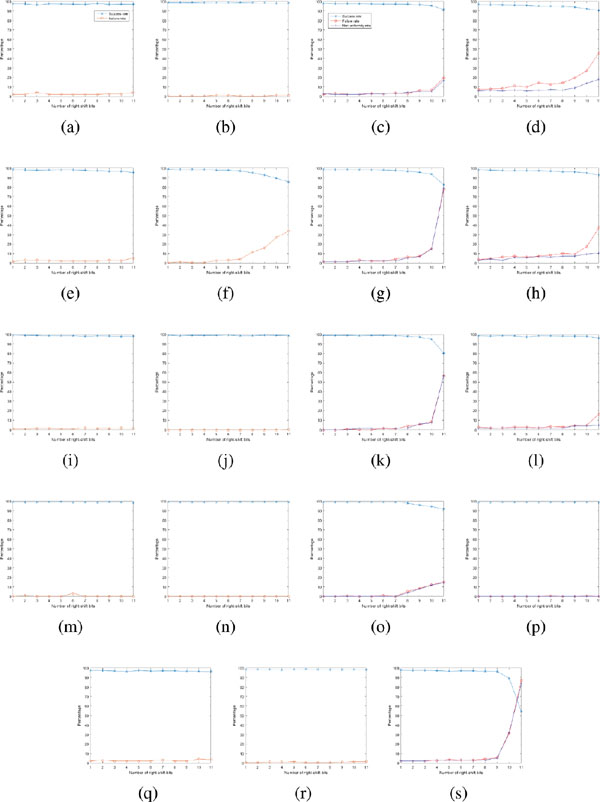
Figure 6 A summary of right-shift bits effects on the three rates. Left to Right: (a) GrazA 2008, (b) DEAP, (c) AEEG and (d) Alcoholism, respectively. Two left figures have only two curves because GrazA 2008 and DEAP datasets does not have p-values as they contains less than 55 tested sequences. Top to Bottom: Alpha, Delta, Beta, Gamma and Theta, respectively.
Table 5 Statistical results of the five EEG datasets
| b | 1 | 2 | 3 | 4 | 5 | 6 | 7 | 8 | 9 | 10 | 11 | ||
| GrazA | Alpha | SR | 97.64 | 97.28 | 96.57 | 97.34 | 97.20 | 97.16 | 96.93 | 97.70 | 96.93 | 97.10 | 97.00 |
| FR | 2.13 | 2.13 | 4.26 | 2.13 | 2.13 | 2.13 | 2.13 | 2.13 | 2.66 | 2.66 | 4.26 | ||
| Delta | SR | 98.64 | 97.93 | 97.80 | 97.93 | 98.05 | 98.00 | 97.70 | 97.34 | 96.69 | 96.72 | 95.33 | |
| FR | 1.60 | 3.19 | 3.19 | 2.66 | 2.13 | 2.13 | 2.13 | 2.13 | 3.19 | 2.66 | 5.32 | ||
| Beta | SR | 99.17 | 99.05 | 98.88 | 98.52 | 98.70 | 98.62 | 97.93 | 98.48 | 98.35 | 97.86 | 98.23 | |
| FR | 1.06 | 1.06 | 1.60 | 1.60 | 1.06 | 1.06 | 2.13 | 1.60 | 1.60 | 2.13 | 1.60 | ||
| Gamma | SR | 99.14 | 98.98 | 98.86 | 99.17 | 99.53 | 98.68 | 98.88 | 98.70 | 99.26 | 98.90 | 98.51 | |
| FR | 0.00 | 1.06 | 0.00 | 0.00 | 0.00 | 3.19 | 0.00 | 0.00 | 0.00 | 0.00 | 0.00 | ||
| Theta | SR | 97.34 | 97.28 | 96.92 | 96.40 | 97.34 | 96.87 | 96.98 | 96.99 | 96.69 | 96.51 | 96.30 | |
| FR | 2.13 | 2.66 | 2.13 | 2.13 | 2.13 | 2.13 | 3.19 | 2.13 | 2.13 | 4.26 | 3.72 | ||
| DEAP | Alpha | SR | 98.94 | 98.88 | 98.99 | 98.78 | 98.75 | 98.76 | 98.91 | 98.80 | 98.64 | 97.98 | 98.59 |
| FR | 0.53 | 0.53 | 0.53 | 0.53 | 1.06 | 1.06 | 0.53 | 0.53 | 0.53 | 1.06 | 1.06 | ||
| Delta | SR | 98.86 | 98.68 | 98.75 | 98.50 | 97.88 | 97.86 | 96.90 | 95.17 | 92.68 | 89.30 | 85.45 | |
| FR | 0.53 | 1.06 | 0.53 | 0.53 | 2.66 | 3.19 | 4.26 | 11.70 | 15.96 | 27.13 | 33.51 | ||
| Beta | SR | 99.12 | 98.66 | 99.00 | 98.92 | 99.00 | 99.18 | 98.60 | 98.66 | 99.09 | 99.00 | 98.72 | |
| FR | 0.00 | 0.00 | 0.00 | 0.00 | 0.00 | 0.00 | 0.00 | 0.00 | 0.00 | 0.00 | 0.53 | ||
| Gamma | SR | 99.22 | 98.96 | 98.86 | 99.02 | 98.72 | 98.70 | 99.08 | 99.15 | 99.12 | 99.07 | 99.25 | |
| FR | 0.00 | 0.00 | 0.00 | 0.00 | 0.00 | 0.00 | 0.00 | 0.00 | 0.00 | 0.00 | 0.00 | ||
| Theta | SR | 98.58 | 98.50 | 98.55 | 98.04 | 98.55 | 98.80 | 98.43 | 98.16 | 98.36 | 98.37 | 98.32 | |
| FR | 0.53 | 0.53 | 1.06 | 1.06 | 1.60 | 0.53 | 0.53 | 0.53 | 1.06 | 1.60 | 1.60 | ||
| AEEG | Alpha | SR | 97.86 | 97.53 | 97.62 | 97.38 | 97.22 | 97.17 | 97.17 | 97.09 | 96.55 | 95.62 | 91.45 |
| FR | 2.13 | 3.19 | 2.13 | 2.13 | 3.19 | 2.66 | 3.72 | 3.19 | 6.38 | 6.91 | 19.68 | ||
| NUR | 2.66 | 2.13 | 2.13 | 2.13 | 2.66 | 2.66 | 3.19 | 4.26 | 5.32 | 5.32 | 17.02 | ||
| Delta | SR | 98.72 | 98.27 | 98.44 | 98.19 | 98.06 | 97.92 | 97.60 | 96.68 | 95.60 | 93.51 | 82.56 | |
| FR | 1.59 | 1.59 | 1.59 | 3.19 | 2.13 | 2.13 | 4.26 | 6.38 | 7.45 | 15.43 | 77.13 | ||
| NUR | 1.59 | 1.59 | 1.59 | 2.13 | 2.66 | 2.13 | 2.66 | 5.32 | 6.91 | 14.89 | 78.72 | ||
| Beta | SR | 99.01 | 98.84 | 98.98 | 98.70 | 98.88 | 98.96 | 98.73 | 98.08 | 97.22 | 94.95 | 80.27 | |
| FR | 0.00 | 0.00 | 1.06 | 0.53 | 0.53 | 1.59 | 1.06 | 4.26 | 5.85 | 8.51 | 56.38 | ||
| NUR | 0.00 | 0.00 | 0.53 | 1.59 | 1.59 | 2.13 | 1.59 | 2.13 | 6.38 | 7.45 | 56.38 | ||
| Gamma | SR | 98.90 | 99.04 | 99.03 | 98.98 | 98.93 | 98.96 | 98.99 | 97.92 | 96.10 | 94.50 | 91.89 | |
| FR | 0.00 | 0.00 | 0.53 | 0.00 | 0.00 | 1.06 | 0.00 | 5.31 | 8.51 | 12.23 | 14.89 | ||
| NUR | 0.00 | 0.00 | 0.00 | 0.00 | 0.00 | 0.00 | 0.00 | 3.72 | 7.98 | 11.70 | 14.36 | ||
| Theta | SR | 97.67 | 97.29 | 97.36 | 97.19 | 96.77 | 96.99 | 97.00 | 96.64 | 96.48 | 89.17 | 54.30 | |
| FR | 2.13 | 2.13 | 2.13 | 2.66 | 3.72 | 3.19 | 3.19 | 4.26 | 5.85 | 30.85 | 87.23 | ||
| NUR | 2.13 | 2.13 | 2.13 | 3.19 | 3.19 | 3.19 | 2.66 | 3.19 | 5.32 | 32.45 | 82.98 | ||
| Alcoholism | Alpha | SR | 96.89 | 96.66 | 96.29 | 96.15 | 95.86 | 95.32 | 95.04 | 94.63 | 93.96 | 92.26 | 90.65 |
| FR | 7.45 | 7.98 | 8.51 | 11.17 | 10.11 | 14.36 | 12.77 | 14.36 | 19.68 | 27.13 | 45.74 | ||
| NUR | 5.85 | 6.38 | 5.85 | 6.91 | 5.85 | 6.38 | 7.45 | 6.91 | 9.04 | 13.83 | 18.09 | ||
| Delta | SR | 98.11 | 97.85 | 97.58 | 97.45 | 97.35 | 97.12 | 96.76 | 96.10 | 95.99 | 95.08 | 92.53 | |
| FR | 3.72 | 4.79 | 6.38 | 7.45 | 6.38 | 7.45 | 8.51 | 10.11 | 9.57 | 17.55 | 37.23 | ||
| NUR | 3.19 | 4.26 | 3.19 | 5.85 | 5.85 | 6.91 | 6.38 | 7.45 | 7.45 | 9.57 | 10.64 | ||
| Beta | SR | 98.52 | 98.26 | 98.62 | 98.41 | 97.32 | 98.47 | 98.40 | 98.26 | 98.11 | 97.92 | 96.25 | |
| FR | 3.19 | 2.13 | 2.13 | 3.19 | 3.19 | 2.13 | 3.72 | 3.19 | 4.79 | 5.32 | 15.96 | ||
| NUR | 1.60 | 1.60 | 2.13 | 2.13 | 2.13 | 2.13 | 2.13 | 2.13 | 4.26 | 4.26 | 5.32 | ||
| Gamma | SR | 98.80 | 98.70 | 98.94 | 99.02 | 98.94 | 98.80 | 98.87 | 99.01 | 98.89 | 98.85 | 98.78 | |
| FR | 0.00 | 0.00 | 0.00 | 0.00 | 0.00 | 0.00 | 0.53 | 0.00 | 0.00 | 0.53 | 0.00 | ||
| NUR | 0.00 | 0.00 | 0.00 | 0.00 | 0.00 | 0.00 | 0.00 | 0.00 | 0.00 | 0.00 | 0.00 | ||
| Theta | – |
SR = success rate, FR = failure rate and NUR = non-uniformity rate.
Table 7 summarizes the results for all the five sub-bands. The table indicates that the optimization value of b is at 1 for the delta, theta, and at 4 for the gamma. For the two remaining cases, we select the optimization at 1 instead of 2 based on the following two reasons. The first reason is from an observation that two out of three rates are the best at 1, and the difference is very small (less than 0.3%). Another reason is from a study on Table 5 that the scores of the alpha and beta at b = 1 is better than at b = 2: higher on the success rate, and lower on others. The reasons of optimization can be as follows: (1) the frequencies of four wavebands (alpha, beta, delta and theta) are small and the amplitudes are short, (2) the frequency of gamma band is high at more than >30 Hz, and its amplitude is also long in comparison to other wavebands that results in larger values of gamma data. Therefore, the optimizing value of b is higher for gamma band than for others.
Table 6 The success rate of alpha band for optimizing the number of digits b. The highest of success rate is at b = 1
| b | 1 | 2 | 3 | 4 | 5 | 6 | 7 | 8 | 9 | 10 | 11 |
| GrazA | 97.64 | 97.28 | 96.57 | 97.34 | 97.20 | 97.16 | 96.93 | 97.70 | 96.93 | 97.10 | 97.00 |
| DEAP | 98.94 | 98.88 | 98.99 | 98.78 | 98.75 | 98.76 | 98.91 | 98.80 | 98.64 | 97.98 | 98.59 |
| AEEG | 97.86 | 97.53 | 97.62 | 97.38 | 97.22 | 97.17 | 97.17 | 97.09 | 96.55 | 95.62 | 91.45 |
| Alcoholism | 96.89 | 96.66 | 96.29 | 96.15 | 95.86 | 95.32 | 95.04 | 94.63 | 93.96 | 92.26 | 90.65 |
| Average | 97.83 | 97.59 | 97.37 | 97.41 | 97.26 | 97.10 | 97.01 | 97.06 | 96.52 | 95.74 | 94.42 |
Table 7 Optimizing results of the five wavebands in terms of the average of success rate, failure rate and non-uniformity rate (%). The optimization of b is at 1 for alpha, delta, theta, and beta, and at 4 for gamma
| b | 1 | 2 | 3 | 4 | 5 | 6 | 7 | 8 | 9 | 10 | 11 | |
| Alpha | SR | 97.83 | 97.59 | 97.37 | 97.41 | 97.26 | 97.10 | 97.01 | 97.06 | 96.52 | 95.74 | 94.42 |
| FR | 3.06 | 3.46 | 3.86 | 3.99 | 4.12 | 5.05 | 4.79 | 5.05 | 7.31 | 9.44 | 17.69 | |
| NUR | 4.26 | 4.26 | 3.99 | 4.52 | 4.26 | 4.52 | 5.32 | 5.59 | 7.18 | 9.57 | 17.55 | |
| Delta | SR | 98.58 | 98.18 | 98.14 | 98.02 | 97.84 | 97.72 | 97.24 | 96.32 | 95.24 | 93.65 | 88.97 |
| FR | 1.86 | 2.66 | 2.92 | 3.46 | 3.33 | 3.72 | 4.79 | 7.58 | 9.04 | 15.69 | 38.30 | |
| NUR | 2.39 | 2.92 | 2.39 | 3.99 | 4.26 | 4.52 | 4.52 | 6.38 | 7.18 | 12.23 | 44.68 | |
| Beta | SR | 98.96 | 98.70 | 98.87 | 98.64 | 98.48 | 98.81 | 98.42 | 98.37 | 98.19 | 97.43 | 93.37 |
| FR | 1.06 | 0.80 | 1.20 | 1.33 | 1.20 | 1.19 | 1.73 | 2.26 | 3.06 | 3.99 | 18.62 | |
| NUR | 0.80 | 0.80 | 1.33 | 1.86 | 1.86 | 2.13 | 1.86 | 2.13 | 5.32 | 5.85 | 30.85 | |
| Gamma | SR | 99.02 | 98.92 | 98.92 | 99.05 | 99.03 | 98.79 | 98.96 | 98.70 | 98.34 | 97.83 | 97.11 |
| FR | 0.00 | 0.27 | 0.13 | 0.00 | 0.00 | 1.06 | 0.13 | 1.33 | 2.13 | 3.19 | 3.72 | |
| NUR | 0.00 | 0.00 | 0.00 | 0.00 | 0.00 | 0.00 | 0.00 | 1.86 | 3.99 | 5.85 | 7.18 | |
| Theta | SR | 97.86 | 97.69 | 97.61 | 97.21 | 97.55 | 97.55 | 97.47 | 97.26 | 97.18 | 94.68 | 82.97 |
| FR | 1.60 | 1.77 | 1.77 | 1.95 | 2.48 | 1.95 | 2.30 | 2.31 | 3.01 | 12.23 | 30.85 | |
| NUR | 2.13 | 2.13 | 2.13 | 3.19 | 3.19 | 3.19 | 2.66 | 3.19 | 5.32 | 32.45 | 82.98 |
7.3 Randomness Testing
Table 8 shows a summary of scores of five wavebands at the optimised values of b. The table indicates that most of these wavebands have high proportion of passing tests, and low proportion of failing uniformity tests, except the alpha for Alcoholism dataset. While the results for gamma and beta bands can be considered random because all of the failure rates are smaller than 4%, and most of non-uniformity rates are less than 1.60%, the alpha, delta and theta bands cannot be considered as good random.
In addition, the results of statistical Test Suite are shown in Tables 9 and 10 for these wavebands. These results show that EEG signal achieves the worse performance, and three wavebands including alpha, delta and theta do not pass frequency, block frequency, approximate entropy, universal and serial tests that are some of the important tests, and it also supports the conclusion that they cannot be considered as random. For the beta band, the average success rate is very high at 98.96%, and the average failure rate is less than 4%. However, there is a case of Alcoholism dataset that the beta is not good random because it failed on three important tests (1.60%) for uniformity testing: block frequency, approximate entropy and serial. Therefore, it needs further investigation on the beta band.
Table 8 Comparison of EEG signal and its five wavebands in terms of the average of three rates (%). The gamma band achieves the highest success rate, and the lowest failure rate and non-uniformity rate
| GrazA | DEAP | AEEG | Alcoholism | Average | ||
| SR | EEG | 98.82 | 98.10 | 72.24 | 98.21 | 91.84 |
| Alpha | 97.64 | 98.94 | 97.86 | 96.89 | 97.83 | |
| Delta | 98.64 | 98.86 | 98.72 | 98.11 | 98.58 | |
| Beta | 99.17 | 99.12 | 99.01 | 98.52 | 98.96 | |
| Gamma | 99.17 | 99.02 | 98.98 | 99.02 | 99.05 | |
| Theta | 97.34 | 98.58 | 97.67 | – | 97.86 | |
| FR | EEG | 1.06 | 1.60 | 85.11 | 3.19 | 22.74 |
| Alpha | 2.13 | 0.53 | 2.13 | 7.45 | 3.06 | |
| Delta | 1.60 | 0.53 | 1.60 | 3.72 | 1.86 | |
| Beta | 1.06 | 0.00 | 0.00 | 3.19 | 1.06 | |
| Gamma | 0.00 | 0.00 | 0.00 | 0.00 | 0.00 | |
| Theta | 2.13 | 0.53 | 2.13 | – | 1.60 | |
| NUR | EEG | – | – | 86.17 | 1.60 | 43.88 |
| Alpha | – | – | 2.66 | 5.85 | 4.26 | |
| Delta | – | – | 1.60 | 3.19 | 2.40 | |
| Beta | – | – | 0.00 | 1.60 | 0.80 | |
| Gamma | – | – | 0.00 | 0.00 | 0.00 | |
| Theta | – | – | 2.13 | – | 2.13 |
Table 9 Summary of statistical tests for passing test in terms of failure rates. The proportion of failing tests of gamma band is at 0%
| Sub-bands | ||||||
| Datasets | Statistical Test | Alpha | Beta | Delta | Gamma | Theta |
| GrazA 2008 | Block Frequency Non overlapping Templates |
X | X | X | X | |
| Approximate Entropy | X | X | ||||
| Serial | X | X | X | |||
| DEAP | Block Frequency | X | X | X | ||
| FFT | ||||||
| AEEG | Block Frequency | X | X | X | ||
| Approximate Entropy Random Excursions | X | X | ||||
| Serial | X | X | ||||
| Frequency | ||||||
| Alcoholism | Block Frequency | X X | X | X | – | |
| Cumulative sums | – | |||||
| (Forward) | ||||||
| Cumulative sums | – | |||||
| (Reverse) | ||||||
| Runs | X | – | ||||
| FFT | – | |||||
| Non overlapping Templates | X | X | – | |||
| Universal | X | X | – | |||
| Approximate Entropy | X | X | X | – | ||
| Serial | X | X | X | – | ||
Table 10 Summary of statistical tests for uniformity in terms of non-uniformity rates. The uniformity tests of gamma band is at 100% of passing
| Sub-bands | ||||||
| Datasets | Statistical Test | Alpha | Beta | Delta | Gamma | Theta |
| AEEG | Block Frequency | X | X | X | ||
| Approximate Entropy | X | X | ||||
| Random Excursions | ||||||
| Serial | X | X | X | |||
| Block Frequency | X | X | X | – | ||
| Alcoholism | Cumulative sums | X | – | |||
| (Forward) | ||||||
| Cumulative sums | – | |||||
| (Reverse) | ||||||
| Runs | X | – | ||||
| Non overlapping Templates | X | X | – | |||
| Universal | X | – | ||||
| Approximate Entropy | X | X | X | – | ||
| Serial | X | X | X | – | ||
In contrast, for the gamma band, the average success rate is the highest at 99.05%, and it passes all of the NIST tests because all of the failure and no-uniformity rates are the lowest at 0%. Therefore, the gamma band is clearly random. These results approach the best results from other existing RNGs such as Blum-Blum-Shub [8], and Micali Schnorr [23] as shown in Table 11.
Table 11 Comparison on different methods for 112 sequences tested. p-values are all zero for three methods
| Proportion of Passing Sequences | |||
| Statistical Test | Proposed Method | Bum Bum Shub | Micali Schnorr |
| Frequency | 108/112 | 112/112 | 111/112 |
| Block Frequency | 112/112 | 111/112 | 112/112 |
| Cumulative Sums (Forward) | 109/112 | 112/112 | 111/112 |
| Cumulative Sums (Reverse) | 108/112 | 112/112 | 112/112 |
| Runs | 107/112 | 111/112 | 111/112 |
| Longest Runs of Ones | 112/112 | 110/112 | 111/112 |
| Rank | 111/112 | 110/112 | 109/112 |
| FFT | 111/112 | 109/112 | 112/112 |
| Non Overlapping Template (Total tests = 148) | 16425/16576 | 16404/16576 | 16419/16576 |
| Overlapping Template | 111/112 | 110/112 | 112/112 |
| Universal | 111/112 | 111/112 | 111/112 |
| Approximate Entropy | 110/112 | 112/112 | 112/112 |
| Random Excursions (Total tests = 8) | 603/608 | 572/576 | 561/568 |
| Random Excursions Variant (Total tests = 18) | 1352/1368 | 1291/1296 | 1276/1278 |
| Serial (Total tests = 2) | 222/224 | 222/224 | 221/224 |
| Linear Complexity | 112/112 | 112/112 | 112/112 |
| Average Success Rate | 99.02% | 99.05% | 99.13% |
8 Conclusion
In this paper, we have proposed the new method to transform EEG signal and its wavebands into sequences of bits that can be used as a random number generators. Since our method does not require the use of seed to generate random numbers, it can be considered as TRNGs. It could also be used as a seed provider to improve randomness in PRNGs. Experimental results on the five datasets show that the proposed method achieves significantly high performance in success rate, and perform competitively in efficiency. The method will open potential possibilities of generating true random sequences of bits for biometrics-based systems to be added to the traditional ones based on physical systems.
For future work, this approach will be investigated further to validate the efficiency of our proposed method on large publicly available EEG datasets. Other biometric signals such as EMG (electromyogram) and ECG (electro-cardiography) will also be considered for randomness. Further candidates to biometric random number generators include blood volume pulse and similar easy-to-get measurements that, even when regular on the surface, may contain randomness in their internal structure. Any of these possibilities might be very important from the point of view of the implementation of our algorithms for generating random bit sequences via biometric-based methods.
References
[1] Acharya, U. R., Sree, S. V., Ang, P. C. A., Yanti, R., and Suri, J. S. (2012). Application of non-linear and wavelet based features for the automated identification of epileptic EEG signals. Int. J. Neur. Syst. 22, 1250002.
[2] Adeli, H., Ghosh-Dastidar, S., and Dadmehr, N. (2007). A wavelet-chaos methodology for analysis of EEGs and EEG subbands to detect seizure and epilepsy. IEEE Transactions on Biomedical Engineering, 54, 205–211. doi: 10.1109/TBME.2006.886855
[3] Al-Fahoum, A. S., and Al-Fraihat, A. A. (2014). Methods of EEG signal features extraction using linear analysis in frequency and time-frequency domains. ISRN Neuroscience. http://dx.doi.org/10.1155/2014/730218
[4] Allison, B. (2011). Trends in BCI research: progress today, backlash tomorrow?. XRDS: Crossroads, The ACM Magazine for Students, 18, 18–22. doi: 10.1145/2000775.2000784
[5] Anderson, C. W., Stolz, E. A., and Shamsunder, S. (1998). Multivariate autoregressive models for classification of spontaneous electroencephalographic signals during mental tasks. IEEE Transactions on Biomedical Engineering, 45, 277–286. doi: 10.1109/10.661153
[6] Begleiter, H. (1999). EEG alcoholism database. Available at: https://kdd.ics.uci.edu/databases/eeg/eeg.data.html
[7] Bennett, C. H., and Brassard, G. (2014). Quantum cryptography: Public key distribution and coin tossing. Theor. Comput. Sci. 560, 7–11.
[8] Blum, L., Blum, M., and Shub, M. (1986). A simple unpredictable pseudo-random number generator. SIAM J. Computing, 15, 364–383..
[9] Brunner, C., Leeb, R., Müller-Putz, G., Schlögl, A., and Pfurtscheller, G. (2008). BCI Competition 2008–Graz data set A. Institute for Knowledge Discovery (Laboratory of Brain-Computer Interfaces), Graz University of Technology, 136–142.
[10] Chen, G. (2014). Are electroencephalogram (EEG) signals pseudo-random number generators?. J. Comput Appl. Math. 268, 1–4.
[11] Click, T. H., Liu, A., and Kaminski, G. A. (2011). Quality of random number generators significantly affects results of Monte Carlo simulations for organic and biological systems. J. Comput. Chem. 32, 513–524.
[12] Dorrendorf, L., Gutterman, Z., and Pinkas, B. (2009). Cryptanalysis of the random number generator of the windows operating system. ACM Transactions on Information and System Security (TISSEC), 13, 10.
[13] Ferrenberg, A. M., Landau, D. P., and Wong, Y. J. (1992). Monte carlo simulations: Hidden errors from “good” random number generators. Phy. Rev. Lett. 69, 3382.
[14] Garrett, D., Peterson, D. A., Anderson, C. W., and Thaut, M. H. (2003). Comparison of linear, non-linear, and feature selection methods for EEG signal classification. IEEE Transactions on Neural Systems and Rehabilitation Engineering, 11, 141–144.
[15] Gerguri, S. (2008). Biometrics Used for Random Number Generation (Doctoral dissertation, Masarykova univerzita, Fakulta informatiky).
[16] Hartung, D., Wold, K., Graffi, K., and Petrovic, S. (2011). Towards a biometric random number generator – a general approach for true random extraction from biometric samples.
[17] Hunter, M. R. L. L., Smith, R. L., Hyslop, W., Rosso, O. A., Gerlach, R., Rostas, J. A. P., and Henskens, F. et al. (2005). The australian eeg database. Clinical EEG and neuroscience, 36(2), 76–81.
[18] Jonsson, P. (2011). Boom in Internet gambling ahead? US policy reversal clears the way.
[19] Koelstra, S., Muhl, C., Soleymani, M., Lee, J. S., Yazdani, A., Ebrahimi, T., and Patras, I. et al. (2012). Deap: A database for emotion analysis; using physiological signals. IEEE Transactions on Affective Computing, 3, 18–31.
[20] Marcel, S., and Millán, J. D. R. (2007). Person authentication using brainwaves (EEG) and maximum a posteriori model adaptation. IEEE Transactions on Pattern Analysis and Machine Intelligence 29, 743–752.
[21] Marton, K., and Suciu, A. (2015). On the interpretation of results from the NIST statistical test suite. Romanian J. Inf. Sci. Technol. 18, 18–32. http://www.imt.ro/romjist/Volum18/Number18_1/pdf/02-MSys.pdf
[22] Matyáš, V., and Říha, Z. (2010). Security of biometric authentication systems. In International Conference on Computer Information Systems and Industrial Management Applications (CISIM), pp. 19–28. IEEE.
[23] Micali, S. and Schnorr, C. (1990) Pseudo-Random Sequence Generator, July 24 1990. US Patent 4,944,009.
[24] Ochoa, J. B. (2002). Eeg signal classification for brain computer interface applications. Ecole Polytechnique Federale De Lausanne, 7, 1–72. Available at: http://citeseerx.ist.psu.edu/viewdoc/download?doi=10.1.1.134. 6148&rep=rep1&type=pdf
[25] O’Regan, S., Faul, S., and Marnane, W. (2010). Automatic detection of EEG artefacts arising from head movements. In International Conference of Engineering in Medicine and Biology Society (EMBC), pp. 6353–6356. IEEE.
[26] Petchlert, B., and Hasegawa, H. (2014). Using a low-cost electroencephalogram (EEG) directly as random number generator. In International Conference of Advanced Applied Informatics (IIAIAAI), pp. 470–474. IEEE.
[27] Petchlert, B., and Hasegawa, H. (2014). Using a low-cost electroencephalogram (EEG) directly as random number generator. In International Conference of Advanced Applied Informatics (IIAIAAI), pp. 470–474. IEEE.
[28] Pijn, J. P., Van Neerven, J., Noest, A., and da Silva, F. H. L. (1991). Chaos or noise in EEG signals; dependence on state and brain site. Electroencephalography and clinical Neurophysiology, 79, 371–381.
[29] Rodríguez-Bermúdez, G., and García-Laencina, P. J. (2015).Analysis of eeg signals using non-linear dynamics and chaos: a review. Appl. Math. Inf. Sci. 9, 2309.
[30] Rukhin, A., Soto, J., Nechvatal, J., Barker, E., Leigh, S., Levenson, M., and Smid, M. et al. (2010). Statistical test suite for random and pseudorandom number generators for cryptographic applications, NIST special publication.
[31] Sanei, S., and Chambers, J. A. (2013). EEG Signal Processing. John Wiley & Sons.
[32] Sidorenko, A., and Schoenmakers, B. (2005). State Recovery Attacks on Pseudorandom Generators. WEWoRC, pp. 53–63.
[33] Stam, C. J. (2005). Non-Linear dynamical analysis of EEG and MEG: review of an emerging field. Clin. Neurophysiology 116, 2266–2301.
[34] Stipcevic, M. (2014). Preventing detector blinding attack and other random number generator attacks on quantum cryptography by use of an explicit random number generator. arXiv preprint arXiv:1403.0143.
[35] Szczepanski, J., Wajnryb, E., Amigó, J. M., Sanchez-Vives, M. V., and Slater, M. (2004). Biometric random number generators. Comput. Security 23, 77–84.
[36] Tong, S., and Thakor, N. V. (2009). Quantitative EEG Analysis Methods and Clinical Applications. Artech House.
[37] Vespa, P. M., Nenov, V., and Nuwer, M. R. (1999). Continuous EEG monitoring in the intensive care unit: early findings and clinical efficacy. J. Clin. Neurophysiology 16, 1–13.
[38] Wright, J. J., Kydd, R. R., and Liley, D. T. J. (1993). EEG models: Chaotic and linear. Psycoloquy, 4.
[39] Ying, L., Shu, W., Jing, Y., and Xiao, L. (2010, December). Design of a Random Number Generator from Fingerprint. In International Conference of Computational and Information Sciences (ICCIS), pp. 278–280. IEEE.
Biographies

Dang van Nguyen is a Ph.D. student at the University of Canberra in Canberra, Australia since 2015. He attended Ha Noi University of Science, Viet Nam where he received his B.Sc. in Mathematics in 2005, and his M.Sc. in Mathematics in 2007. Dang has held a researcher position in Academy of Cryptography Technique – Vietnam Government Information Security Commission (VGISC), Ha Noi, Viet Nam since 2006. He has acquired a solid experience in binary sequence generators and cryptographic key generation methods. His Ph.D. research work focuses on EEG analysis for random number generators, and develops an EEG-based cryptographic key generation system for cryptography application.
Dat Tran received his B.Sc. and M.Sc. degrees from University of Science, Vietnam, in 1984 and 1994, respectively. He received his Graduate Diploma in Information Sciences and Ph.D. degree in Information Sciences & Engineering from University of Canberra, Australia, in 1996 and 2001, respectively. Currently, he is an Associate Professor at Faculty of Education Science, Technology and Mathematics, University of Canberra, Australia. His research areas include biometric authentication, security, pattern recognition and machine learning.
Wanli Ma received Ph.D. degree in September 2001. He was working at the Computer Services Center, University of Canberra, as an IT support officer. He became a lecturer at the School of Information Sciences and Engineering in January, 2004. Currently, he is Associate Dean Education of Faculty of Science and Technology at University of Canberra. His research areas include security, pattern recognition and machine learning.
Dharmendra Sharma is currently the Chair of University Academic Board and Professor of Computer Science at the University of Canberra (UC). He had been the Dean of the Faculty of Information Sciences and Engineering from 2007–2012 and as Head of School of the School of Information Sciences and Engineering from 2004–2007 at UC. Prof Sharma’s research background is in the Artificial Intelligence areas of Planning, Data Analytics and Knowledge Discovery, Predictive Modelling, Constraint Processing, Fuzzy Reasoning, Brain-Computer Interaction, Hybrid Systems and their applications to health, education, security, digital forensics and sports.
Journal of Cyber Security, Vol. 6_3, 305–338.
doi: 10.13052/jcsm2245-1439.634
This is an Open Access publication. © 2017 the Author(s). All rights reserved.