Unsupervised Monitoring of Network and Service Behaviour Using Self Organizing Maps
Duc C. Le*, A. Nur Zincir-Heywood and Malcolm I. Heywood
Faculty of Computer Science, Dalhousie University, Halifax, NS, Canada
E-mail: lcd@dal.ca; zincir@cs.dal.ca; mheywood@cs.dal.ca
∗Corresponding Author
Received 13 August 2018; Accepted 14 August 2018;
Publication 29 October 2018
Abstract
Botnets represent one of the most destructive cybersecurity threats. Given the evolution of the structures and protocols botnets use, many machine learning approaches have been proposed for botnet analysis and detection. In the literature, intrusion and anomaly detection systems based on unsupervised learning techniques showed promising performances. This paper investigates the capability of the Self Organizing Map (SOM), an unsupervised learning technique as a data analytics system. In doing so, the aim is to understand how far such an approach could be pushed to analyze the network traffic, and to detect malicious behaviours in the wild. To this end, three different unsupervised SOM training scenarios for different data acquisition conditions are designed, implemented and evaluated. The approach is evaluated on publicly available network traffic (flows) and web server access (web requests) datasets. The results show that the approach has a high potential as a data analytics tool on unknown traffic/web service requests, and unseen attack behaviours. Malicious behaviours both on network and service datasets used could be identified with a high accuracy. Furthermore, the approach achieves comparable performances to that of popular supervised and unsupervised learning methods in the literature. Last but not the least, it provides unique visualization capabilities for enabling a simple yet effective network/service data analytics for security management.
Keywords
- network and service data analysis
- unsupervised learning
- malicious behaviour analysis
1 Introduction
The general utility of the Internet continues to grow on a yearly basis, and at the same time, so does the cybercrime threat landscape. There is a wide variety of network threats on the Internet, with different aims and attack vectors. Among these, botnets have become one of the most dangerous threats [34]. Botnets consist of compromised machines, or bots, controlled by attackers (the botmasters) through Command and Control (C&C) communication channels. Botnets are responsible for many types of attacks these days, including but not limited to spreading spam, Distributed Denial of Service (DDoS) attacks, distribution of malicious software, information harvesting, identity theft, or exploiting computational and network resources of the victims.
The threats are becoming more and more serious [29], as we are seeing the incoming wave of Internet of Things (IoT), which will connect a plethora of device categories – not only conventional computers or smartphones, but also smaller and lower cost devices, e.g. home appliances, security systems, portable medical devices, etc. Poorly protected IoT devices can be easily turned into a platform for attacking anything from individual websites to core parts of the Internet’s infrastructure, hence opens the door for an once unthinkable generation of botnets. Just recently, in October 2016, the record of terabit-per-second DDoS attack was first achieved by an army of some 145,000 tiny compromised cameras, digital video recorders in two botnets – Mirai and Bashlight [9]. The attack on Dyn’s DNS infrastructure disrupts a long list of high-profile online services, including Amazon Web Services, Twitter, Spotify, Paypal, and so on [45]. Even more, the source code of the Mirai botnet was made open-sourced [16], much similar to what happened to Zeus and SpyEye in the past, which sparked a series of attacks launched by the botnets in that category [6].
Given the threats posed by botnets, botnet detection has become a critical component in network security solutions. Machine learning-based approaches are used for their ability to learn underlying patterns of data and adaptation to the dynamic nature of modern botnets. Moreover, to identify novel botnets in particular, and malicious network activities in general, anomaly detection systems based on unsupervised machine learning methods are gaining more and more interest [1].
In this research, a data driven approach for network traffic and web service behaviour analysis based on an unsupervised neural network technique, namely Kohonen’s Self Organizing Map (SOM) [21], is investigated.
SOM has a unique combination of unsupervised learning and topological preserving visualization capabilities, which makes it a promising technique to support data analytics in a wide range of conditions including cyber-security environments.
In the wild, i.e. in real life, the amount of ground truth (labeling capability as malicious or normal) that is available on a network packet/flow or a service request/session such as web can vary. In practice, we might have some a prioriknowledge about specific packets/flows being malicious, or specific web requests/sessions as normal but not all. In this research, we study the proposed approach under different use cases (scenarios): to work as traffic behaviour classification system, or an anomaly detection system, or a clustering technique with visualization capabilities for supporting security experts in finding the malicious behaviours. To this end, the effect of different data acquisition mechanisms in identifying malicious behaviours is studied by using three training scenarios (use cases) under the unsupervised learning paradigm. Furthermore, the approach is evaluated on modern publicly available datasets, which contain not only botnet behaviours but also other attack behaviours, with and without payload.
The remainder of the paper is organized as follows. Section 2 summarizes the related work on malicious behaviour detection and applications of the SOM in this field. Section 3 introduces the proposed approach and discusses the methodology, whereas Section 4 presents the evaluation and results. Finally conclusions are drawn and the future work is discussed in Section 5.
2 Related Work
In this section, we summarized the related works in this field in terms of first summarizing the architectures of a botnet studied in the literature and then discussing the different approaches employed to analyze botnet behaviours from the perspective of traffic and application data.
2.1 Botnets
A botnet is a network of computers infected with malicious software and controlled as a group without the owners’ knowledge. A botnet C&C channel accommodates communications between bots and bot masters, which differentiate botnets from other malwares. The communication channels provide botnets the ability of updating its malicious code and protocols, allow bots to perform attacks simultaneously under the control of a botmaster. Earlier botnets use Internet Relay Chat (IRC) as the communication protocol for their C&C channels. Eventually, as this protocol and botnet structures became obsolete, botnets have abused a wide range of other protocols from HyperText Transfer Protocol (HTTP), Secure HTTP (HTTPS) to Peer to Peer (P2P), and even social networks [7, 36]. In general, botnets have two main architectures: centralized and decentralized. In the centralized architecture, all bots establish their communication channels with one or more central controlled servers typically over IRC and HTTP/HTTPS protocols. The obvious advantages of this topology are speedy command propagation and synchronization. However, decentralized C&C is increasingly employed in recent years to overcome the central point of failure problem. By utilizing P2P protocols to allow each node in a botnet act as a client or a master, decentralized C&C provides great flexibility and robustness. Moreover, a botnet topology can be a hybrid model of the two architectures to combine advantages of both architectures.
2.2 Rule Based and Supervised Learning Based Botnet Detection
Malicious behaviour detection approaches have evolved extensively and expeditiously to cope with the advancement in malware architectures and protocols, as well as the sophistication of new attack vectors. Network intrusion detection systems, from early researches to many products nowadays, are mainly based on searching for a known set of identities, or signatures within network traffic (packets) to identify malicious activities. Snort [4] and Bro [30], which are open source network-based deep packet inspection systems for intrusion detection, are two of the most popular examples of this category. The systems depend on predetermined rule sets and policy scripts for not only intrusion detection but also forensic investigations. As the tools are equipped with many rules/policies which aim to cover a wide variety of possible network conditions, the system administrators need to determine which signatures are necessary and enable them accordingly to match their network conditions. Otherwise, they need to run the tools with default configurations, which may cause a huge amount of false alarms [14].
Based on Snort, Gu et al. [11] used a botnet life-cycle model to develop BotHunter. The tool employs a concept named dialog correlation to combine alerts generated using a tailored version of Snort to detect botnets and other coordination-centric malwares based on the assumption that most of the malwares follow a specific infection life-cycle model from initial inbound scan to attack behaviours.
Wurzinger et al. proposed a botnet detection model based on the observable command and response patterns of the botnet communications [43]. The work attempts to build the malware traffic patterns by identifying hosts’ responses and inspecting the preceding traffic to locate the commands. The system then derives signatures for detecting such C&C behaviours, and deploy them as signatures in Bro for detecting future events. On their botnet datasets, which they generated in a controlled environment, the extracted detection signatures outperform BotHunter.
Although signature-based Intrusion Detection Systems (IDSs) are efficient in detecting known attacks, which have been analyzed by security experts to release appropriate rules/policies, the approach is highly vulnerable against “zero-day” attacks. Moreover, the systems are heavily depended on receiving frequent signature updates, much like anti-virus solutions, to maintain the detection ability on even small variations in attack vectors. Thus machine learning techniques naturally found their applications in the field for the ability to automatically learn from data and extract patterns that can be used for distinguishing attack behaviours.
Gu et al. also proposed BotMiner, an approach based on group behaviour analysis for botnet detection [10]. Based on the assumption that the bots communicate with C&C servers/peers and perform malicious activities in a similar or correlated way, Botminer employs clustering approaches and cross cluster correlation on communication traffic and malicious activities to find similar communication behaviours, as well as network activities. Botminer obtained promising results on datasets consisting of campus traffic and botnet traffic generated in sandbox environments, where botnet detection rates were from 75% to 100%.
Zhao et al. investigated a botnet detection system based on packet header information and time intervals [46]. Decision Tree based machine learning algorithms were utilized to generate detection models using network flow features of traffic packets. The work focused on P2P botnets on HTTP protocol, which employ fast-flux based DNS techniques for their resilience. A dataset consisting of normal traffic from several legitimate sources and botnet traffic from the Honeynet project, [38], was used to evaluate the proposed method. Their results show that the system achieved high detection rates on offline data, but also generated high false positive rates on unseen botnet traffic.
Nagaraja et al. proposed BotGrep – a monitoring framework that constructs graphs of traffic patterns for P2P botnets using traffic flows [27]. From the built graphs, the work localizes botnet members with unique communication patterns by finding structured overlay topologies. The authors applied the model on Internet service provider sized benign network traffic, with Honeynet botnet traffic injected to demonstrate the concept. Their results reached up to 99% detection rate with 1% false alarm rate.
Haddadi et al. employed two machine learning algorithms, namely C4.5 Decision tree, and Symbiotic Bid-based Genetic programming, for building detection models [12]. One of the objectives was to find the feature sets that best describe the botnets and to return a solution that is suitable for a signature-based botnet detection system. Their results were compared against Snort and Bothunter to confirm the advancement of proposed method over packet payload inspection based systems [14].
Yan et al. proposed PeerClean – a multi-phase detection system targeting P2P botnets [44]. The first phase clusters individual connections or hosts with similar flow traffic statistics into groups. Then PeerClean extracts collective connection patterns from each group using a proposed dynamic group behaviour analysis method. Finally, a SVM classifier is trained using group connection patterns to identify botnet groups. The system was evaluated on a mixed data which consisted of traffic captured from an edge router of a campus network and botnet data from their sandboxed environment.
2.3 Unsupervised Learning Based Botnet Detection
Unsupervised learning approaches have also found their applications in the field, especially in anomaly detection systems. Perdisci et al. used an ensemble of one-class SVM for payload-based anomaly detection systems [31]. They used a clustering algorithm originally proposed for text classification problems to reduce the dimensionality of the feature space obtained from n-gram analysis of payload. Then the anomaly detectors are applied to each description of the payload to produce aggregated results. They obtained 97% detection rate with 3% false alarm rate.
Kayacik et al. proposed an approach to network intrusion detection based on a hierarchy of SOMs [20]. Using 1999 KDD Cup dataset for training, two hierarchical SOM architectures were proposed. The first architecture uses only six basic features from the dataset and generates a three-layered SOM hierarchy, where the first layer SOMs are used to generalize data from each feature individually. Output of each first-layer SOM is clustered to six clusters for higher layer training. The second architecture uses all 41 features to directly train a two-layer SOM model, which is similar to the second and third layers in the first model. Their method achieved the best performance of a detector based on an unsupervised learning algorithm on the KDD dataset with a detection rate up to 90.4% and false alarm rate of 1.38%.
Ippolity et al. developed a threshold based training approach, namely Adaptive Growing Hierarchical SOM, for building an online network intrusion detection system [18]. In their work, system parameters are adjusted dynamically by using quantization error feedback to adapt to the new training data. A dynamic input normalization process is applied to accommodate live training conditions. Furthermore, the SOM units are monitored using the proposed confidence filtering and forwarding mechanism. The results on 1999 KDD Cup dataset and their own simulated traffic reached up to 97% detection and 2.6% false positive rates.
From another network security perspective, although malicious bots are responsible for approximately one third of web traffic [45], most of IDSs work on Transport & Network level are not adequate in protecting web applications against the threat. Web application firewalls (WAF) are becoming more and more popular to protect specific websites with their focused protection and content specific capabilities. Zolotukhin et al. proposed an anomaly detection model for WAFs, by modelling normal web user behaviours using several clustering and anomaly detection algorithms and applying the model to detect attacks as deviations from the norms [47]. Razzaq et al. proposed an ontology based technique for analyzing web requests and detect web attacks [33]. By capturing the context of a web application and its underlying protocols, the work aims to detect the attacks dynamically and effectively in specified portion of a web request. Nguyen et al. surveyed generic feature selection methods for HTTP traffic filterfing in WAFs [28]. Additionally, they generated HTTP-CSIC 2010 datasets for evaluation of WAFs.
Recently, Hofstede et al. presented an approach for web application bruteforce attack and compromise detection based on flow data that are exported using IPFIX [17]. For maximum compatibility, the approach uses histograms of packet payload sizes and Hierarchical Cluster Analysis to discriminate attack from non-attack traffic. The approach is evaluated using datasets collected in the production network of a large web host in the Netherlands and shows advancement over approaches that do not use flow data.
2.4 Summary
As seen in the discussion presented above, while both supervised and unsupervised machine learning has been studied in the field of network and service (application) security, there exists several issues in the literature that inhibit a widespread deployment of such systems:
- Many approaches are heavily dependent on deep packet inspection [10, 31, 43], which makes them become nearly impossible to be applied to encrypted network traffic.
- Many systems, [27, 44, 46], focus only on a specific botnet architecture/botnet connection protocol.
- Many previous works were built upon and tested against the 1999 KDD cup dataset (almost 20 years old!) and its variants [18, 20], which have many drawbacks [35], or datasets from closed environments [10, 11, 31, 43, 44]. This raises the question about how these systems would actually perform under current networks and services representing up to date malicious and normal behaviours.
- Several systems employ complex and computationally expensive analysis architectures [10, 18, 27, 44]. The models are also based on specific assumptions about correlation and synchronization in traffic patterns. These requirements introduce limitations for the models to be ubiquitous for network and service data analysis.
Furthermore, the fact that in practice either there is no labelled data or there is very few of them reduces the versatility of systems employing supervised learning techniques. On the other hand, approaches based on unsupervised learning in the aforementioned works provided comparable results to that of supervised learning approaches, while enabling an intrusion detection system to potentially generalize the learned data for recognizing novel threats. The novelty and the functionality of the proposed approach in this research lie in the following aspects:
- The research is positioned in unsupervised learning and visualization landscape, thus concurrently seeks a simple solution that is less dependent on expert knowledge and labelled data, and more flexible in deployment.
- The research explores a wide range of data acquisition conditions and is examined against diverse datasets of not only modern botnets but also web attack behaviours.
- The capability of the approach in supporting security experts in analyzing unknown/unlabelled data is also explored, by applying the model for recognizing unseen botnets, and investigating unlabelled majority portions of the datasets used.
3 Methodology
The principle interest of this research is to explore the capabilities of an unsupervised learning approach as a data analytics tool for network and system behaviour detection under different real-world data acquisition scenarios. To this end, SOM is employed to build an analysis system, not only supported by its unsupervised nature but also its abilities in visualizing the data. Different SOM training scenarios are used for evaluating real-world data acquisition strategies for behaviour detection and to overcome the lack of well-labelled data.
3.1 Datasets
Obtaining high quality data and processing them appropriately for designing and evaluating attack behaviour detection systems typically involves considerable difficulties. In this research, three publicly available datasets (log files) are used. First two sets, CTU13 and ISOT contain botnet (malicious) and normal (non-malicious) traffic data, while the remaining dataset, HTTP-CSIC contains web requests/traffic representing both malicious and normal intent. The datasets ensure a wide range of malicious as well as normal behaviours and categories, both with and without traffic payload. This enables the proposed SOM based approach to be evaluated under different network security scenarios and applications.
3.1.1 CTU13
The CTU13 botnet traffic datasets were captured in 2011 by Malware Capture Facility Project of Czech Technical University [8]. The goal was to have a large database of real botnet traffic mixed with normal traffic and background (unidentified) traffic. These datasets, which are referred as CTU13a-m, consist of thirteen traffic traces of different botnet samples. For each sample, a different malware was executed to establish connections on several protocols and performed different actions.
Due to privacy reasons, only the network flow files containing basic flow features extracted using Argus are made publicly available by the CTU. The features are: the duration, port numbers, the direction, source and destination types of services, the number of packets, the number of bytes, the number of source bytes, and the protocol. The list of features is supported by almost every traffic flow exporter. All of the provided features, except the direction, are employed in this research. By using only the provided basic flow characteristics, this research intends to test the performance of the proposed approach using minimum a priori information, and hence aims to minimize the blind sights and not to miss the new (unknown) malicious behaviours.
The labelling process of the CTU13 dataset, as discussed in García et al. [8], can be summarized in three steps. First, the Background label is assigned to the whole traffic. Then, the Normal label is assigned to the traffic that can certainly be identified as traffic from the known normal and controlled computers in the network. Finally, the Botnet label is assigned to all the traffic that comes from or to any of the known infected IP addresses. Hence, in CTU13 dataset, there is a large portion of data for further exploration, because ground-truth is not known for this portion. García et al. labelled this portion as Background. This portion (background) is also referred as the unknown portion of the data in this research.
3.1.2 ISOT
The ISOT botnet dataset, provided by University of Victoria [46], is the combination of several publicly available malicious and non-malicious datasets, including datasets from the Traffic Lab at Ericsson Research in Hungary [37] and Lawrence Berkeley National Laboratory [23] for legitimate and background traffic, and Storm and Waledac botnet traffic from the French chapter of honeynet project [38]. Waledac and Storm were two of the most prevalent P2P botnets with decentralized communication protocols. While Storm using the old-fashioned P2P Overnet as its communication channel, its successor Waledac utilizes HTTP and a fast-flux based DNS network for concealing malicious activities. The Ericsson Lab traffic contains general traffic from a variety of applications, including HTTP web browsing behaviour, World of Warcraft gaming, and popular bittorrent clients such as Azureus. Additional non-malicious background traffic is also incorporated in this dataset from the LBNL trace data, which contains network traces for a variety of activities spanning from web and email to backup applications as well as streaming media in an enterprise network environment. This work employs all 71 numerical features extracted from ISOT dataset using Tranalyzer with default configuration and basic plugins [24]. The basic plugins are: basicFlow, basicStats, tcpFlags, icmpDecode, connStat, descriptiveStats [3].
3.1.3 HTTP-CSIC
The HTTP dataset CSIC 2010 from the Information Security Institute of Spanish National Research Council (CSIC) [28] contains thousands of web requests for testing web attack protection systems. The attacks are targeted to an e-Commerce web application developed at CSIC. The dataset is generated automatically and contains 36,000 normal requests and more than 25,000 anomalous (attack) requests. This dataset includes attacks such as SQL injection, buffer overflow, information gathering, file disclosures, Carriage Return Line Feed (CRLF) injection, Cross Site Scripting (XSS) attack, server side include, parameter tampering and so on. There are three types of anomalous requests included in the dataset:
- Static resource requests, which try to request hidden (or non-existent) resources. These requests include obsolete files, session identifier in URL rewrite, configuration files, default files, etc.
- Dynamic resource requests (attacks), which modify valid request arguments: SQL injection, CRLF injection, XSS attack, buffer overflows, etc.
- Unintentional illegal requests. These requests do not have malicious intention, however they do not follow the normal behaviour of the web application and do not have the same structure as normal parameter values (for example, a telephone number composed of letters).
From the provided requests in the dataset, numerical representation vectors are extracted using a set of heuristically determined features for training and testing the proposed system. The list of features can be found in our previous work [24].
3.2 Learning Algorithm – Self Organizing Map
Self Organizing Map [21] is based on unsupervised, competitive learning to produce a non linear, ordered two-dimensional similarity map, which is a projection of multi-dimensional input space. The SOM map, or output space, consists of nodes or neurons which can act as decoders or detectors of their respective input space domains after the training process. Hence, the SOM provides visualization and summarization options for high dimensional data with topological relationships preserved.
Define the training set χ as a list of all input vectors x = . The original SOM iterative learning procedure can be summarized as follows:
- Initialize a M1×M2 two-dimensional, typically a hexagonal or rectangular, lattice 𝒲 of neurons, each has a weight vector and a position ri in the 2D plane. The weight vectors can be assigned randomly or linearly based on input range.
- A random input vector x is presented to train the lattice. A distance measure is calculated between x and all the SOM nodes. One popular choice for the distance measure is the Euclidean distance, d(x,wi) = ∥x-wi∥ where . Then the winning node wc, or the best matching unit (BMU), is identified by minimum distance to the input vector. c = argmini d(x,wi).
Weight vectors of the winning neuron and its neighbours are adjusted according to the input vector:
where hcci is the neighbourhood function and t is the discrete time coordinate. Acting as a smoothing kernel defined over the lattice points, the neighbourhood function plays a vital role in the SOM convergence process. It defines the magnitude of influence each input training vector has over the SOM nodes, and implicitly the update region around the BMU. The neighbourhood function can simply include the neighbourhood set of neurons around node c. However, more frequently the neighbourhood function has a Gaussian form:
where αt is the learning rate factor and σ(t) is the kernel width, also called the neighbourhood radius. Both α(t) and σ(t) are scalar-valued and monotonically deceasing over time.
- Repeat steps (2–3) by a predetermined number of iterations or until the convergence criterion is satisfied, i.e. the corrections to the SOM weight vectors become zero.
3.2.1 Batch SOM Training and Visualization
In practice, the SOM batch training algorithm is generally preferred for faster convergence rate, less computational cost, and less number of learning parameters. The SOM training process usually consists of two phases: coarse training, during which the high-level topographic order of the SOM is quickly formed, and fine training, for obtaining a more accurate final state. Different from the original SOM learning algorithm, steps (ii-iii) are performed for all data points of the training set at once:
(ii’-iii’) For each SOM node i, collect a list of all training data points x whose BMU is wi. The weight vectors of SOM nodes are then updated as follows:
where N is the training set size.
(iv’) Repeat step (ii’-iii’) in two phase: coarse training phase with large neighbourhood radius σcoarse(t) and small number of iterations lcoarse, followed by fine training phase with small and constant neighbourhood radius σfine(t). The fine training phase can have higher number of iterations lfine, or is continued until convergence.
The batch SOM algorithm is employed for this work. The parameters and the initialization method are presented in Section 4.
Furthermore, in this research, hit map (Figure 1(b)), a combination of the U-matrix [39] (the distance matrix between SOM nodes) and the SOM hit distribution, is extensively employed for visualizing the SOMs. On a hit map, the background colour represents an interpolated shading version of U-matrix, while the size and colour of each node represent volume and class label of best matching data for each SOM node, respectively.
3.2.2 Verification of SOM’s Learning Ability
To verify the performance of the SOM post training, tSNE [40], an independent non-parametric mapping method for data visualization, is employed. Figures 2 and 3 present the tSNE mappings of the original datasets (see 3.1), as well as the mappings of the codebooks, which is the set of all weight vectors of the SOMs trained on the respective datasets. Specifically, Figures 2(a) and 3(a), show the tSNE mappings of ISOT and CTU13a respectively, while Figures 2(b) and 3(b), show the tSNE mappings of codebooks of the trained SOMs using the corresponding data. In these figures the size of each node denotes the number of data points that hit the node, and the mixed colour in a node denotes that the node is the BMU for data from more than one class. It is noteworthy to mention that SOM and especially tSNE are capable of representing non linear properties. So, one shall only expect to see the structure similarity (but not the linear similarity) between the mappings of the same dataset, e.g. between Figures 3(a) and 3(b). The similarity between the mappings clearly demonstrate the abilityof the SOM in summarizing and generalizing the input data. On visually comparing subplot (a) to the corresponding subplot (b), it is apparent that the SOM codebooks preserve the general structure of the data, while also reducing the noise and combining similar data regions into SOM nodes. Specifically, the distribution with which each class is represented is retained, as is the degree of mixing/purity with which different classes are expressed.
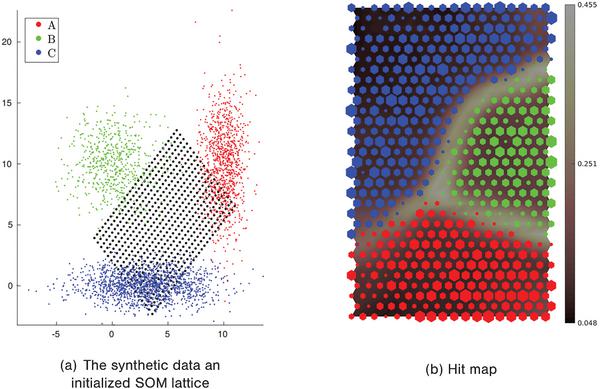
Figure 1 Visualization of data distribution on the trained SOM.
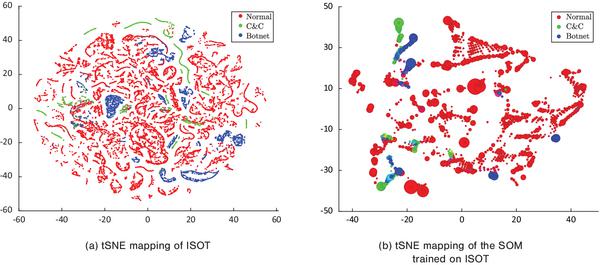
Figure 2 tSNE mappings of ISOT dataset and the SOM trained on ISOT.
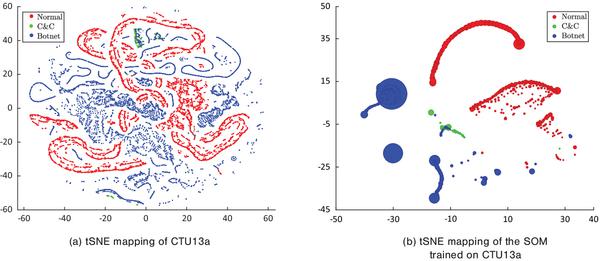
Figure 3 tSNE mappings of CTU13a dataset and the SOM trained on CTU13a.
3.3 Network Traffic Flows
A network traffic flow is defined as the logical equivalent of a call or connection, which connects a pair of terminals and contains a group of features [2]. From the viewpoint of the network layer, a traffic flow is a sequence of packets sent from a particular source to a particular unicast, anycast, or multicast destination. From an upper-layer viewpoint, a flow could consist of all packets in one direction of a specific transport connection or media stream. However, a flow is not necessarily 1:1 mapped to a transport connection. Traditionally, flow classifiers have been based on the 5-tuple of the source address, destination address, source port, destination port, and the transport protocol type. Flow features typically include descriptive statistics that are calculated from aggregating Network and Transport layers header information of the packets in a flow.
The use of packet header properties (especially Network and Transport layers) as descriptive characteristics of a flow makes the approaches based on flow Application layer independent. Moreover, given that network traffic encryption is very popular in both benign applications, for protecting users’ privacy and sensitive information, and malicious ones, for hiding from the detection systems that analyze network packet payload, the detection approach using only flow exported from packet headers may improve the state-of-the-art in unsupervised learning based network and system analysis. Although botnet master can effectively change a part of malicious packet payload, or encrypt the connection to evade signature based detection systems, it would be much harder to change the abstract depiction of network connections formed by the flows. The reason is that ultimately the malicious connections are still established automatically by predefined code, and hence would be different from diverse normal user and computer behaviours.
Flows can be extracted from network traffic using proprietary flow exporters in routers and switches, e.g. Cisco Netflow [5] and Juniper JFlow [19]. On the other hand, open source flow exporters can also extract flows from network traffic captured at network devices as well as network terminals with a wide variety of features and great flexibility. Good performances achieved by such flow exporters, e.g. Argus [32] and Tranalyzer [3], were demonstrated in Haddadi et al. [13]. Hence in this research, Tranalyzer is employed for exporting the flows from raw network traffic.
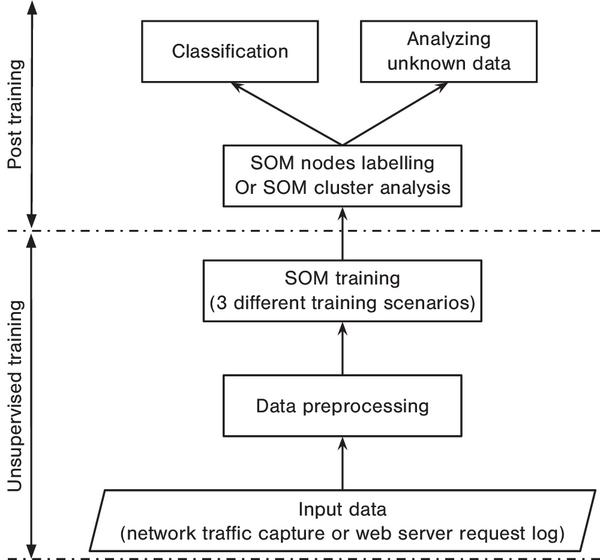
Figure 4 Proposed system architecture.
3.4 System Architecture
The proposed system architecture is shown in Figure 4. Fundamentally the system is based on a data-driven approach using unsupervised learning with visualization abilities (SOM) to learn network and system behaviours with minimum a priori knowledge.
Raw input data is processed to numerical vectors, which are network flows from traffic captures or request characteristics for web log files. The data is then pre-processed, e.g. for normalization purposes or for dimensionality reduction purposes, before being input to the SOM learning algorithm. The original data distributions are always kept intact. Hence the SOM is obtained post training in a completely unsupervised manner. Since no label information or human-defined knowledge of data is used for the proposed SOM training process, only one layer of SOM with sufficient resolution is employed. This is supported by the presumption that learning from data, SOM may form well-separated node regions to differentiate distinct communication behaviours.
To quantify the system performance, if the ground-truth of the training data is available, it can be applied for labelling the SOM nodes post training. The labelled SOM can then be used to classify unseen testing sets. On the other hand, when label information is not available, cluster analysis based on the trained SOM topology visualization, e.g U-matrix, can be used along with domain expert knowledge and information from other sources to derive meaningful insights from the data. Moreover, possessing powerful visualization capabilities, the trained SOM can be employed to investigate the unknown data, using knowledge learned in the training and labelling phases.
3.4.1 Training Scenarios
In this research the SOMs are trained using three different scenarios based on the chosen training data [25]:
- use both known normal/legitimate and known malicious traffic for training purposes, as done in the previous supervised learning approaches [18, 20];
- use only normal/legitimate traffic for training purposes as done in the previous unsupervised learning (anomaly detection) approaches [1, 47];
- use only malicious (botnet/C&C) traffic or anomalous requests for training purposes as done in some of the previous one-class classifier approaches [31, 41].
The reason behind these training scenarios is to not only represent the real-life security conditions, but also to shed light into understanding the performance gains/losses under different types/amounts of labelling information, i.e. ground-truth. For example, the data collected by honeypots is usually only considered as being representative of malicious behaviour. On the other hand, in idealistic cases of networks where there are no attacks, the data collected contains only legitimate traffic. Moreover, even when a threat is discovered in the collected traffic, it is very challenging to fully identify the extent of the threat and label the data collected.
Table 1 SOM traning parameters
| Parameter | Value |
| SOM map | 2D hexagonal lattice |
| Initialization method | Linear initialization |
| Number of nodes (M1 ⋅ M2) | 10 |
| Neighbourhood function | Gaussian |
| lcoarse | 100 |
| lfine | ≥400, depends on convergence criteria |
| σcoarse | 0.25 ⋅ max(M1,M2) to max(1,0.05 ⋅ min(M1,M2)) |
| σfine | max(1,0.05 ⋅ min(M1,M2)) |
4 Evaluation
The proposed system in this research is built based on SOM Toolbox 2.1 [22]. The SOM training parameters are summarized in Table 1. The initialization of the SOM can be done by assigning a random weight vector, or a random input data point to each node. However, as stated in Kohonen [22], SOM learning is generally faster (in terms of convergence) if regular initial values are given to the maps. Thus, the SOMs in this research are initialized linearly.
4.1 Labelling the SOM Nodes
As described in Section 3.4, three different training scenarios based on three distinct training data compositions are employed. For each scenario, when the ground-truth of the input data is available, the SOMs can be labelled post training as the following:
- Training scenario (i), using both Normal and Malicious data: post training, for each SOM node i, the set of labelled training examples whose BMU is wi is collected. From this set, votes toward different classes are calculated with training data distribution taken into account to offset the skewness in the data. For example: If node i is the BMU of 50 examples, out of which 18 are labelled “A” and 32 are labelled “B”, and given that the input data has a distribution of 60% “A” and 40% “B”, then the votes are calculated as viA = 18/0.6 = 30, and viB = 32/0.4 = 80. This leads to the node being labelled as “B”. It is also noteworthy that the trained SOM usually consists of well-separated regions of different classes (Figure 1(b)). Thus, the votes are routinely dominated by only one class. For the remaining SOM nodes on the trained map that do not have best matching data examples, the labelling process is done based on the nearest neighbours basis. Specifically, the nodes are assigned the labels of the majority of their neighbouring nodes.
- Training scenarios (ii) and (iii), using only Normal or Malicious data, respectively: Since the training data of these two training scenarios contains only one class, the SOMs are labelled after training by adopting an outlier detection principal. Specifically, a threshold τ is determined for each trained SOM to specify the set of important map units, which represent the core behaviours of the training class. Basically the set of important map units is defined as the minimal set of SOM nodes with the greatest hits that are BMUs for at least τ ⋅ N training data points. Although the value of τ varies from one data to another, the principle assumed here is that τ needs to be greater or equal to 0.9 to retain a sufficient number of nodes representing the behaviours of the training class. The selected τ values will be justified by the Receiver Operating Characteristic (ROC) curves. Naturally, any number of mechanisms could be assumed for outlier detection [26], the thresholding approach adopted here represents a convenient starting point. Future work could conduct a wider study of the relative significance of assuming different approaches.
4.2 Datasets
From the original network traffic captures (CTU-13 and ISOT traffic files) and the web access logs (HTTP-CSIC request files), the datasets are exported as numerical vectors representing network flows or HTTP requests (see 3.1). Tables 2 and 3 present the flow and the request distributions in CTU13, ISOT, and HTTP-CSIC datasets, respectively. The botnet C&C and botnet attack traffic in CTU13 sets are distinguished as C&C and Botnet in the table. Due to the highly skewed distributions, the C&C flows and Botnet flows in CTU13 c-g and j-l datasets are considered one class (Botnet and C&C) in the experiments. Given that the SOM is built based on the distances between data vectors and nodes, the features of the training data are normalized with zero means and unit variance before they are used for training.
4.3 Performance Measurements
Except where noted, all results are analyzed with respect to 20 independent trials in three fold cross validation in order to ensure statistical significance. For the classification tasks, the results are measured in terms of: Accuracy, Class-wise Detection Rate (CDR), Class Detection Rate (DR), and Precision of malicious classes. While Accuracy and Detection rates show the system’s capability in correctly classifying test (unseen during training) instances into classes, the Precision denotes the percentage of raised alerts that is accurate.
Table 2 Data distribution in CTU13 sets
| Scen. | Bot | # Packets | # Flows | Normal Flows | C&C Flows | Botnet Flows | Background Flows |
| a | Neris | 71,971,482 | 2,824,637 | 30,387 (1.08%) | 341 (0.01%) | 40,620 (1.44%) | 2,753,288 (97.47%) |
| b | Neris | 71,851,300 | 1,808,123 | 9,120 (0.50%) | 673 (0.04%) | 20,268 (1.12%) | 1,778,061 (98.34%) |
| c | Rbot | 167,730,395 | 4,710,639 | 116,887 (2.48%) | 63 (0.00%) | 26,759 (0.57%) | 4,566,929 (96.95%) |
| d | Rbot | 62,089,135 | 1,121,077 | 25,268 (2.25%) | 49 (0.00%) | 1,719 (0.15%) | 1,093,228 (97.52%) |
| e | Virut | 4,481,167 | 129,833 | 4,679 (3.60%) | 206 (0.16%) | 695 (0.54%) | 124,252 (95.70%) |
| f | Menti | 38,764,357 | 558,920 | 7,494 (1.34%) | 199 (0.04%) | 4,431 (0.79%) | 546,795 (97.83%) |
| g | Sogou | 7,467,139 | 114,078 | 1,677 (1.47%) | 26 (0.02%) | 37 (0.03%) | 112,337 (98.47%) |
| h | Murlo | 155,207,799 | 2,954,231 | 72,822 (2.47%) | 1,074 (0.04%) | 5,053 (0.17%) | 2,875,281 (97.33%) |
| i | Neris | 115,415,321 | 2,087,509 | 29,967 (1.44%) | 2,973 (0.14%) | 182,014 (8.72%) | 1,872,554 (89.70%) |
| j | Rbot | 90,389,782 | 1,309,792 | 15,847 (1.21%) | 37 (0.00%) | 106,315 (8.12%) | 1,187,592 (90.67%) |
| k | Rbot | 6,337,202 | 107,252 | 2,718 (2.53%) | 3 (0.00%) | 8,161 (7.61%) | 96,369 (89.85%) |
| l | NSIS.ay | 13,212,268 | 325,472 | 7,628 (2.34%) | 25 (0.01%) | 2,143 (0.66%) | 315,675 (96.99%) |
| m | Virut | 50,888,256 | 1,925,150 | 31,939 (1.66%) | 536 (0.03%) | 39,467 (2.05%) | 1,853,207 (96.26%) |
Table 3 Data distribution in ISOT and HTTP-CSIC datasets
| ISOT | # Packets | # Flows | # Normal Flows | # Storm Flows | # Waledac Flows |
| 25,284,617 | 264,882 | 212,203(80.11%) | 18,721(7.07%) | 33,958(12.84%) | |
| HTTP-CSIC | # Requests | # Normal Req. | # Malicious Req. | ||
| 71,485 | 56000(78.34%) | 15,485(21.66%) | |||
In security applications, high precision classification systems will reduce the amount of false alerts that require attention from the network administrators. The measurements and the data distributions will be presented in % in the following sections.
4.4 SOM Classification Results
4.4.1 Training scenario (i) - Normal and malicious
Table 4 presents in detail the classification performance of the SOMs trained using scenario (i), using both normal and malicious data for training the SOMs. The results are obtained on the unseen test partitions of the datasets. Based on the same trained SOM, results on both 2-class and multi-class schemes are available. As it shows in Table 4 and Figures 5 and 6, this training scenario achieves high performance with clear separation between non-overlapping groups of BMUs of traffic classes on the hit maps. For example, in Figure 5, which visualize data distribution of different traffic classes in CTU13a and CTU13m on the SOMs, it is clear that the different classes are either separated by a lighter area in the SOM Umatrix, which indicates large inter-node distances, or empty nodes. Figures 6(a) and (b) shows hit maps of the SOMs trained on ISOT and HTTP-CSIC datasets, respectively. Although the separation between legitimate and malicious classes are not as obvious as that of the CTU13 sets, one can still easily distinguish different traffic classes by looking at the hit maps.
Table 4 Classification performance of SOM training scenario (i)
| Multi-class DRs | 2-class DRs | |||||||
| Dataset | Accuracy | CDR | Normal | C&C/Storm | Botnet/Waledac | Normal | Malicious | Precision |
| CTU13 | ||||||||
| a | 98.15 | 97.51 | 99.25 | 95.92 | 97.35 | 99.25 | 99.93 | 99.45 |
| b | 96.57 | 95.67 | 99.36 | 92.18 | 95.46 | 99.36 | 99.80 | 99.72 |
| c | 99.66 | 99.77 | 99.59 | 99.95 | 98.25 | |||
| d | 99.54 | 99.66 | 99.51 | 99.82 | 95.38 | |||
| e | 98.86 | 99.25 | 98.68 | 99.82 | 93.58 | |||
| f | 99.22 | 99.35 | 98.79 | 99.92 | 98.08 | |||
| g | 97.20 | 97.78 | 97.16 | 98.41 | 56.75 | |||
| h | 99.55 | 99.46 | 99.56 | 99.34 | 99.49 | 99.56 | 99.92 | 95.43 |
| i | 96.43 | 97.32 | 99.15 | 96.84 | 95.96 | 99.15 | 99.83 | 99.87 |
| j | 99.81 | 99.46 | 98.98 | 99.94 | 99.85 | |||
| k | 99.73 | 99.56 | 99.23 | 99.90 | 99.74 | |||
| l | 99.19 | 99.38 | 98.90 | 99.85 | 97.49 | |||
| m | 96.73 | 93.30 | 99.40 | 85.72 | 94.79 | 99.40 | 99.92 | 99.52 |
| ISOT | 95.31 | 93.69 | 95.91 | 91.38 | 93.77 | 95.91 | 98.80 | 85.71 |
| HTTP-CSIC | 92.81 | 93.67 | 92.42 | 94.91 | 69.77 | |||

Figure 5 Hit maps of two CTU13 sets on the SOMs trained using scenario (i).
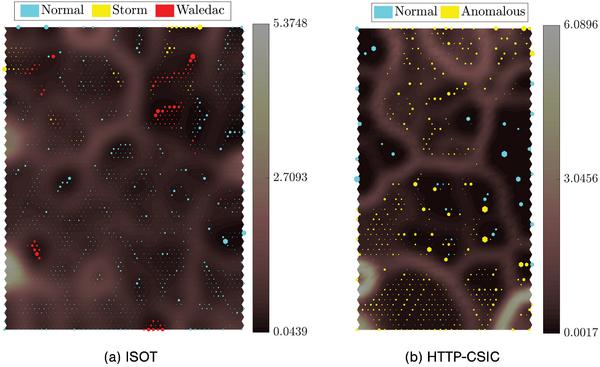
Figure 6 Hit maps of ISOT and HTTP-CSIC datasets on the SOMs trained using scenario (i).
Moreover, in the CTU13 sets with separate classes for C&C and Botnet attack traffic, most of the incorrectly classified Botnet (C&C) flows are still classified as C&C (Botnet). The same observation can be made between Waledac and Storm botnet traffic in ISOT dataset as well. 2-class DRs in Table 4 present the classification performances of the trained SOMs using scenario (i) when only two classes (Normal and Malicious) are taken into account. This also shows the flexibility of the SOM in particular and unsupervised learning in general in interpreting the learned model on the data. By not using the ground-truth in the learning process, the system instead learns to generalize the input data, and provides the ability to obtain results based on specific interests.
Finally, it should be noted that the SOMs trained using both normal and malicious data achieved comparable results to that of supervised learning systems in the papers where the ISOT and HTTP-CSIC datasets are introduced. On ISOT dataset, the detection rates of REPTree classifier with reduced subset in Zhao et al. [46] were 97.9% and 98.1% for Normal and Malicious flows, respectively. On the HTTP-CSIC dataset, the average accuracy and Normal DR obtained using decision tree learning algorithms in Nguyen et al. [28] were 93.65% and 93.1%, respectively.
4.4.2 Training scenario (ii) - Normal only and (iii) - Malicious only
The testing results of the SOMs trained using only normal data and only malicious data are presented in Tables 5 and 6, respectively. Figure 7 shows the ROCs of classification systems based on the two scenarios.
Among the two training scenarios, the results are generally better with the scenario using Normal data only. Ensuring the False positive rates no greater than 8%, the scenario (ii) is typically able to detect more than 60% of malicious data vectors. On the other hand, the training scenario using only Botnet traffic observes poor performance on most of CTU13 datasets and HTTP-CSIC.
Table 5 Classification performance of SOM training scenario (ii) Normal only
| Dataset | τ | Accuracy | CDR | Normal DR | Malicious DR | Precision |
| CTU13a | 0.90 | 38.64 | 45.12 | 88.25 | 2.00 | 18.15 |
| CTU13b | 0.95 | 58.42 | 68.05 | 92.56 | 43.55 | 92.26 |
| CTU13c | 0.95 | 94.82 | 96.59 | 93.76 | 99.42 | 78.54 |
| CTU13d | 0.93 | 91.55 | 87.43 | 92.49 | 82.37 | 51.63 |
| CTU13e | 0.95 | 87.84 | 79.09 | 92.02 | 66.15 | 59.70 |
| CTU13f | 0.94 | 94.09 | 94.72 | 92.06 | 97.39 | 88.36 |
| CTU13g | 0.94 | 88.52 | 79.55 | 89.22 | 69.88 | 19.79 |
| CTU13h | 0.93 | 86.61 | 63.17 | 91.34 | 35.01 | 26.35 |
| CTU13i | 0.93 | 38.05 | 59.76 | 89.56 | 29.96 | 90.69 |
| CTU13j | 0.95 | 63.32 | 75.50 | 91.95 | 59.05 | 97.82 |
| CTU13k | 0.95 | 93.88 | 93.33 | 92.23 | 94.42 | 97.33 |
| CTU13l | 0.95 | 85.64 | 81.62 | 91.61 | 71.63 | 78.40 |
| CTU13m | 0.95 | 68.73 | 71.28 | 93.35 | 49.21 | 88.79 |
| ISOT | 0.93 | 75.76 | 52.96 | 90.82 | 15.10 | 29.04 |
| HTTP-CSIC | 0.94 | 90.01 | 81.21 | 93.99 | 68.42 | 68.02 |
Table 6 Classification performance of SOM training scenario (iii) Malicious only
| Dataset | τ | Accuracy | CDR | Normal DR | Malicious DR | Precision |
| CTU13a | 0.94 | 83.02 | 81.34 | 70.17 | 92.52 | 83.90 |
| CTU13b | 0.90 | 61.90 | 44.71 | 1.01 | 88.41 | 67.22 |
| CTU13c | 0.95 | 92.31 | 92.06 | 92.46 | 91.65 | 82.85 |
| CTU13d | 0.93 | 57.38 | 71.88 | 54.09 | 89.67 | 21.83 |
| CTU13e | 0.90 | 26.01 | 48.45 | 15.30 | 81.60 | 16.74 |
| CTU13f | 0.94 | 66.69 | 71.25 | 51.94 | 90.56 | 55.70 |
| CTU13g | 0.93 | 50.11 | 63.00 | 49.10 | 76.90 | 14.53 |
| CTU13h | 0.95 | 51.72 | 70.10 | 48.02 | 92.19 | 16.26 |
| CTU13i | 0.95 | 93.44 | 92.23 | 90.57 | 93.90 | 98.48 |
| CTU13j | 0.92 | 82.50 | 58.68 | 26.52 | 90.84 | 89.26 |
| CTU13k | 0.94 | 86.49 | 81.72 | 72.18 | 91.25 | 91.20 |
| CTU13l | 0.95 | 56.70 | 66.62 | 41.96 | 91.27 | 40.56 |
| CTU13m | 0.90 | 50.97 | 46.04 | 3.30 | 88.78 | 53.65 |
| ISOT | 0.95 | 65.39 | 75.16 | 58.93 | 91.39 | 39.54 |
| HTTP-CSIC | 0.94 | 45.49 | 64.71 | 36.80 | 92.62 | 21.62 |
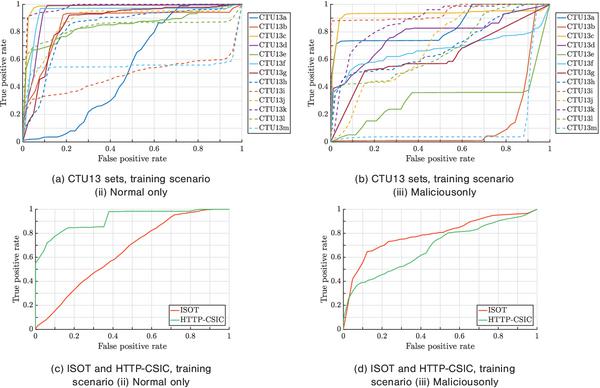
Figure 7 ROCs of classification systems based on SOMs trained using scenarios (ii) and (iii) on the datasets.
On ISOT dataset, the trend is reversed, where SOM training by only botnet flows gives far better results than the SOM trained by normal data only. However, considering that ISOT dataset is a combination of normal and malicious data provided by different organizations, this might be the reason why the trend is reversed. The normal traffic in ISOT dataset was provided by LBNL and the malcious traffic was captured using Honeypots [46]. That means the results are based on data captured at different organizations (networks) under (potentially) different topologies and conditions.
Another observation that can be made based on the scenario (ii) results on CTU13 sets is that the performance suffers when the amount of training data is not sufficient, e.g. on CTU13 a, b, m. This suggests that expanding the normal training set to cover more normal behaviours and protocols can improve the results obtained using scenario (ii).
The summary of the performances of the three SOM training scenarios are presented in Figure 8. As expected, SOM training scenario using both normal and malicious examples achieves the highest performance. Hence, for higher accuracies, data analytics systems trained on both malicious and normal behaviours should be preferred. The results also suggest that when a complete set of training data is not available, SOMs can be trained on well- identified normal data only and still achieve a reasonable performance, given that the data is diverse enough to cover most of the legitimate traffic.
Another observation from the experiments is that C&C and botnet attack traffic (in the CTU13 datasets) are relatively different. The examples of this can be seen in Figures 5(a) and (b), where the two malicious classes distributed over separated regions in the hit maps. This might be based on the essence of these two traffic types. While flows labelled Botnet represent attacks and malicious activities, C&C flows are for maintaining the botnet and issuing attack orders. Thus, naturally the hackers would want to conceal the C&C traffic to make it as similar to the normal traffic as possible. The observation suggests that independent investigation strategies for Botnet and C&C traffic may improve detection systems’ performance.
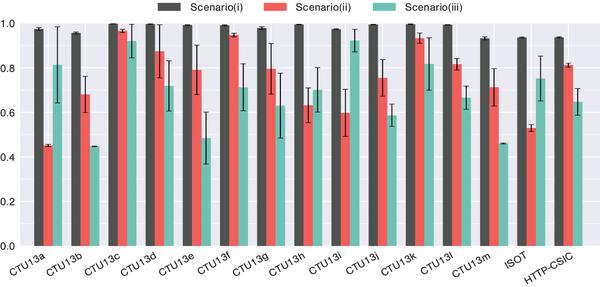
Figure 8 Summarization of classification performance (CDR) of the three SOM training scenarios. The columns represent average values, while the errorbars correspond to one standard deviation.
4.5 SOM vs Other Learning Algorithms
In this subsection, the performance of the model proposed in this research is benchmarked against other learning techniques, both unsupervised and supervised, from the literature. Four selected algorithms are: C4.5, Naive Bayes, X-means clustering, and EM, in which the former two are supervised, while the latter two are unsupervised. The chosen algorithms are amongst the most popular ones in data mining [42]. To comply to the training data requirements of these algorithms, only training sets consisting of both normal and malicious data (as in scenario (i)) are employed. To implement these benchmarking algorithms, we used WEKA with default parameters [15].
The classification performances of the five algorithms on CTU13, ISOT, and HTTP-CSIC datasets are summarized in Figure 9. It is clear that the SOM outperformed EM and even Naive Bayes, which is a supervised learning algorithm. In comparison with X-means, the SOM is comparable on most of CTU13 datasets, and outperformed on CTU13b, i, m, ISOT, and HTTP-CSIC. The results of SOMs are also comparable to C4.5, and even better in CDR for CTU13a, CTU13i and HTTP-CSIC. Friedman Aligned-Ranks test results provide statistical support for the analysis.
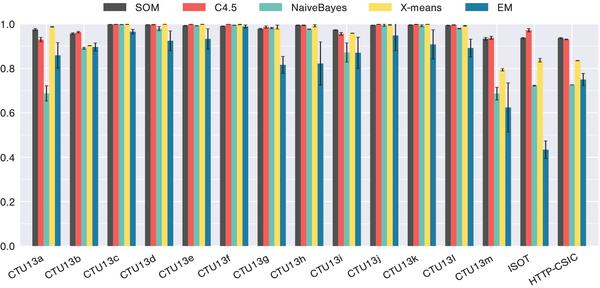
Figure 9 Summarization of classification performance (CDR) of five algorithms. The columns represent average values, while the errorbars correspond to one standard deviation.
The advantages of the proposed system are not only in the classification performance, but also in the ability to visualize the data. For example, when ground-truth is available, one can analyze SOM hit maps (Figure 5) to identify the regions, and hence the portion of the data, that may require further analysis. On the other hand, when the ground-truth is not available, proposed approach is still able to provide the expression on the structure of input data. Finally, in the case where training data is incomplete, it is possible to train the SOM in one class fashion to work as an outlier detector as in 4.4.2, while it is more challenging to do the same with the aforementioned algorithms.
4.5.1 Adaptability of the algorithms on novel malicious behaviours
To examine the ability of the algorithms on detecting novel (new/unseen during training) malicious behaviours, one experiment with special training and testing sets is carried out. The training/testing split is done in the same manner as in Garda et al. [8], where 5 sets (a, b, f, h, i) in CTU13 are used for training, while the rest (CTU13c-e, g, j-m) are used for testing. The split ensures that the testing set contains only novel botnets (Rbot, Virut, Sogou, NSIS.ay) that are not included in the training set (Neris, Menti, Murlo). Furthermore, while the botnets in the training set are only IRC botnets, or use a proprietary protocol for their C&C communication, the botnets in testing set establish their connections on not only IRC but also HTTP/HTTPS and P2P protocols [8]. The SOM and other algorithms are trained using both normal and botnet traffic flows in the training set (as in scenario (i)). Due to the training data size, only 25% or the original training data is randomly sampled to train the algorithms.
The results are presented in Figure 10. It is apparent that the SOM was able to retain its good performance on the novel botnets, while the algorithms for comparison failed. This demonstrates the potential of the proposed approach in dealing with unseen behaviours, even when new communication protocols are employed for botnet C&C, by reducing the dependence on a priori ground-truth in the learning process.
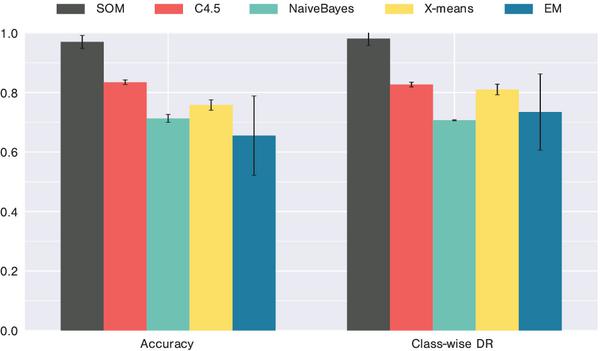
Figure 10 Accuracy of 5 algorithms on CTU13 novel botnets testing set.
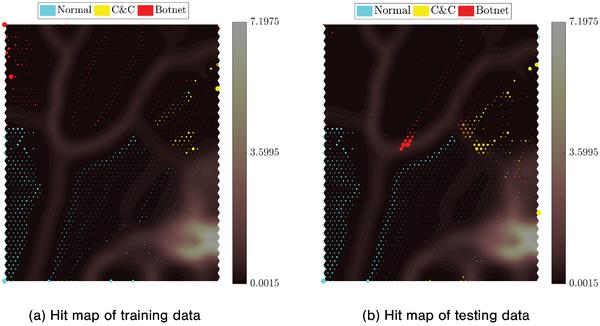
Figure 11 Hit maps of training and testing data, novel botnet detection experiment.
To further analyze the SOMs in this experiment, the hit maps for training and testing data are plotted in Figure 11. As it is shown in the figure, although the C&C and botnet attack behaviours in the testing set are somewhat different from the botnets in the training set, and appears to be more similar (closer in the hit maps) to the normal traffic, the SOM was still able to successfully identify them. These results also suggest that the shifting in network behaviours should be gradually incorporated (by re-training) into the system to maintain a good detection capability. This can be done by periodically training the SOM at regular intervals, or re-training when new network behaviours are noticed.
4.6 SOM for Analyzing Unknown Data
In this subsection, the trained SOMs presented in Section 4.4 are used to analyze the distribution of Background (unlabelled/unknown) data in the CTU13 sets. Since there is neither ground-truth nor packet capture payload provided by the CTU for this portion of the datasets, the SOMs trained using scenario (i) are employed as the baseline to analyze the unknown data portion of the CTU13 dataset, backed by the promising results obtained in the previous sections. As shown in Figure 12 and Table 7, the proposed system identifies most of the Background flows as Normal/Legitimate (53%–67%, depending on the CTU13 dataset analyzed), and only a small portion (0–6%) as possibly Botnet traffic. On the other hand, the rest of the Background traffic flows appear to be very different from both Legitimate and Botnet/C&C.
The proposed system suggests that these flows are labelled as anomalies for further investigation. Manually inspecting the background flows labelled as Anomaly shows that many of them have unfamiliar protocols that were not seen in the training data, for example Address Resolution Protocol, RTP, RTP Control Protocol, and Internet Group Management Protocol. This intuition suggests that the training sets need to be expanded to cover more behaviours and protocols.

Figure 12 Hit maps of CTU13i Background (left) and training data (right) on the SOM trained using scenario (i).
Table 7 Distribution of CTU13 Background traffic flows on the trained SOMs
| CTU13 | Training Scenario (i) | Training Scenario (ii) | Training Scenario (iii) | ||||
| Normal | Anomaly | Botnet | Normal | Anomaly | Not Botnet | Botnet | |
| a | 53.00 | 44.67 | 2.32 | 51.13 | 48.87 | 74.18 | 25.82 |
| b | 58.74 | 40.33 | 0.93 | 60.11 | 39.89 | 26.17 | 73.83 |
| c | 57.67 | 38.19 | 4.14 | 54.39 | 45.61 | 87.85 | 12.15 |
| d | 67.75 | 29.64 | 2.60 | 69.91 | 30.09 | 66.14 | 33.86 |
| e | 65.25 | 30.14 | 4.61 | 74.33 | 25.67 | 15.52 | 84.48 |
| f | 65.81 | 33.91 | 0.28 | 67.24 | 32.76 | 68.88 | 31.12 |
| g | 63.76 | 29.80 | 6.45 | 55.61 | 44.39 | 37.44 | 62.56 |
| h | 65.30 | 31.59 | 3.11 | 62.67 | 37.33 | 52.83 | 47.17 |
| i | 65.71 | 32.70 | 1.59 | 56.80 | 43.20 | 87.88 | 12.12 |
| j | 60.94 | 32.90 | 6.17 | 61.29 | 38.71 | 36.55 | 63.45 |
| k | 52.63 | 40.94 | 6.43 | 33.55 | 66.45 | 56.32 | 43.68 |
| l | 56.17 | 24.86 | 18.97 | 56.37 | 43.63 | 43.69 | 56.31 |
| m | 54.02 | 41.39 | 4.59 | 49.76 | 50.24 | 33.34 | 66.66 |
SOMs trained by only Normal data (scenario (ii)) show very similar Background data distributions to scenario (i). The two scenarios agree not only in the Normal flow distributions but also in which flows are labelled as Normal. On average, 84.8% (sd 4.14) of the Background flows labelled as Normal by the SOMs trained using scenario (ii) are also labelled as Normal by the SOMs trained using scenario (i), while only 1.92% (sd 1.81) is identified as Botnet by scenario (i) SOMs. On the other hand, SOMs trained by only Botnet/C&C data (scenario (iii)) label most of the Background flows as Botnet, with completely different distributions from what obtained from scenario (i). Specifically, only 7.06% (sd 6.17) of Background flows labelled as Botnet by scenario (iii) SOMs is confirmed by scenario (i) SOMs, while 59.07% (sd 18.08) of those flows is identified as Normal by scenario (i) SOMs.
To further investigate the Background traffic, we calculate the average quantization error for each identified class (Normal, Botnet, Anomaly) of the Background traffic. For the sake of simplicity, this calculation is done on the data and the trained SOMs from 4.5.1. The quantization error ranges for labelled Background flows by the three training scenarios are shown in Figure 13. Using scenario (i) trained SOMs, the average quantization errors of flows labelled as Normal is 1.06, while it is 0.42 for Botnet flows. These low quantization errors demonstrate that SOMs trained using scenario (i) label the Background traffic as Normal and Botnet with high confidence, considering that the overall average quantization error is 4.69. On the other hand, for the flows labelled as Anomaly, the average quantization error is 10. This higher value confirms the hypothesis that anomaly traffic contains very different behaviours/patterns that were not present in the training data. Similarly, SOMs trained using scenario (ii) give average quantization errors of 2.26 and 5.83 for flows classified as Normal and Anomaly. On the other hand, training scenario (iii) produces SOMs with much higher quantization errors when applied on the Background traffic. On average, the Background flows are classified as Botnet and Not Botnet with quantization error values of 23.74 and 7.63, respectively. These very high error values indicate that SOMs trained using scenario (iii) are not suitable for Background/unknown data analysis.
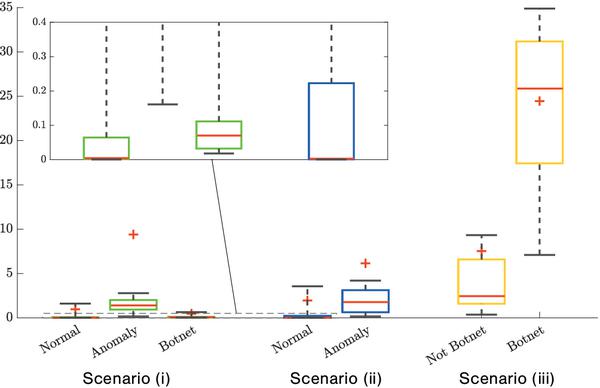
Figure 13 Quantization error ranges of Background flows by labels assigned using SOMs from three training scenarios. The box represents the interquartile range, while the whiskers extend to the 9th percentile and the 91st percentile. Red line and plus sign shows the median and mean, respectively.
5 Conclusion and Future Work
The main objectives in this research are: (i) investigating the capability of SOMs as an unsupervised data analytics system for modelling and classification of network behaviours, and (ii) using this capability for analyzing unknown/unlabelled traffic. Specifically, the research shows the capability of such an approach without scrutinizing network packet content. Thus, this enables a simple solution that is more flexible and adaptable to different deployment conditions and environments.
Using three different SOM training scenarios, the capabilities of this SOM based approach are analyzed and evaluated on publicly available datasets of modern botnets and web attacks. The obtained results are comparable to that of previous supervised machine learning-based approaches, even though the proposed approach is based on the unsupervised learning paradigm. Detection rates of Botnet and Normal classes are up to 99.95% and 99.59% with the training scenario using both classes. Moreover the experiments on unseen botnets and unknown traffic portions show the potential of the approach for building a strong data analytics system for unknown traffic analysis. Our data analytics results on unknown traffic also suggest that when examples (with ground truth) of both malicious and normal behaviours are not available for forming a training dataset, SOMs can be trained on normal data only and still achieve a competitive level of performance, given that the data is diverse enough to cover most part of the legitimate traffic.
For future work, multiple directions are promising for extending the research. Feature extraction and selection methods can be applied to reduce the unnecessary linear dependency between the input features. More analysis in the combined use of SOM hit counts and quantization errors as a filter for unseen data can be carried out. This would test the ability of such an approach in reducing the noise in data and increasing the accuracy. Finally, the performance of the SOM-based data analytics system can be studied against other datasets, to examine its potential of detecting other types of network attacks and malicious activities.
Acknowledgments
This research is funded through the Canadian Safety and Security Program (CSSP), a federally-funded program led by Defence Research and Development Canada’s Centre for Security Science (DRDC CSS), in partnership with Public Safety Canada. The CSSP funds projects and activities that seek to enhance public safety and security capabilities, build cross-functional networks, and provide evidence-based advice and support to public safety and security practitioners and decision-makers. The research is conducted as part of the Dalhousie NIMS Lab at: https://projects.cs.dal.ca/projectx/.
References
[1] Bhuyan, M. H., Bhattacharyya, D. K., and Kalita, J. K. (2014). Network anomaly detection: methods, systems and tools. IEEE Communications Surveys & Tutorials, 16(1), 303–336.
[2] Brownlee, N., Mills, C., and Ruth, G. (1999). RFC 2722-Traffic Flow Measurement. Architecture, 10. https://tools.ietf.org/html/ rfc2722
[3] Burschka, S., Dupasquier, B., Fiaux, A. and Rühl, T. (2016). Tranalyzer, Accessed: 2016-12-07. http://tranalyzer.com/
[4] Cisco Systems. (2016). Snort - Network intrusion detection and prevention system, Accessed: 2016-12-07. https://www.snort.org
[5] Cisco Systems. (2017). Cisco IOS Netflow, Accessed: 2017-02-15. www.cisco.com/c/en/us/products/ios-nx-os-software/ios-netflow/
[6] Damballa. (2016). First Zeus, now SpyEye. Look at the source code now! Accessed: 2016-06-12. https://www.damballa.com/?p=8357
[7] ESET. (2017). First twitter-controlled android botnet discovered by ESET, Accessed: 2017-02-26. https://www.eset.com/a/ig1p02/
[8] García, S., Grill, M., Stiborek, J., and Zunino, A. (2014). An empirical comparison of botnet detection methods. Computers & Security, 45, 100–123.
[9] Goodin, D. (2016). Record-breaking ddos reportedly delivered by >145k hacked cameras, Accessed: 2016-12-26. https://arstechnica.com/?post_type=post&p=966459
[10] Gu, G., Perdisci, R., Zhang, J., and Lee, W. (2008). Botminer: Clustering analysis of network traffic for protocol-and structure-independent botnet detection. In Proceedings of the 17th USENIX Security Symposium, pp. 139–154.
[11] Gu, G., Porras, P. A., Yegneswaran, V., Fong, M. W., and Lee, W. (2007). Bothunter: Detecting malware infection through ids-driven dialog correlation. In USENIX Security Symposium (Vol. 7, pp. 1–16).
[12] Haddadi, F., Runkel, D., Zincir-Heywood, A. N., and Heywood, M. I. (2014). On botnet behaviour analysis using GP and C4. 5. In Proceedings of the Companion Publication of the 2014 Annual Conference on Genetic and Evolutionary Computation (pp. 1253–1260). ACM.
[13] Haddadi, F., and Zincir-Heywood, A. N. (2016). Benchmarking the effect of flow exporters and protocol filters on botnet traffic classification. IEEE Systems Journal, 10(4), 1390–1401.
[14] Haddadi, F., and Zincir-Heywood, A. N. (2017). Botnet behaviour analysis: How would a data analytics-based system with minimum a priori information perform? International Journal of Network Management, 27(4), e1977.
[15] Hall, M., Frank, E., Holmes, G., Pfahringer, B., Reutemann, P., and Witten, I. H. (2009). The WEKA data mining software: an update. ACM SIGKDD Explorations Newsletter, 11(1), 10–18.
[16] Herzberg, B., Bekerman, D., and Zeifman, I. (2017). Breaking down Mirai: An IoT DDoS botnet analysis, Accessed: 2017-02-26. https://www.incapsula.com/blog/malware-analysis-mirai-ddos-botnet.html
[17] Hofstede, R., Jonker, M., Sperotto, A., and Pras, A. (2017). Flow-Based Web Application Brute-Force Attack and Compromise Detection. Journal of Network and Systems Management, 25(4), 735–758.
[18] Ippoliti, D., and Zhou, X. (2012). A-GHSOM: An adaptive growing hierarchical self organizing map for network anomaly detection. Journal of Parallel and Distributed Computing, 72(12), 1576–1590.
[19] Juniper Networks. (2017). Juniper Flow Monitoring, Accessed: 2017-02-15. http://www.juniper.net/us/en/local/pdf/app-notes/3500204-en.pdf
[20] Kayacik, H. G., Zincir-Heywood, A. N., and Heywood, M. I. (2007). A hierarchical SOM-based intrusion detection system. Engineering Applications of Artificial Intelligence, 20(4), 439–451.
[21] Kohonen, T. (2001). Self-organizing maps, Springer series in Information Sciences. Sciences, 55, 58734. ISBN 978-3-540-67921-9.
[22] Kohonen, T. (2014). MATLAB Implementations and Applications of the Self-organizing Map. Unigrafia Oy, Helsinki, Finland, 11–23.
[23] Lawrence Berkeley National Laboratory and ICSI. LBNL enterprise trace repository, 2005. http://www.icir.org/enterprise-tracing
[24] Le, D. C. (2017). An unsupervised learning approach for network and system analysis. Technical Report Master’s thesis, Dalhousie University.
[25] Le, D. C., Zincir-Heywood, A. N., and Heywood, M. I. (2016). Data analytics on network traffic flows for botnet behaviour detection. In IEEE Symposium Series on Computational Intelligence (SSCI), (pp. 1–7). IEEE.
[26] Markou, M., and Singh, S. (2003). Novelty detection: a review—part 1: statistical approaches. Signal Processing, 83(12), 2481–2497.
[27] Nagaraja, S., Mittal, P., Hong, C. Y., Caesar, M., and Borisov, N. (2010). BotGrep: Finding P2P Bots with Structured Graph Analysis. In USENIX Security Symposium (Vol. 10, pp. 95–110).
[28] Nguyen, H. T., Torrano-Gimenez, C., Alvarez, G., Petroviæ, S., and Franke, K. (2011). Application of the generic feature selection measure in detection of web attacks. In Computational Intelligence in Security for Information Systems (pp. 25–32). Springer, Berlin, Heidelberg.
[29] O’Donnell, L. (2018) IoT security concerns peaking with no end in sight, Accessed: 2018-08-01. https://threatpost.com/iot-security-concerns-peaking-with-no-end-in-sight/131308
[30] Paxson, V. (2017). The Bro network security monitor, Accessed: 2017-02-26. https://www.bro.org/
[31] Perdisci, R., Gu, G., and Lee, W. (2006). Using an ensemble of one-class svm classifiers to harden payload-based anomaly detection systems. In Sixth International Conference on Data Mining, ICDM’06. (pp. 488–498). IEEE.
[32] QoSient, LLC. Argus - Auditing Network Activity, Accessed: 2016-12-09. http://qosient.com/argus/
[33] Razzaq, A., Latif, K., Ahmad, H. F., Hur, A., Anwar, Z., and Bloodsworth, P. C. (2014). Semantic security against web application attacks. Information Sciences, 254, 19–38.
[34] RSA Security LLC. Cybercrime 2015: An inside look at the changing threat landscape.Technical Report RSA white paper, EMC, April 2015.
[35] Sabhnani, M., and Serpen, G. (2004). Why machine learning algorithms fail in misuse detection on KDD intrusion detection data set. Intelligent data analysis, 8(4), 403–415.
[36] Silva, S. S., Silva, R. M., Pinto, R. C., AND Salles, R. M. (2013). Botnets: A survey. Computer Networks, 57(2), 378–403.
[37] Szabó, G., Orincsay, D., Malomsoky, S., and Szabó, I. (2008). On the validation of traffic classification algorithms. In International Conference on Passive and Active Network Measurement (pp. 72–81). Springer, Berlin, Heidelberg.
[38] The Honeynet Project. French Chapter, Accessed: 2016-09-10. http://www.honeynet.org/chapters/france
[39] Ultsch, A., and Siemon, H. (1990). Kohonen’s self organizing feature maps for exploratory data analysis. In Bernard Widrow and Bernard Angeniol, editors, In Proceedings of the International Neural Network Conference, pp. 305–308.
[40] Maaten, L. V. D., and Hinton, G. (2008). Visualizing data using t-SNE. Journal of Machine Learning Research, 9, 2579–2605.
[41] Winter, P., Hermann, E., and Zeilinger, M. (2011). Inductive intrusion detection in flow-based network data using one-class support vector machines. In 4th IFIP International Conference on New Technologies, Mobility and Security (NTMS), (pp. 1–5). IEEE.
[42] Wu, X., et al., (2008). Top 10 algorithms in data mining. Knowledge and Information Systems, 14(1), 1–37.
[43] Wurzinger, P., Bilge, L., Holz, T., Goebel, J., Kruegel, C., and Kirda, E. (2009). Automatically generating models for botnet detection. In European Symposium on Research In Computer Security (pp. 232–249). Springer, Berlin, Heidelberg.
[44] Yan, Q., Zheng, Y., Jiang, T., Lou, W., and Hou, Y. T. (2015). PeerClean: Unveiling peer-to-peer botnets through dynamic group behavior analysis. In IEEE Conference on Computer Communications (INFOCOM), (pp. 316–324). IEEE.
[45] Zeifman, I. (2017). Bot traffic report 2016, Accessed: 2017-03-05. https://www.incapsula.com/blog/bot-traffic-report-2016.html
[46] Zhao, D., Traore, I., Sayed, B., Lu, W., Saad, S., Ghorbani, A., and Garant, D. (2013). Botnet detection based on traffic behavior analysis and flow intervals. Computers & Security, 39, 2–16.
[47] Zolotukhin, M., Hämäläinen, T., Kokkonen, T., and Siltanen, J. (2014). Analysis of HTTP requests for anomaly detection of web attacks. In IEEE 12th International Conference on Dependable, Autonomic and Secure Computing (DASC), (pp. 406–411). IEEE.
Biographies

Duc C. Le is a Ph.D. student at Dalhousie University, Halifax, Canada. He received the Master degree in computer science from the same university in 2017, and the B. Eng. degree in electronics and telecommunications engineering from Posts and Telecommunications Institute of Technology, Ha Noi, Vietnam, in 2015. His research focuses on machine learning and its applications in computer and network security and analysis.

Nur Zincir-Heywood has been with the Faculty of Computer Science at Dalhousie University, Halifax, Canada, since 2000. She has become a full professor in 2010. Her research interests include data analytics and machine learning for network traffic analysis, application behaviour analysis, cybersecurity, and network operations. She has published over 150 papers and has substantial experience of industrial research in systems security and computer networking. Dr. Zincir-Heywood is a member of the IEEE, ACM and a recipient of the 2017 Women Leaders in the Digital Economy Award.

Malcolm I. Heywood (M’95–SM’06) received the Ph.D. degree, his work on movement invariant pattern recognition using neural networks from the University of Essex, Colchester, U.K., in 1994. He is currently a Professor of Computer Science at Dalhousie University, Halifax, NS, Canada. His current research investigates the application of coevolutionary methods to reinforcement learning tasks as encountered in computer games (Rubik’s Cube, Arcade Learning Environment, FPS), and streaming data applications (Intrusion Detection and Financial Services). Dr. Heywood is a member of the Editorial Board for Genetic Programming and Evolvable Machines (Springer). He was a Track Co-Chair for the GECCO GP track in 2014 and the Co-Chair for European Conference on Genetic Programming in 2015 and 2016.
Journal of Cyber Security and Mobility, Vol. 8_1, 15–52. River Publishers
doi: 10.13052/jcsm2245-1439.812
This is an Open Access publication. © 2018 the Author(s). All rights reserved.