SPINZ: A Speculating Incident Zone System for Incident Handling
Daichi Hasumi1,*, Shigeyoshi Shima1 and Hiroki Takakura2
1NEC Corporation, Japan
2National Institute of Informatics, Japan
E-mail: d-hasumi@ah.jp.nec.com; shima@ap.jp.nec.com; takakura@nii.ac.jp
*Corresponding Author
Received 14 December 2018; Accepted 19 December 2018;
Publication 02 April 2019
Abstract
Organizations introducing computer and network systems need to quickly and accurately respond to information security incidents to counter intense cyber attacks. However, computer security incident response teams (CSIRTs) in organizations receive a large amount of alerts and logs that they have to investigate. Such a situation increases incident handling time. Our previous research revealed that the triage process in incident handling failed in many incident cases. In our consideration, the triage process lacks the ability to assess overall risks to modern cyber attacks. Zoning of local area networks by measuring internal-network traffic in response to such risks is important. Therefore, we propose the SPeculating INcident Zone (SPINZ) system for supporting the triage process. The SPINZ system analyzes internal-network flows and outputs an incident zone, which is composed of devices related to the incident. We evaluated the performance of the SPINZ system through simulations using two incident-flow dataset generated from two types of internal-network datasets and malicious-activity flows generated from legitimate commands. We confirm that the SPINZ system can detect an incident zone, but removing unrelated devices from an incident zone is an issue requiring further investigated.
Keywords: Cyber Security, Incident Handling, Triage, Traffic Measurement, Anomaly Detection.
1 Introduction
Information and communications technology (ICT) systems are essential for many organizations to fulfill their missions efficiently. One problem they all face is cyber attacks. Attackers target ICT systems to obtain secret information, disrupt operations, or harm the reputation of the target. They do this by using malware and taking advantage of software vulnerabilities. Therefore, many organizations need a quick and accurate response to computer security incidents (referred to hereafter simply as incidents).
In view of this, most organizations monitor security alerts to detect whether they are attacked or if an attacker has already invaded their internal network. If a critical incident occurs, a computer security incident response team (CSIRT) member (the responder) generally isolates suspicious devices from the local network if it is acceptable from the perspective of their business continuation, acquires log data for a more detailed analysis, and recovers the affected devices. These CSIRT activities combined are called incident handling [1].
However, the time to detect and contain cyber attacks is too long compared with the time the attacker needs to achieve his/her objective [2, 3]. To minimize this gap, it is necessary to develop new technologies and methods for supporting CSIRT operations. Our previous research [4] revealed that acquiring log data from both devices and networks and identifying affected areas for incidents are the main factors in preventing prompt incident handling. This is caused by the lack of design of and preparedness for incident handling. If affected areas of an incident are ambiguous, the responder cannot take accurate countermeasures such as isolating devices from the network and limiting network access. Deciding the impact of incidents and determining affected areas have been considered as components of the triage process in incident handling [5].
Therefore, to address this problem, we propose the SPeculating INcident Zone (SPINZ) system for supporting this triage process. The SPINZ system analyzes internal-network traffic and detects the affected area from the incident (incident zone). The incident zone provides useful information about which network addresses are affected and which devices must be investigated against cyber attacks with infection expansion. We evaluated the performance of the SPINZ system through simulations with two representative incident scenarios using internal-network traffic.
2 Incident Handling
Our research has a strong relationship with incident-handling operations that CSIRTs conduct. Therefore, we first introduce the functions and general operation flow of incident handling. At the end of this chapter, we also describe an issue we tackled regarding current incident-handling operations.
In this paper, the meaning of incident handling and its functions are referred from a book published by Carnegie Mellon University Software Engineering Institute (CMU/SEI) [5] (CMU/SEI book). This means that “incident handling” contains all activities related to recovering systems and processes from an incident conducted by CSIRTs. When an incident occurs, three functions of incident handling have important roles for recovering a system. These are explained in the next section.
2.1 Function
In this section, we explain the three functions incident handling provides, i.e., triage, handling, and announce, based on the CMU/SEI book.
2.1.1 Triage
Triage determines the threat level of incidents and prioritizes them. It works as a hub of incident handling and collects information about events related to the incident. This is also a single point of contact and the focal point for accepting, collecting, ordering, and passing on received information for incident handling.
2.1.2 Handling
Handling surveys an incident by collecting log data and analyzing them with log analysis and digital forensic techniques and determining the severity of the incident. It also offers countermeasures for recovering devices and networks from incidents in accordance with an incident response plan. This function includes a wide range of activities and processes.
2.1.3 Announce
Announce shares information to constituencies on their organization, such as the tactics, techniques, and procedures of attackers for reported incidents and countermeasures for them. Sometimes the announce function involves holding a press conference to explain the outline of incidents or reporting incidents to a national CSIRT.
2.2 Operation Flow
In this section, we describe the general operation flow of incident handling when an incident occurs. Figure 1 shows an example of such a flow we organized based on the CMU/SEI book. These operations are generally conducted by a CSIRT. It represents a simple operation flow from incident detection to system remediation and the reporting by a CSIRT of the incident handling. Details of operations corresponding to the numbers in Figure 1 are given below.
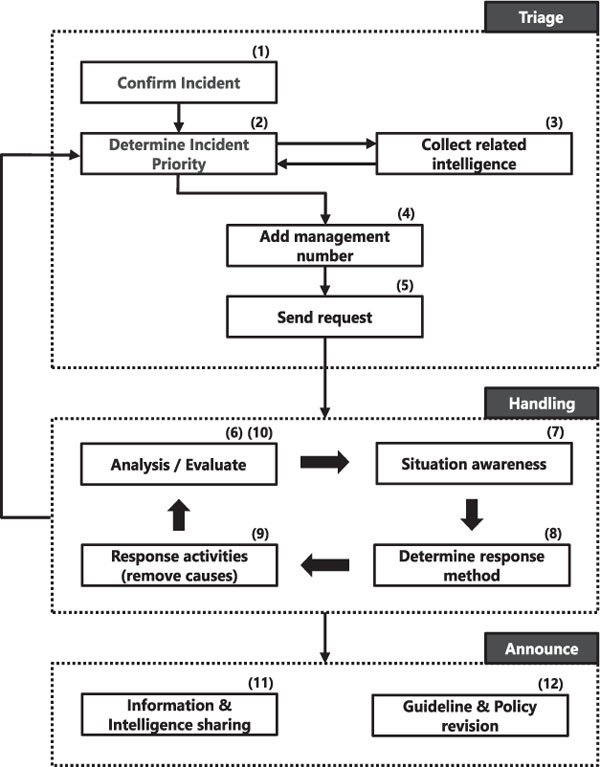
Figure 1 Example of incident-handling-operation flow.
- The triage function receives an incident alert.
- It determines whether the incident should be responded to.
- It surveys past incident cases and cyber-threat intelligence.
- It adds a fixed management number to the incident and manages its status.
- It sends a request to the incident-response function for analyzing the incident.
- The incident response function analyzes and evaluates the incident.
- It gets a picture of a current situation of the incident.
- It offers countermeasures for the incident.
- It conducts countermeasures and removes causes of the incident.
- It evaluates the results of the countermeasures. A CSIRT loops from (6) to (9) until the situation is judged that incident handling operations are not necessary. If a new incident is discovered, return to (2).
- The announce function summarizes the incident report and shares it to other organizations.
- It revises the incident-response plan, security policies, and operation guidelines if necessary.
2.3 Issues
In our previous research [4], we conducted an interview with five incident responders and asked them why it takes a long time to finish resolving incidents during current incident-handling operations.
We organized their answers into three categories. These categories and the answers are listed below.
- Issues related to log data.
- Logs related to the incident are not recorded and investigations can no longer be conducted.
- There are insufficient period logs and detailed logs due to incomplete log management.
- It is unclear which logs are related to the incident from the incident-responder perspective with little context.
- Issues related to the work of an incident responder.
- It is difficult to clarify the whole incident timeline because only logs at devices considered to be suspicious are provided to incident responders and security analysts.
- It is difficult to determine whether malware and malicious scripts can be completely eradicated from local networks.
- Issues related to a security policy.
- An initial response of an incident is careless. Devices necessary for an incident investigation are frequently restarted or sometimes cleared of logs.
- An insufficient recognition of risks to cyber attacks by management.
In view of these issues, it is considered that technology to support the triage process by speculating and visualizing a suspicious area related to the incident is necessary to grasp the current situation and determine the risk before taking logs from devices and analyzing them. Therefore, we developed the SPINZ system described in the next chapter.
3 SPINZ System
We developed the SPINZ system to support the triage process during incident handling. In this chapter, we describe the concept of incident zone, and its calculation algorithm.
3.1 Incident Zone
Table 1 lists the observable internal-network activities during representative malware incident [6–8]. The most frequent observation activity is communications with command & control (C2) servers, but the second most frequent is the spreading of infections in the local network. This means that it is important to grasp the status of internal infections as much as monitoring communications with the Internet at the gateway for detecting and responding to incidents.
However, in the current triage process, a responder tends to only investigate a device marked with a high-importance alert or one that is obviously behaving suspiciously. This investigation method leads to failure in incident containment when attackers are already in control of multiple devices in the same local network because they can aware that they were detected by receiving signals from infected devices. Therefore, attackers can delete their trails and evade detection by suppressing their activities before an incident responder’s investigation.
Table 1 Observable internal network activities in representative malware incident cases
| Activity | Stuxnet | Duqu | Flame | Red October | Carbanak | Petya |
|---|---|---|---|---|---|---|
| Connect to Command & Control (C2) servers | ✓ | ✓ | ✓ | ✓ | ✓ | – |
| Spread infections in internal network | ✓ | ✓ | ✓ | – | – | ✓ |
| Use infected devices for proxy server | ✓ | – | – | – | – | – |
| Construct peer-to-peer network between infected devices | ✓ | ✓ | – | – | – | – |
In this situation, it is necessary to conduct triage to determine risks and countermeasures by defining areas where other devices are susceptible to incidents, which we call the incident zone. Defining the incident zone allows responders to control service availability and business continuity while handling incidents with an accurate risk perception.
3.2 System Design
The SPINZ system is based on the idea that abnormal communications between the incident device and other devices might be suspicious. It is composed of agents and an analyzer. Figure 2 illustrates an overview of the components and process of this system.
An agent is software installed on a device using the local network. It records network packet headers communicating with other devices on the device on which the agent is installed (payload capture is not necessary). The TCP, UDP, and ICMP are selected as the recorded protocols for the SPINZ system. Log data are recorded for each communication session, and each session includes the basic 5-tuple information (source IP, destination IP, source port, destination port, and protocol number) plus the number of packets, bytes per session, and session start time and its duration. Logged flows are limited to internal communications because the SPINZ system focuses on internal malicious activities such as spreading of infection and lateral movement by attackers. Once a serious incident occurs, the agent sends logs to the analyzer in accordance with the analyzer’s order.
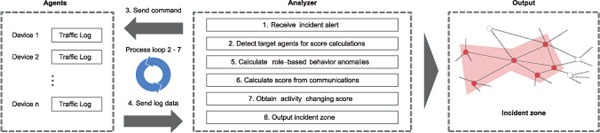
Figure 2 Overview of components and process of the SPINZ system. Numbers before each description indicate SPINZ system processing order.
The analyzer sends orders to the agents on target devices to collect the communication log data and analyzes the data to detect the incident zone. There are three basic steps for this analysis.
(Step 1) The analyzer defines device roles of the target device and devices communicating with it at regular intervals based on the number of transmission bytes. The device role reflects its function on the local network. We defined two role types: client and server. Client devices include those an employee commonly uses. In contrast, server devices include those that provide particular services, for example, file-sharing servers, internal web services, and authentication. This step focuses on finding cases in which roles change on the same device at different intervals. Changing roles on a device between intervals directly suggests a transition in device behavior. Therefore, the analyzer gives a high score to these cases.
(Step 2) Next, the analyzer investigates the target device’s traffic log. The purpose of this step is to find and score uncommon communications in accordance with the empirical rules. The result is calculated using the rule set and a change-point-detection method.
(Step 3) The final step combines the results from Steps 1 and 2 to obtain the activity-change score for the target device. The analyzer compares the threshold and score to determine whether the target device belongs in the incident zone. If the target device is put into the incident zone, the analyzer applies the calculations from Steps 1–3 to the other devices communicating with the target device. This process loop continues recursively as long as devices for the next calculation exist.
As a result of the above steps, the incident zone is outputted with devices which has a high relevance to the incident. The responder can consider incident risks and respond by referring to this incident zone.
3.3 Scoring Algorithm
Note that with the detailed calculation method, an analysis period is denoted as AP, split period as SP, a target device to calculate the activity-change score as x, and devices communicating with x in an AP as y ∈ Yx. Also, α is the initial device on which an incident was detected (the first detected device is added to the incident zone automatically). We also represent a slot window sequence as {w1, w2, · · · , wn}, where n is the number of APs divided by SP, and w is a time-slot window.
3.3.1 Step 1: Calculate role-change score
The analyzer first defines a device’s roles, Client or Server, in the local network at every window. If a Client device exhibits infection activities, its role might change to Server. Therefore, predicting role change is suitable to grasp communication-flow changes in a local network. Li et al. [9] studied a classification method to separate internal-device roles into Client or Server. Their method applies a statistical classifier to long-term flow data. However, in the SPINZ system, SP is interchangeable as the demand of a responder or local network environment. Therefore, we used transmission amounts to determine a device’s role because their research claimed that the transmission amount was the most significant variable contributing to a classifier in role detection. The device role for x at w is expressed by Equation 1.
where send (x, w) and receive(x, w) represent sending and receiving bytes of x at w from all internal communications. We define all device roles at every w using Equation 1.
The analyzer then calculates the role-change score Srole of x at every w. Srole is expressed by
where RoleChange is a function that outputs 0 or 1 based on the previous role of w. If the roles in a previous and current window were the same, RoleChange outputs 0; otherwise, it outputs 1. RoleChange(x, w1) is always 0 because the first role of w1 is regarded as a base role. Note that Srole is an array, and its size is n.
3.3.2 Step2: Calculate communication score
Next, the analyzer investigates the communication between x and y ∈ Yx at every w. Step 2 calculates the communication score Scomm using the role-combination rules and change points based on the transmission bytes per session.
To calculate Scomm, we prepared a variation score var(x, y, w) between the target device x and communicating device y at window w. We calculated var using Equation 3.
Equation 3 represents the role-combination rules to derive var values. Note that Comb(x, y, w) is a function that returns a tuple of roles from x and y at w, and cdmax (x, y, w) represents the maximum score calculated using a changepoint-detection method between x and y at w, and Thcd is a threshold to determine if variations in communication between devices are suspicious enough. In this paper, role types were limited to two; Therefore, Comb returns one of four types of tuples. Suspicious or unusual communication in the local network was detectable looking at the source-device role and that of the destination device. This suggests that rules for suspicious communication from role combination can be defined, for example, a communication between Client would be suspicious because it does not usually occur in a common local area network. In addition, communications in which large variation was observed were also considered suspicious, even though role combination is common. Therefore, we incorporated these ideas into the rule set using a change-point-detection method. We adopted ChangeFinder [10] to detect variations in transmission bytes per session between x and y for each w when we receive network sessions with common role combinations. If the maximum score of ChangeFinder cdmax exceeds Thcd, var is 1 in specific role combinations. For simplicity, ChangeFinder scores are normalized from 0 to 1.
Subsequently, the analyzer found a maximum var (denoted as varmax)in Yx for each w and constructed an n-sized array Scomm arranged in order of w.
In Equation 5, I (x,y) is self-information [11], freq(x,y) is the frequency of communication of x to y in communications related x during the whole AP, and I (x, y) was introduced to take into account the rarity of a communication in w.
3.3.3 Step 3: Merge score
The final step combines Srole and Scomm to calculate the activity-change score Sact, which is calculated by
where m is a mixture ratio, sup is a suppression factor, and hop(x, α) is a function that returns the number of network hops between x and α. This function was introduced for the hypothesis that the incident zone is close to α. The range of m and sup is [0, 1]. If even one Sact(Sact is an n-sized array) has a larger value than threshold Thact, device x is put into the incident zone, and devices Yx become the target devices for next calculation. The device whose score had already been calculated is not selected as next target again. This calculation loop continues until the next target device no longer existed.
4 Experimental Results
We conducted simulation experiments to evaluate performances of the SPINZ system. The SPINZ system requires internal-network flows that include malicious activity. Therefore, we generated two types of incident-flow datasets to evaluate the SPINZ system by blending normal internal-network datasets and malicious-activity flows. In this chapter, we describe these two incident-flow datasets, malicious-activity flows, incident scenarios, and simulation results of the SPINZ system.
4.1 Dataset
To generate incident-flow datasets, we blended two normal internal-network datasets and malicious-activity flows. In this section, we describe the specifications and suitability of normal internal-network datasets and malicious-activity flows for the evaluation of the SPINZ system.
4.1.1 Normal internal-network datasets
We prepared two normal network-flow datasets.
The first one is an open dataset from Los Alamos National Laboratory (LANL) [12, 13]. Network flows in this dataset are collected at central routers in the LANL network. Therefore, it could be considered that it includes most internal communication sessions between devices in the entire LANL network. The LANL dataset contains 129,977,412 session flows over 29 days, and 12,027 IPs. It recorded nine items per line: [start time, duration, source IP, source port, destination IP, destination port, protocol number, number of packets, transmission bytes]. Figure 3 shows a part of a log in the LANL dataset. Each row in the LANL dataset represents a separate communication session, and attributes in a row are separated by commas. This dataset represents normal internal-network flows in an organization with traditional network architecture.
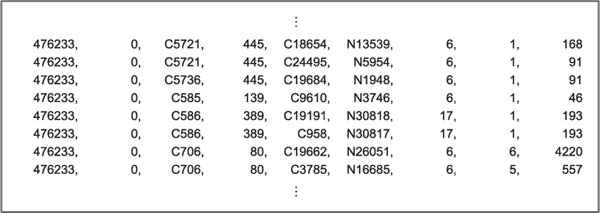
Figure 3 Part of logs in LANL dataset.
The second dataset is a hand-made dataset from our enterprise network flows (enterprise dataset). Figure 4 shows a simple network architecture representing a part of our enterprise network. Network flows in the enterprise dataset are collected between the target-network segment and other networks (Packet Capture Point in Figure 4). Such an environment is common in enterprise networks. A certain network segment is a virtual-machine cluster on a hypervisor or servers on a cloud. In such networks, it is difficult to capture internal communications within all network segments all the time due to performance problems. Therefore, security analysts and incident responders in organizations are forced to collect network flows between network segments. This dataset represents normal internal-network flows in an organization with a modern network architecture. The enterprise dataset contains 103,020,857 session flows from Oct 1 to Oct 31, 2017 (one month), and 24,428 IPs. It recorded the same items and formats as the LANL dataset.
The enterprise dataset only contains internal communications with the TCP and UDP packets. Note that DNS and ICMP packets were dropped from the enterprise dataset in accordance with our network-operation policy. Furthermore, session flows with IPs related to incidents were excluded from this dataset. Therefore, we consider that the enterprise dataset represents normal internal-network flows.
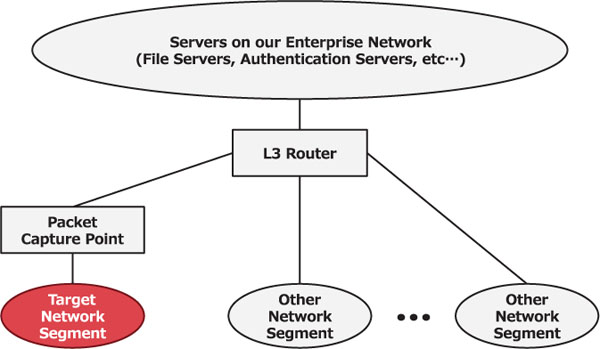
Figure 4 Simple network architecture for part of our enterprise network.
For the evaluation, we removed traffic flows related to core service servers from the two normal network-flow datasets because core service servers, such as authentication servers and mail servers, are generally monitored. Therefore, they were outside the scope of the SPINZ system. In general, core service servers communicate with the huge number of devices in the local area network. Thus, there is a possibility that core service servers and other devices in the local area network could be distinguished by the number of communications with other devices (degrees). we made a discrimination based on degrees for each IP in both datasets. Figures 5 and 6 show the degree-distribution plot when a graph was constructed with each IP as a node and each communication between different IPs as an edge in the LANL and enterprise datasets. The x-axis represents the degree of each IP, and the y-axis represents the fraction of nodes in the graph with the corresponding degrees. We found that almost all IPs had less than 120 degrees and few IPs had extremely high degrees. This means that core service servers can be divided from all IPs by the degree on both datasets.
For the LANL dataset, we defined that the top 0.5% of IPs, which had more than 204 degrees, as core service servers, and the remaining 95%, which had less than 24 degrees, as common devices, and 4.5% as common servers.
Similarly, for the enterprise dataset, we defined that top 0.5% IPs, which had more than 1002 degrees, as core service servers, and the remaining 95%, which had less than 152 degrees, as common devices and 4.5% as common servers.
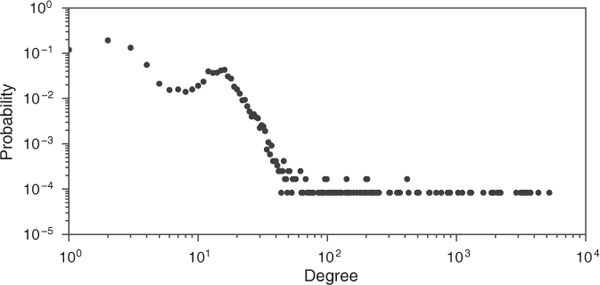
Figure 5 Degree distribution in LANL dataset.
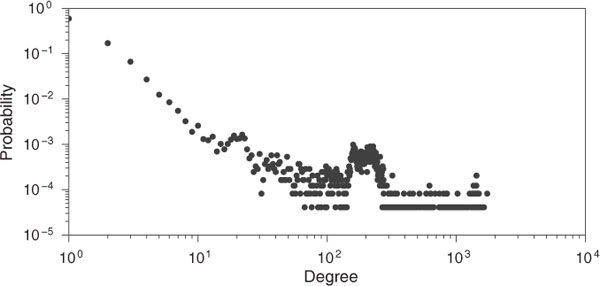
Figure 6 Degree distribution in enterprise dataset.
Finally, we removed flows with core service servers from both normal network-flow datasets.
4.1.2 Malicious activity flows
We also prepared typical lateral-movement flows from a closed experimental network. We observed scan and file-sharing flows using net command and PsExec [14] between two machines installed with Windows 7. Detailed commands we inputted are described below.
- net view [Target]
- psexec [Target] -u [user name]-p [password] xcopy “[Source]\share\\malware” “c:\\”
[Source] was an IP address trying to infect other devices, and [Target] was an IP address infected from the [Source]. [user name] and [password] were [Target]’s authentication information. In addition, Emdivi RAT T17.08.34, which is malware used for actual advanced persistent threat (APT) attacks, was chosen as a file to be transmitted. The net command and PsExec are general tools found in APT incident cases [15]. Therefore, we regarded these flows as typical malicious-activity flows. These session flows were recorded in the same format as the LANL and enterprise datasets.
We then mixed malicious-activity flows into the normal internal-network flows we described above. A dataset having flows in which normal internal-network and malicious-activity flows are mixed is called an incident-flow dataset. For the evaluation, we generated two types of incident-flow datasets from the LANL and enterprise datasets. Note that mixed malicious-activity flows could not be distinguished from normal flows in an incident-flow dataset. What time and how many malicious-activity flows are added to the two normal-internal network datasets depended on the incident scenario, which we explain in the next section.
4.2 Incident Scenario
Two parameters, i.e., infection count (IC) and infection frequency (IF), were required to generate the incident-flow datasets based on incident cases. The IC represents the total infected count in the incident scenario, and IF represents the interval between infected flows. These two parameters have the relation IF = IC/Tatk (Tatk represents the total attack period, we assumed that all attacks were conducted during an AP in this experiment).
We used two incident scenarios: shallow infection and deep infection.
Shallow infection is a scenario assuming a malware-infection method, such as traditional bots or ransomware, with which infections spread from an infected device to many local devices in a short time. In this scenario, we set IC to 37 (from the National Audit Office report [16]) and IF to 1 second.
Deep infection is a scenario assuming an infection method of a typical APT attack, where an infection spreads from an infected device to a specific target device in accordance with the purpose of the attacker over a long time. In this scenario, we set IC to 5 and IF to 24 hours. This means the attacker infected another device once a day and repeated this five times. This behavior simulated an attacker’s “deep” movement in the local network and is difficult to detect using statistical anomaly-detection methods.
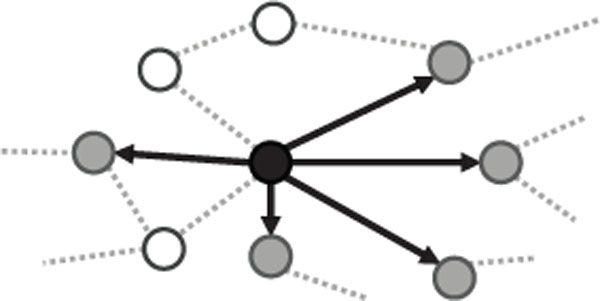
Figure 7 Shallow-infection scenario (IC = 5).

Figure 8 Deep-infection scenario (IC = 3).
Figures 7 and 8 are example visualizations of the shallow and deep incident scenarios, respectively. The black node shows the initially infected device, which spreads to other devices (gray nodes) for each infection frequency.
4.3 Simulations
Finally, we evaluated the SPINZ system through simulations using the incident-flow datasets with the two incident scenarios. The purpose was to confirm the reliability of outputted incident zones. Therefore, we adopted recall and precision as performance measures. Both measures are described with Equations 8 and 9.
In both equations, TP is the true positive rate, FP is the false positive rate, and FN is the false negative rate from the simulation results. Recall is how much the incident zone contained actual related devices, and precision is how close the size of the incident zone was to an actual zone. The initially infected device and attacked devices were randomly selected in each simulation. The initially infected device was limited to a common device because attackers generally infect common devices via email or those with critical vulnerabilities to modern cyber attacks [17]. Table 2 shows the parameters for the SPINZ system. We set the same parameters for both incident scenarios and incident-flow datasets, but IC and IF were dependent on the incident scenario. Note that we used the first 14-day sessions from the original normal-flow dataset in accordance with the AP. Although the size of the final incident-flow datasets inputted to the SPINZ system was smaller than the individual datasets, the 14-day sessions in the incident-flow dataset with the LANL dataset contained 11,504 IPs and 114,560,974 flows. The 14-day sessions in the incident-flow dataset with the enterprise dataset contained 16,734 IPs and 49,265,542 sessions. Therefore, we determined that these sessions on both datasets were sufficient as a dataset of a large local area network.
Table 2 Parameters for simulation
| Parameter | Value |
|---|---|
| AP Thcd Thact m sup Attack Start Time r (for ChangeFinder) |
14 days 0.75 0.4 0.5 0.95 7.5 days 0.1 |
The ChangeFinder parameters were the same as in the original paper [10] (k = 2, T = 5), but the discounting parameter r was 0.1, as shown in Table 2. We also changed SP to 1, 3, 6, 12, and 24 hours to evaluate performance change. For each SP parameter, simulations were conducted 20 times and the average values are plotted in Figures 9 and 10.
Figure 9 and Figure 10 show the simulation results in shallow-and deep-infection scenarios, respectively. The left y-axis represents the average recall, right y-axes represents the average precision, and the x-axes represents SP. In both figures, the line at Recall (LANL) and that at Precision (LANL) represent the respective values during the simulations with the incident flow dataset using the LANL dataset in each incident scenario. Similarly, in both figures, the line at Recall (enterprise) and that at Precision (enterprise) represent the respective values during simulations with the incident-flow dataset using the enterprise dataset in each incident scenario.
The average recall was quite high, and a large change was not observed in each SP graph. However, the average precision was overall low. In the incident-flow dataset with the LANL dataset, all average recall and precision values through SPs were (0.989, 0.013) (Figure 9) and (0.997, 0.168) (Figure 10).
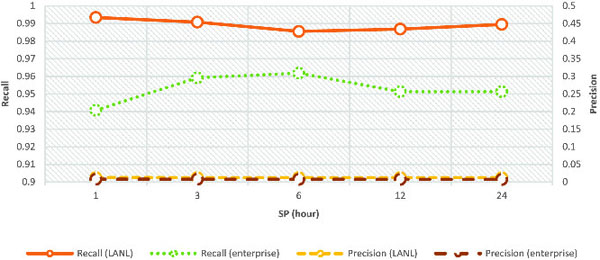
Figure 9 Simulation results in shallow-infection scenario (simulation time N = 20).
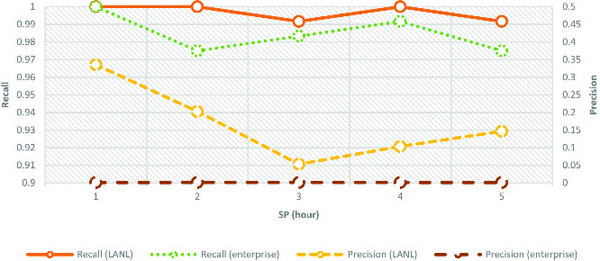
Figure 10 Simulation results in deep-infection scenario (simulation time N = 20).
In the incident-flow dataset with the enterprise dataset, all average recall and precision values through SPs were (0.953, 0.007) (Figure 9), and (0.985, 0.001) (Figure 10).
5 Discussion
The SPINZ system exhibited good recall values for both incident scenarios with both incident-flow datasets. This means that the SPINZ system outputted incident zones that included almost all devices related to the incident by analyzing the internal-network flows without any specific knowledge about the incident and cyber attacks. The SPINZ system would be quite helpful to responders when they make initial decisions about an incident during triage because missing devices related to an incident leads to failure in incident handling.
However, precision values were markedly low in the shallow-and deep-infection scenarios with the incident-flow dataset using the enterprise dataset, and the shallow-infection scenario with the incident-flow dataset using the LANL dataset. A low precision value indicates that the SPINZ system outputted an inaccurate incident zone with unrelated devices. This was caused by the system by only taking into account the role of devices, role-combination rules, and communication fluctuation. Interestingly, the precision values were relatively better in the deep-infection scenario with the incident-flow dataset using the LANL dataset. This was because there were few communication devices in the initial incident device, and the expansion of the incident zone was suppressed. The internal-network flow generally fluctuates daily because when employees process different tasks, they generate different communication patterns. We considered that the easiest solution to improve precision was to limit the number of flows inputted to the SPINZ system. For example, it was conceivable to input only the flow whose destination port was 445 into the SPINZ system. Considering actual operation, the size of the incident zone could be smaller as the responder proceeds in the investigation because the responder could mark devices investigated in detail as related devices or not. Thus, the SPINZ system could shrink the incident zone by cutting nodes spread out from innocent nodes.
6 Related Work
With increased damage due to APT and zero-day vulnerability attacks, traffic monitoring and measurement of local networks have become mandatory to understand cyber-attack outlines. Threat-detection methods with malware using internal-network flows are mainly divided into botnet and lateral-movement detection.
Botnet-detection methods focus on anomalies in device behavior [18, 19]. These methods use the correlation between communication trends or bot patterns. This is because bots belonging to the same bot family have the same or similar behaviors according to their architecture.
Detecting lateral movement differs from detecting botnets. Fawaz et al. [20] proposed a framework to detect lateral movement using distributed data fusion in a large network. Their architecture has three communication graphs at the host, cluster, and global levels. Agents at these three levels cooperate to detect lateral-movement activity.
Alternatively, Hasegawa et al. [21] proposed an adaptive network-control method to minimize damage from APT attacks after detecting an incident. They introduced an infection suspicious level (ISL) for each network segment. Their method isolates network segments and devices in the entire network to suppress an attacker’s activity, if necessary.
To protect internal networks, a unified system to detect and respond to both botnets and lateral movements is required. However, current research has only considered one threat on either side or focused on a detection phase. On the other hand, the SPINZ system takes into account both threats when an incident is detected and provides support with the triage process to the area affected by the incident.
7 Conclusion and Future Work
Triage is a significant process for successful incident handling. However, the triage process lacks the ability to recognize risk in other devices and the local network against cyber attacks. We considered zoning a local area network with risk recognition by measuring internal-network traffic as important for incident handling. Therefore, we proposed the SPeculating INcident Zone (SPINZ) system, which analyzes internal-network flows and outputs an incident zone that includes devices related to the incident. By defining high-risk devices as part of an incident zone, a responder can appropriately recognize a risk and prompt an initial countermeasure to the incident.
We also evaluated the performance of the SPINZ system through simulations with two representative incident scenarios. We created two types of incident-flow datasets from normal internal-network dataset and malicious-activity flows. As a result, the SPINZ system outputted incident zones that included devices related to the incident in both scenarios with each incident-flow dataset. However, we also found that a large number of unrelated devices were included in the incident zone.
In this paper, we conducted fundamental evaluations and discussions through simulation experiments for a system which speculates an affected area of incidents for supporting triage process in incident handling. We will put this system on the real network and will conduct further evaluation. We are also going to work on issues discovered during actual incident handling operations, to realize more effective response solution for cyber attacks.
References
[1] Cichonski, P., Millar, T., Grance, T., and Scarfone, K. (2012). Computer security incident handling guide. NIST Special Publication, 800(61).
[2] Ponemon Institute (2017). 2017 Cost of Data Breach Study Global Overview. https://www-01.ibm.com/common/ssi/cgi-bin/ssialias?html fid=SEL03130WWEN
[3] Verizon (2016). 2016 Data Breach Investigations Report. https://www.verizonenterprise.com/resources/reports/rp_DBIR_2016_Report_en_xg.pdf
[4] Hasumi, D., Shima, S., and Kakumaru, T. (2016). Issue analysis toward forensics gathering infrastructure that supports the more efficient incident handling. In The Special Interest Group Technical Reports of IPSJ, 2016-SPT-17(7). pp. 1–6.
[5] West-Brown, M. J., Stikvoort, D., Kossakowski, K. P., Killcrece, G., and Ruefle, R. (2013). Handbook for computer security incident response teams (CSIRTs). Technical Report, Carnegie Mellon SEI, CMU/SEI2003-HB-002.
[6] Virvilis, N., and Gritzalis, D. (2013). The big four-what we did wrong in advanced persistent threat detection?. In Availability, Reliability and Security (ARES), 2013 Eighth International Conference on. pp. 248–254. IEEE.
[7] Beukema, W. J. B. (2016). Enhancing Network Intrusion Detection through Host Clustering. Master’s thesis, University of Twente.
[8] Simos, M. (2018). Overview of Petya, a rapid cyberattack. https://cloud blogs.microsoft.com /microsoftsecure/2018/02/05/overview-of-petya-a-rapid-cyberattack/
[9] Li, B., Gunes, M. H., Bebis, G., and Springer, J. (2013). A supervised machine learning approach to classify host roles on line using sFlow. In Proceedings of the first edition workshop on High performance and programmable networking (HPPN 2013). pp. 53–60. ACM.
[10] Takeuchi, J. I., and Yamanishi, K. (2002). A unifying framework for detecting outliers and change points from time series. In IEEE transactions on Knowledge and Data Engineering, 18(4). pp. 482–492. IEEE.
[11] Proakis, J. G., and Salehi, M. (2002). Communication Systems Engineering. 2nd ed. Prentice Hall Inc.
[12] Kent, A. D. (2015). Comprehensive, Multi-Source Cyber-Security Events. Los Alamos National Lab. (LANL). doi:10.17021/1179829.
[13] Kent, A. D. (2015). Cybersecurity Data Sources for Dynamic Network Research. Dynamic Networks in Cybersecurity, Imperial College Press. pp. 37–65.
[14] Microsoft. (2016). Microsoft TechNet Windows Sysinternals PsExec. Ver 2.2. https://docs.microsoft.com/en-us/sysinternals/downloads/psexec
[15] JPCERT/CC. (2017). Detecting Lateral Movement through Tracking Event Logs. https://www. jpcert.or.jp/english/pub/sr/ ir_research.html
[16] National Audit Office. (2017). Investigation: WannaCry cyber attack and the NHS. https: //www.nao.org.uk/report/ investigation-wannacry-cyber-attack-and-the-nhs/
[17] Verizon (2018). 2018 Data Breach Investigations Report. https://www.verizonenterprise.com/resources/reports/rp_DBIR_2018_Report_en_xg.pdf
[18] Gu, G., Porras, P. A., Yegneswaran, V., Fong, M. W., and Lee, W. (2007). Bothunter: Detecting malware infection through ids-driven dialog correlation. In USENIX Security Symposium, 7. pp. 1–16.
[19] Gu, G., Zhang, J., and Lee, W. (2008). BotSniffer: Detecting botnet command and control channels in network traffic. In Proceedings of the 15th Annual Network and Distributed System Security Symposium (NDSS’08).
[20] Fawaz, A., Bohara, A., Cheh, C., and Sanders, W. H. (2016). Lateral Movement Detection Using Distributed Data Fusion. In 2016 IEEE 35th Symposium on Reliable Distributed Systems (SRDS’16), 10. pp. 21–30. IEEE.
[21] Hasegawa, H., Yamaguchi, Y., Shimada, H., and Takakura, H. (2016). An incident response support system based on seriousness of infection. In 2016 International Conference on Information Networking (ICOIN). pp. 69–74. IEEE.
Biographies

Daichi Hasumi earned his bachelor’s and master’s degree in Engineering from Shibaura Institute of Technology, Tokyo. He joined NEC Corporation in 2015 and have been working on Research & Development for cybersecurity at NEC Security Research Laboratories. He is currently studying Network Security and Security Operations, especially a supporting technology for Incident Handling. His research interests are in the areas of Machine Learning, Computer Network, and Cybersecurity. He is also a member of ACM.

Shigeyoshi Shima received Bachelor of Science from Hirosaki University (in 1995), Master Degree of Information Science from Japan Advanced Institute of Science and Technology (in 1997), and his Ph.D. in applied engineering from the University of Electro-Communications (in 2012). He is currently working as a principal researcher, Department of Central Research Laboratories, NEC Corporation, Japan. His research interests include cyber security, system security, and economics of information security. He is a member of the IEICE, IPSJ.

Hiroki Takakura received his B.S. and M.S. degrees from Kyushu University in 1990 and 1992, and Ph.D. degree from Kyoto University in 1995. He was a research fellow of Japan Society for Promotion of Science since 1994 to 1995 (also a visiting scholar at University Illinois at Urbana Champaign), a research associate at Nara Institute of Science and Technology since 1995 to 1997, a lecturer at Kyoto University since 1997 to 2000, an associate professor at Kyoto University since 2000 to 2009, and a professor at Nagoya University since 2010 to 2015. Since 2015 he is a professor at National Institute of Informatics. His research interests include network security, databases, and geographic information system. He is a member of Information Processing Society, Japan; Geographic Information Systems in Japan; The Institute of Systems, Control and Information Engineers and ACM.
Journal of Cyber Security and Mobility, Vol. 8_3, 341–364.
doi: 10.13052/jcsm2245-1439.833
This is an Open Access publication. © 2019 the Author(s). All rights reserved.