The Need for Steganalysis in Image Distribution Channels
Martin Steinebach*, Huajian Liu and Andre Ester
Fraunhofer SIT, Darmstadt, Germany
E-mail: steinebach@sit.fraunhofer.de
*Corresponding Author
Received 14 December 2018; Accepted 19 December 2018;
Publication 02 April 2019
Abstract
The rise of social networks during the last 10 years has created a situation in which up to 100 million new images and photographs are uploaded and shared by users every day. This environment poses an ideal background for those who wish to communicate covertly by the use of steganography. It also creates a new set of challenges for steganalysts, who have to shift their field of work away from a purely scientific laboratory environment and into a diverse real-world scenario, while at the same time having to deal with entirely new problems, such as the detection of steganographic channels or the impact that even a low false positive rate has when investigating the millions of images which are shared every day on social networks.
We evaluate how to address these challenges with traditional steganographic and statistical methods, rather than using high performance computing and machine learning. To achieve this we first analyze the steganographic algorithm F5 applied to images with a high degree of diversity, as would be seen in a typical social network. We show that the biggest challenge lies in the detection of images whose payload is less then 50% of the available capacity of an image. We suggest new detection methods and apply these to the problem of channel detection in social network. We are able to show that using our attacks we are able to detect the majority of covert F5 channels after a mix containing 10 stego images has been classified by our scheme.
Keywords: steganography, steganalysis.
1 Introduction
The interest in steganalysis has risen in recent years due to its usage in various criminal cases. It was used by Ossama bin Laden and other members of the organization al-Qaeda to communicate covertly [6, 9]. Another example is a Russian spy network, which operated in the United States of America and was uncovered in 2005 [10].
Currently it is still hard to determine if a single image has been used as a stego cover, especially if the amount of embedded data is well below its capacity. But as steganography is to be seen as a communication channel, it is unlikely that detection needs to rely on a single image. Monitoring a communication and combining the probability of steganographic occurrences can provide more reliable results. This concept is known as “pooled steganalysis” [2, 7] and is usually mentioned together with “batch steganography” where multiple images are used to transmit a single message of high payload. While this concept follows an important aspect of steganography, the distribution of payload over multiple covers and its detection, it may be bound to fail in real-world-scenarios. In this paper we assume that due to the payload available in images transmitted via channels like social media today, only few images of a channel will be used as stego covers while the rest will be decoy. To reflect this, in the following we use the parameter Rstego to describe the amount of images in a channel which are stego covers. It is calculated by dividing the number of stego images by the number of all images in the channel.
The amount of images sent over the Internet is vast: 95 million photos are uploaded on an average day on Instagram and more than 40 billion photos have been already shared there (www.socialpilot.co). Via Snapchat 20,000 photos are shared every second, roughly 1.7 billion photos per day (www.socialpilot.co) and on Facebook 300 million photos are uploaded per day (Gizmodo).
Therefore low error rates are vital in steganalysis, especially low false positive rates. In [11] we have addressed the challenge of steganalysis in image channels and in [12] we introduced an algorithm with a focus on minimal false positives. We complement this algorithm now with a second algorithm that provides minimal false negatives. The overall concept is to identify potential stego image channels with a low false positive rate and then identify the actual stego images in the channel with a low false negative rate.
2 Steganography and Steganalysis
Steganography is the transmission of data or messages in a carrier medium (cover). In addition to maintaining the confidentiality of the message, the goal of steganography is to maintain confidentiality. To this end, the data is embedded in the carrier medium in a way that it is not possible for a third person to make a statement about whether a message has been embedded by simply viewing the medium. Compared to classical cryptography, which aims to keep messages secret by encrypting them, steganography aims to ensure secrecy by hiding the message. Examples of classical steganography are writing with invisible ink or the use of micropoints. In computer-assisted steganography, for example, multimedia files such as pictures, videos or audio files are used as the carrier medium instead of paper or text. The advantage of many multimedia files is the possibility to embed messages with such minor changes that they are not visible to the viewer. In this section we provide a brief overview on steganography and steganalysis based on the F5 algorithm, one of the best known steganographic methods with a well known attack.
2.1 JPEG Format
Since the JPEG format differs considerably from the bitmap format, the approach described can not be directly transferred. In order to better understand what distinguishes a JPEG from a bitmap, we discuss the two steps in the process of JPEG coding, which are of particular interest with respect to the F5 algorithm.
In contrast to the bitmap, no color values are stored directly in JPEG files. Instead, several processing steps are performed in which the RGB color values are converted to another representation. The color values are converted into a frequency space, which means that the image is no longer represented by color values, but by frequencies. The values of these frequencies are called DCT coefficients.
The last step in JPEG coding is entropy coding. It is used to compress the generated DCT coefficients to keep the resulting file size as low as possible. Apart from the entropy coding, all steps of the coding are loss-prone. This means that the repeated execution of these steps, due to rounding errors or selected quality levels, leads to an increasingly deteriorating image quality. The entropy coding, on the other hand, is loss-free.
Since the entropy coding of the data in the last step of the JPEG coding is loss-free, this step can be repeated as often as desired without losing the quality of the image. This means, a JPEG file can be decoded to its stored coefficients and re-encoded again without any loss as long as decoding to a bitmap and re-encoding including quantization are avoided.
2.2 Steganography in JPEG Images
Steganography in JPEG images takes advantage of the fact, that with the exception of the quantization, the entire compression chain can be reversed. In particular it is possible to decode the Huffman-encoded DCT coefficients, manipulate them and re-encode the image using the same Huffman encoding. Similar to the spatial domain, a frequency domain based LSB steganography algorithms manipulates the DCT coefficients in a way which is usually not detectable by the human eye.
One example for LSB steganography in JPEG images is the F5 algorithm, developed by Andreas Westerfeld [14]. Its analysis and successful detection will be at the center of this paper. It is therefore necessary to understand in which way F5 manipulates images in order to embed a secret message.
2.3 The F5 Algorithm
The F5 algorithm has the advantage over traditional LSB steganography, that it can be integrated into the standard JPEG compression chain, after the quantization has been performed. The values of DCT coefficients can be both positive and negative in an JPEG image. This allows for more flexibility in the embedding process. The F5 algorithm operates on the absolute values of the coefficients, rather then just the value of the LSB and is therefore strictly speaking not a pure LSB algorithm.
Message bits are embedded into the DCT coefficients by F5 by following rules:
- Read current DCT coefficient (DC)
- Leave DC as is if
- DC is 0
- LSB of DC is equal to bit to embed
- Embed bit by
- decreasing DC by 1 if necessary if DC > 0
- increasing DC by 1 if necessary if DC < 0
- Skip DC and repeat operation if resulting DC is 0
In order to ensure an equal embedding density throughout the cover medium F5 combines the use of message scattering and matrix encoding as described by Ron Crandall in [3]. Matrix encoding is a technique which is used to increase the efficiency of the embedding process by decreasing the number of changes needed for a set number of message bits.
2.4 F5 Steganalysis
Steganographic algorithms are usually detected by statistical anomalies caused by the message embedding. This effect becomes particular noticeable when the majority of the available message capacity of the image is used. Since the absolute value of the pixel or the DCT coefficient is often changed in a deterministic way, the distribution of these values is changed in such a way as well. The JPEG format by design attempts to minimize the value of many DC coefficients as possible during the quantization phase of the image conversion. This means that the histogram of all DCT values approximates a bell curve with a maximum at the DCT value of 0.
As mentioned before F5 skips all DCT coefficients with the values –1, 0 and 1. This is because when recovering the secret message the algorithm is unable to determine whether a DCT coefficient with the value 0 originates from coefficient with the original value 0 that was therefore skipped – or if it originates from a DCT coefficient value 1 or –1, which has been modified by the algorithm. However it is important to note, that in the case of F5 skipping means that the value is still changed to 0.
The consequence of F5-embedding is that with the exception of the values mentioned above, all remaining DCT coefficients will be uniformly raised, and lowered. However since both 1 and –1 values are changed to the single value 0 there is a noticeable peak in the number of DCT coefficients with the value 0. Jessica Fridrich et al. describe a way of attacking the F5 algorithm using this fact in [5].
To decide whether F5 has been applied to an image, it is evaluated with respect to the changes of the DCT coefficients and it is estimated how strong the deviation from the original image is. From this deviation, an estimate value β is determined which indicates the percentage of the DCT coefficients in the image which are presumably manipulated. Fridrich et al. state that the accuracy of the analysis depends strongly on how large the message was in proportion to the maximum capacity of the picture. Estimation values of more than 0.15 suggest an embedded message. From a β value of 0.2 the probability of an error is less than 10−8. However, this error increases rapidly with smaller embeddings. Smaller messages, which use less than 30% of the maximum capacity of the carrier image, can thus not be reliably detected [5].
2.5 Pooled Steganalysis
The concept of using more than one image for steganalysis is not new. Ker [7] has discussed it under the term ‘pooled steganalysis’. Similar to our approach, it takes an statistical approach to improve the detection of multiple sent stego covers. The main difference is the basic assumption: Ker distinguishes between channels sending either only stego or non-stego images. This so-called batch steganography aims to transport a high amount of message bits distributed over multiple images.
In a more recent work [2] Cogranne et al. discuss more complex concepts of batch steganography and pooled steganalysis. The batch steganography is seen as a model to distribute the embedding noise over a set of images.
2.6 Further Steganalysis
While F5 is a well-known but also dated algorithm, there are many other tuples of embedders and detectors. More recent approaches utilize machine learning concepts, like e.g. Chen et al. [1]. Nonetheless their work concludes with the statement that even with the help of machine learning, a reliable detection of stego images is far away. A recent publication by Lin et al. [8] shows combined error rates (false negative and false positive) of 25% to 40%. A work by Tsang [13] states error rates of as low as 13%, but also only provides a combined error rate.
Based on this overview, we conclude two items:
- The need for low false positive rates is not sufficiently discussed. It is often only a part of the overall error rate. This can become misleading: in most scenarios the vast majority of images will not be stego covers. A high false positive rate will lead to potentially higher error rates than evaluation sets where an even distribution of covers and stego covers is used.
- Current false positive rates are too high to be usable in realistic scenarios. Given the numbers of image usage above, an investigator would be flooded with false alarms when false positive rates are 10% and more.
3 Steganography in Digital Forensics
The relation between the message length and the detection probability is an important challenge in forensic analysis. In the scientific literature, most often detection performance is discussed under two assumptions:
- Full payload usage: The message hidden within the cover uses a large portion of the payload available.
- Equal distribution of covers and stego images: Detection rates are often given under the assumption that there is an equal chance that an image has been used for hiding a steganographic message.
Together both assumptions become very challenging for real-world steganalysis in a forensic scenario: given the task to determine whether steganography was used to secretly transmit some information, the investigator will often face a large collection of images either on a PC, a smart-phone or in a communication channel. It is unlikely that a large portion of the images has been used for hiding information. So if steganalysis produces a high false positive rate, the investigator will end up with alarms in any case examined.
And as the resolution of images taken by digital cameras steadily increases, the potential payload of the steganographic algorithm also grows. But if the transmitted messages stay of equal length, the used percentage of the payload decreases and hereby the detectability of the hidden information also decreases significantly.
3.1 Short Evaluation
This brief evaluation has two purposes: its primary aim is to provide some realistic detection and error rates when applying steganalysis of single images in a forensic scenario. We therefore have executed tests that hide very short as well as long messages typical for common steganographic research. We use a threshold of β = 0.125, a relatively low value with the aim to identify as many hidden messages as possible. The test set consists of 3 messages and 2 groups of images.
3.1.1 Cover
As cover images, we use two groups: “Small” consists of 100 randomly selected pictures from a larger collection already used for forensic research. These are relatively small images of 1 mega-pixel in average. “Large” consists of 50 photos made with a digital camera made on a vacation; average image size is 10 mega-pixel.
3.1.2 Message
As a short message, we use a name, a place and a date with time. This data is to simulate a information about a person to meet. It is called m1. The long version of this is called m4 and is created by repeating m1 four times.
Hans Mustermann, Fancy Hotel, 30.2.2017, 10:30
As a large message (called “text”) which is close to the average maximum of the small test images, we created a random message. The following is a small excerpt of the synthesized message1. The full text consists of 1755 characters including spaces.
[...]
Frankness applauded by supported ye household. Collected favourite now for for and rapturous repulsive consulted. An seems green be wrote again. She add what own only like. Tolerably we as extremity exquisite do commanded. Doubtful offended do entrance of landlord moreover is mistress in. Nay was appear entire ladies. Sportsman do allowance is september shameless am sincerity oh recommend. Gate tell man day that who.
[...]
3.1.3 Small image performance
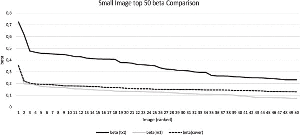
We start our evaluation with a comparison of the performance of F5 steganalysis with the small image set and all message types. The average payload of the images was 17,568 bit. In Figure 1 we show the top 50 beta values for all test runs. As one can see, covers with embedded messages m1 and m4 are indistinguishable for the algorithm and therefore for the investigator. Only the text message can be detected with good results. It was successfully embedded in 71 of the 100 images. Only 5 times the hidden message could not be detected. We also compared the improved F5 with to the original one. As assumed, it hides the text very well and shows similar performance as F5 with short messages.
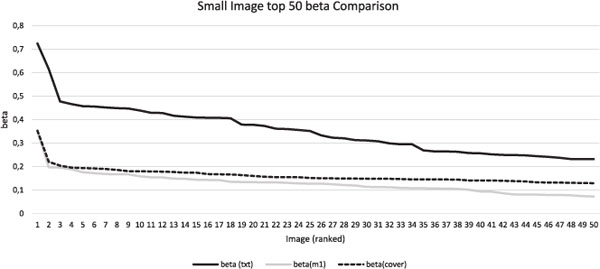
Figure 1 Steganalysis comparison for small images. Standard F5 produces siginficantly larger beta values than the other examples.
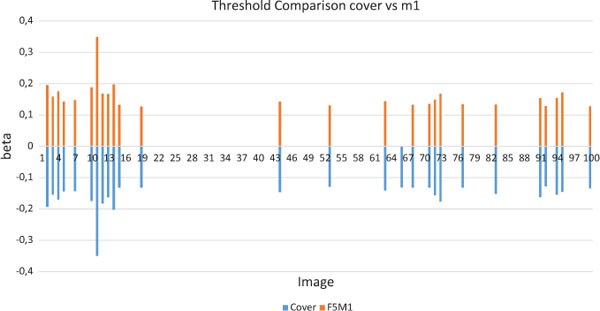
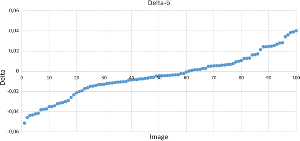
Figure 2 Beta value comparison of cover and F5 with m1 as payload. Only values over the threshold of 0.125 are shown.
So under the usual assumptions of steganalysis, the detector works well, but if only short message are transmitted, detections becomes very unreliable. In Figure 2 we illustrate this by comparing β values for cover and cover with hidden m1. For convenient graphical comparison, β was multiplied by –1 for the cover, so one should compare the absolute values without the sign. Only the values above the detection threshold are plotted. of As one can see, the performance of the detector is almost identical.
A more precise overview is given in confusion matrix 1. Predictions for both cases differ by only 1, there are 27 false positives and 74 false negatives. For a forensic examination, this is similar to guessing.
Another view on the results is given by Figure 3. Here we calculate β(m4) − β(cover) and plot the 100 values on a graph. One can see a similar distribution around the 0 axis, showing that β of the unmarked cover was roughly as often higher than after embedding as not. This also means that for m4 the situation for the investigator is similar to guessing.
Table 1 Confusion matrix for small images with m1 payload
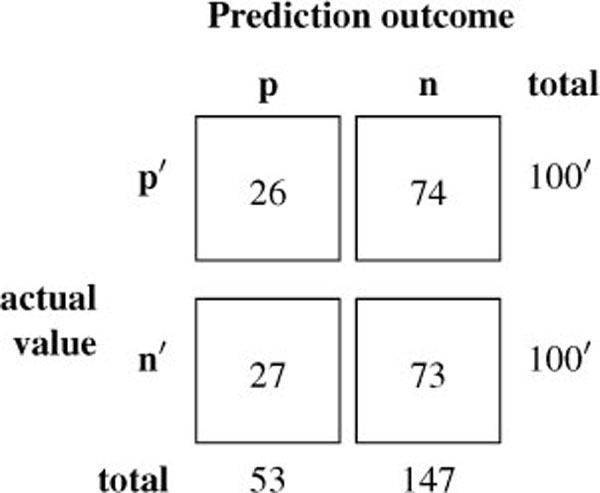
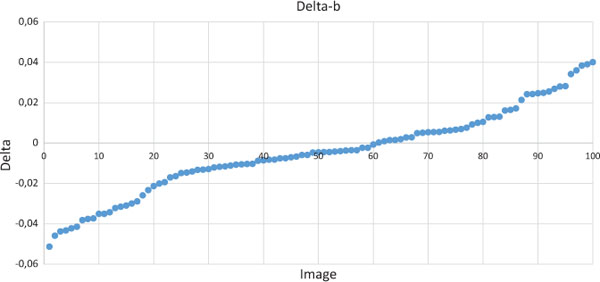
Figure 3 Difference of beta-value between cover and m4 payload.
3.1.4 Large image performance
Larger images also allow a larger payload. The average payload of the 50 images was 58,155 bit. This is not ten times more than the small images as could be expected. This can only be explained in different JPEG encoders producing significantly more coefficients with value 0 in the case of the larger images.
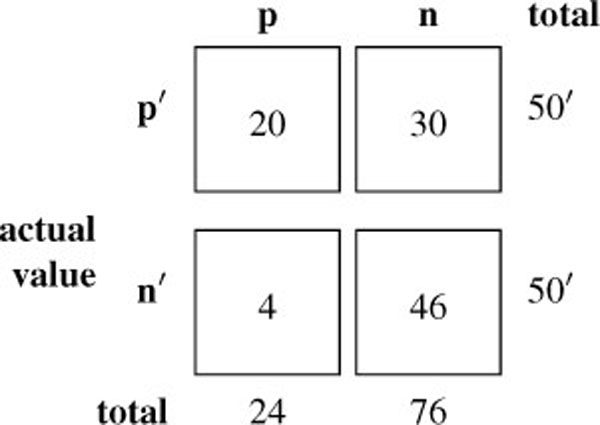
The confusion matrix 2 shows that detection the hidden text becomes harder due to the larger payload. Only 20 of 50 stego covers were detected. The false positive rate was also low, only in 4 of also 50 originals hidden messages were falsely assumed to be present.
Table 2 Confusion matrix for large images with text payload
3.1.5 Discussion
Our evaluation basically shows to facts: Steganalysis of F5 works well within the defined parameters given in the literature where a high payload is assumed. But it also is obvious that it is not possible to reliably decide whether F5 has been used if the embedded information is small in comparison to the available payload. This means that transmitting messages comparable to a tweet on Twitter can be done without detection. An increasing amount of images transmitted via various channels as well as a constant growth of image resolutions makes the situation even more challenging.
Detecting a short message in an image with size one mega-pixel only works in roughly 25% of the cases, 75% are false negative. The false positive rate is also roughly 25%. This is even more problematic as negative examples should be much more common. If there is a set of 1,000 images where one image is a stego image and the rest are innocent covers, the investigator only has a one in four chance to find the image but will have approximately 250 false positives to deal with.
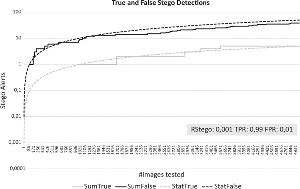
To analyze this problem further, we discuss a few scenarios where steganalysis is performed. We describe these scenarios by Rstego and the performance of the detector in TPR and FPR. First we have a look at an fictional almost perfect detector with TPR 99% and FPR 1%. We assume a Rstego of 0.1; one in a thousand images is a stego image. Figure 4 shows the performance of the detector. We plotted how many false and true alarms will be raised with an increasing number of images. The statistical model and one random example are shown. When the first true alarm is raised, already 9 false alarms can be expected even with this almost perfect detector due to the low likelihood of a stego occurrence.
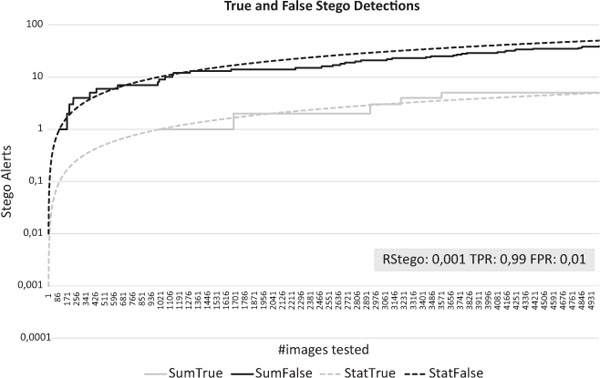
Figure 4 Ideal detector and Rstego 0.1%.
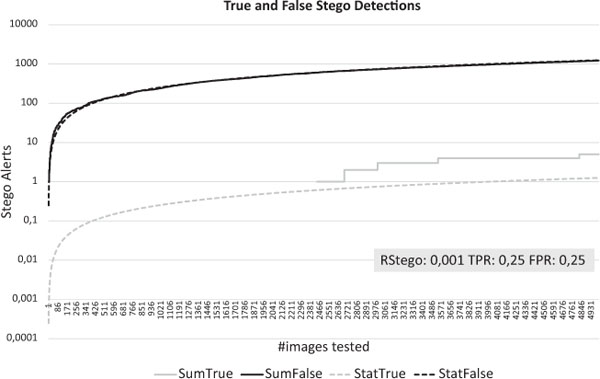
Figure 5 Example detector and Rstego 0.1%.
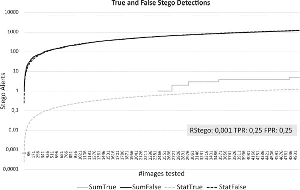
In Figure 5 we repeat the simulation with the detector performing as discussed above; 25% for both TPR and FPR. Now an investigator would experience 999 false alarms before the first true alarm would occur. In other words: only one alarm in a thousand would be a correct detection of a stego image.
4 Improved F5 Steganalysis
We have shown that the basic F5 attack suffers from high error rates when not applied under optimal conditions. Performance is good if the stego message uses a huge proportion of the image capacity. As soon as the used capacity drops to a fracture of its full amount, detection becomes virtually impossible.
To address this challenge, we have developed two new steganalyis approaches for F5 with specific characteristics making them suitable for channel forensics. As the focus of this work is the channel analysis, we discuss them only briefly.
4.1 Double Embedding
The Double Embedding Attack [12] leverages the distinct change in the beta value when a payload is embedded multiple times into the same image. While the number of marked images that this attack is able to detect varies depending on the size of the original payload, it produces significantly fewer false positives than the Basic Attack and does not require the calculation of a detection threshold due to the upper bound for the beta value of sinlge-stego images.
The approach is centered around the statistical changes that occur when a secret message is embedded into the same image multiple times. With F5 the distribution of the values of the DCT coefficients change when embedding a sufficiently long message. We assume a JPEG quality Q: 75 and an average capacity usage of Capused: 0.93. When a message is embedded into a randomly selected sample image multiple times, the number of DCT coefficients with the value 0 increases, as every iteration lowers the values of the positive and raises the value of the negative coefficients. This effect can be maximized by using as much of the image message capacity as possible.
Based on this behavior one can design a detector as unmarked and marked images on the average show a significantly different behavior regarding the resulting distribution of DCT values. A fixed threshold can be used to distinguish marked and unmarked images. In our experiments, with a threshold of 0.5 a false positive rate of 0.013 and a false negative rate of 0.378 can be achieved. Adjusting the threshold allows to move either in the direction of more false positives or false negatives.
4.2 Capacity Estimation
The Capacity Estimation Attack [4] on the other hand utilizes the way in which the relation between the file size of an image and its available payload capacity changes when a F5 message has been embedded. Depending on the used image resolution and JPEG quality, this attack strongly reduces the number of false negatives as there is a very distinct change in the distribution of these values.
We have seen in both former attack that the message capacity is the biggest factor for the success of the stego detection. The foundation of the Capacity Estimation attack is the way this relation changes when a secret message is embedded into an image using the F5 algorithm. We built an estimator for the capacity of both stego and non-stego images based on image size and collected data. Then we run a test comparing the actual capacity with both estimators.
The attack behaves differently than the Double Embedding Attack. Depending on image size and JPEG quality, a false negative rate of below 1% can be achieved for e.g. image of size 1080 × 1080 and quality below 60. The false positive rate on the other hand is worse than the Double Embedding Attack: for the same examples, it is almost 30%.
The results produced by both of these attacks allow us to propose a detection method for F5 images that can perform well under realistic conditions while using simple steganographic and statistical tools and methods.
5 Channel Detection
In this section we address steganalysis of communication channels rather than the classification of individual images.
We define an image channel as a unidirectional communication link between an image source and one or several image destinations. In social networks there are typically two distinct types of image channels:
- 1:1 channels in which images are sent from Alice to Bob via direct message,
- 1 : N channels in which Alice posts images on her timeline for one or several people to see.
The detection of hidden channels poses a very different problem since the larger scale of this scenario means that simply detecting a single stego image in a given channel does not suffice in order to achieve the required level of detection quality and confidence in our results.
Table 3 F5 Detection Algorithm Comparison
| Attack | |||
|---|---|---|---|
| Basic | Double Embedding | Capacity Estimation | |
| Utilised Message Capacity | Capused ≥ 0.6 | Capused ≥ 0.3 | Capused ≥ 0.1 |
| Image Set Size | All |img| | All |img| | All |img| |
| Image Resolution | All Res | All Res | Res ≤ 1620 × 1620 px |
| JPEG Quality | Q ≥ 0.75 | All Q | Q ≤ 0.8 |
| Normal-To-Stego Ratio | 0.25 ≤ Rstego ≤ 0.75 | All Rstego | All Rstego |
| False Positives | medium | low | medium |
| False Negatives | medium | medium | low |
| Detection Success | medium | low | high |
| Computational Effort | medium | high | medium |
The obvious question that we need to answer is which attack is best suited for this problem. Table 3 provides a side-by-side comparison of the most important characteristics of all three attacks that we have evaluated.
We see that while both the Double Embedding and the Capacity Estimation Attack outperform the Basic Attack, neither of these two attacks manages to outperform the other for every scenario. We therefore need to decide on an attack depending on the individual use case.
5.1 Experimental Design
As an example for an image-centric social media channel we use Instagram. Since the internal workings of Instagram itself are closed we need to first make a few key assumptions and definitions.
- For our evaluation we assume that unknown developers were able to reverse engineer the mobile phone app of the popular photo sharing platform Instagram. The App has then been modified to enable the user to embed secret F5 messages into the images before they are uploaded.
- We further assume that the F5 embedding process takes place after the image has been scaled and JPEG compressed using Instragram’s current resolution Res: 1080 × 1080 px and the JPEG quality setting Q: 75.
- The modified app is then made available to others on various third party websites.
Table 4 Use Case Summary
| Network Wide Monitoring | Targeted Monitoring | |||
|---|---|---|---|---|
| Best Case | Worst Case | Best Case | Worst Case | |
| Channels | all | all | selected channels | selected channels |
| Focus | low FP | low FP | low FN | low FN |
| Capused | ≥ 0.9 | 0.3 | 0.3 | 0.1 |
| Res | 1080 × 1080 px | 1080 × 1080 px | 1080 × 1080 px | 1080 × 1080 px |
| |img| | 95 000 000 | 95 000 000 | 100 | 100 |
One note about the images used in this experiment: we did not use the common image sets used for stenography and steganalysis due to their limitations. They are often of unrealistic small resolution and in some cases only gray-scale. In our experiment we wanted to use images as typical for social media distribution as possible. Therefore we downloaded 1000 unmanipulated camera images from the website Digital Photography Review and downscaled them to our desired resolution. This also ensures a minimum of additional artifacts of e.g. multiple JPEG compression.
5.2 Problem Set
In the following sections we will elaborate and evaluate two conceivable problem sets that arise from this scenario. The assumptions made in these use cases and are summarized in Table 4.
6 Network Wide Monitoring
The first possible scenario for channel detection in a social network is what we will refer to as Network Wide Monitoring. In this use case the provider of the social network has become aware that a growing number of users are using the modified version of its App as described previously in this section to communicate covertly, thus violating the network’s terms of service. Since he is unable to control the software on the user side he wants to implement a logic on its upload servers which allows the provider to detect and suspend accounts if the user is deemed to be using the modified App to upload stego images.
If we apply the current Instagram statistics of approximately 500 million daily active users and 95 million daily image uploads to this use case it becomes very clear that in order to continue to provide a disruption-free user experience to legitimate users the chosen F5 classification approach must be able to provide a very low false positive rate. For this scenario we will assume that this highest tolerable false positive value is approximately one false alarm per day.
Looking again at Table 3 we see that the Double Embedding Attack is best suited for this scenario. We know from our analysis of the Double Embedding Attack that the most important factor which needs to be taken into consideration is the degree to which the message capacity is being used.
For our evaluation this means we have to consider both:
- the best case with Capused ≥ 0.9,
- the worst case with Capused: 0.3 .
Table 5 shows the result of the evaluation of the best case. Since we can assume that classifying multiple images falsely as stego or non-stego image is a series of independent events the probability of them occurring together is the product of the individual probabilities.
In this use case we therefore need to determine how many images need to be classified as stego image in a given image channel in order to achieve a high enough degree of certainty in the result.
We observe that in our case requiring at least four stego detections in a given channel allows us to make a reasonable assumption about the image channel without causing an excessive amount of false alarms on the side of the network operator. Now that we established how many images we need to detect we also want to evaluate how many images need to be sampled for this detection approach. This number depends on two additional variables:
- the normal-to-stego image ratio Rstego,
- the false negative rate of the detection approach.
Table 5 False Positive Rate using Double Embedding Attack with Capused: 0.93
| Threshold | False Positive Rate | False Positives/day |
|---|---|---|
| 1 Positive | 0.0039011703511 | 370611.1834 |
| 2 Positives | 0.0000152191301 | 1445.82 |
| 3 Positives | 0.0000000593724 | 5.64 |
| 4 Positives | 0.0000000002316 | 0.022 |
| 5 Positives | 0.0000000000009 | 0.00008584 |
The suspected normal-to-stego image ratio Rstego of a channel is obviously unknown in a real-world scenario which means that in our use-case the operator of the social network needs to make a reasonable and informed estimation.
We further know from our analysis that under the circumstances described in the best case the Double Embedding Attack is able to detect approximately 93% of all stego images. As a result we also have to accommodate this value when trying to determine the minimum number of sample images |img|.
In order to compensate for the false negatives we must increase the number of required stego images |imgstego| by approximately 7%. Since the priority of this use case is achieving the highst possible detection quality we chose to always calculate the ceiling value of this operation:
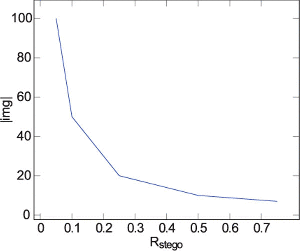
From the results in Figure 6, we observe that in this scenario we are able to make a reliable decision on the image channel after having sampled between 100 and 10 images for a given channel, depending on the chosen value of Rstego.
For the worst case we repeat our evaluation with Capused: 0.3. We know from our evaluation of the Double Embedding Attack that, while it generally provides a low flase positive rate, the number of successfully detected stego images decreases sharply for Capused < 0.5.
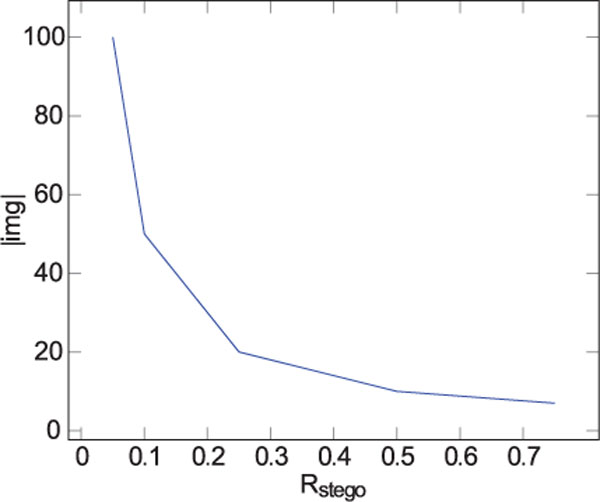
Figure 6 Required Sample Images using Double Embedding Attack with Capused 0.93s.
Table 6 False Positive Rate using Double Embedding Attack with Capused: 0.3
| Threshold | False Positive Rate | False Positives/day |
|---|---|---|
| 1 Positive | 0.1304347826 | 12391304.3478 |
| 2 Positives | 0.0170132325 | 1616257.0888 |
| ⋮ | ⋮ | ⋮ |
| 9 Positives | 0.0000000109 | 1.0382 |
| 10 Positives | 0.0000000014 | 0.1354 |
We start by evaluating how many images need to be tested positive in a given image channel in order to achieve a low enough false positive rate. This is shown in Table 6.
Since we know that for Capused: 0.3 the chance of detecting a stego image is only approximately 2.44% we need to drastically increase the number of stego images which are classified to as much as:
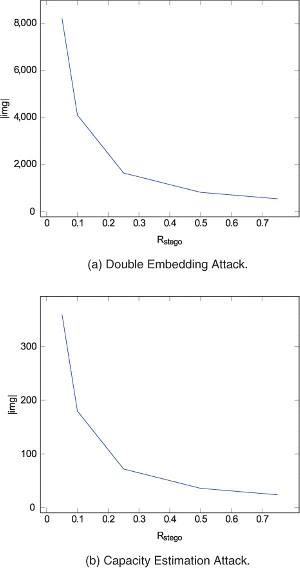
In Figure 7 (a) we can see that depending on Rstego the network provider has to classify between 548 and 8220 images in order to achieve the required false positive value.
This is a significant increase in |img| over the best-case scenario and one could argue that even under ideal conditions, where more then 50% of all images are marked with a F5 message, a network operator might not be able to collect such many images for a single image channel within a reasonable time-frame. Since we know that the main reason for this high number of the required |img| is the low detection rate of the Double Embedding Attack we need to evaluate if a attack like the Capacity Estimation Attack, which features a high detection rate, but also a moderate false positive rate is able to perform better under these circumstances.
Table 7 shows that in order to achieve the required false positive number the Capacity Estimation Attack requires to detect 16 stego images in order to correctly classify an image channel, a 60% increase over the Double Embedding Attack.
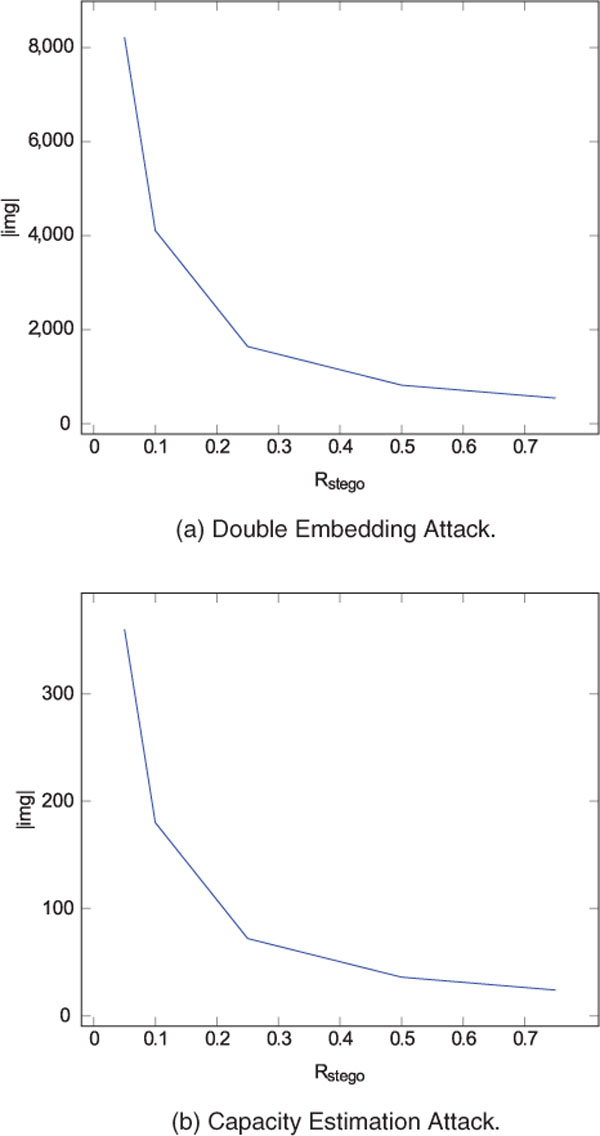
Figure 7 Required Sample Images with Capused 0.3.
However, since we know that the detection rate of the Capacity Estimation Attack is 99.88%, the number of required stego images for a channel classification is only approximately:
Table 7 False Positive Rate using Capacity Estimation Attack with Capused: 0.3
| Threshold | False Positive Rate | False Positives/day |
|---|---|---|
| 1 Positive | 0.306846999 | 29150464.9197 |
| 2 Positives | 0.094155081 | 8944732.6846 |
| ⋮ | ⋮ | ⋮ |
| 15 Positives | 0.000000020 | 1.9123 |
| 16 Positives | 0.000000006 | 0.5868 |
This results in a maximum value of |img|: 360 images that are needed by the Capacity Estimation Attack, assuming a Rstego ≥ 0.05. This is shown in Figure 7 (b).
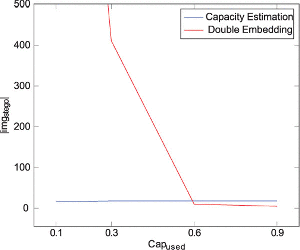
This finding contradicts our original assumption, that the Double Embedding Attack always outperforms the Capacity Embedding Attack in this scenario, based on its low false positive rate. As a result we need to re-evaluate this decision. In order to do so we assume a worst-case setting of Rstego: 0.1, which means that on average 1 in 10 images are marked with a F5 message. We then determine how the number of required stego images |imgstego| and thus |img| changes as we lower the value of Capused.
Figure 8 shows the result of this comparison. We observe that the Capacity Estimation Attack requires significantly fewer images for Capused ≤ 0.6 and only slightly more images for Capused > 0.6 in order to classify a image channel with a high degree of certainty.
It would be unrealistic to assume that a criminal will always attempt to secretly transfer as much data as possible. This in return means that the Capacity Estimation Attack should be given preference in this scenario.
The Capacity Estimation Attack further provides the advantage, that it requires less computation time as it does not need to perform the 2nd embedding operation, which requires the decoding and re-encoding of the complete JPEG image. Considering the image resolution in this scenario this benefit outweighs the additional stego images required for Capused > 0.6.
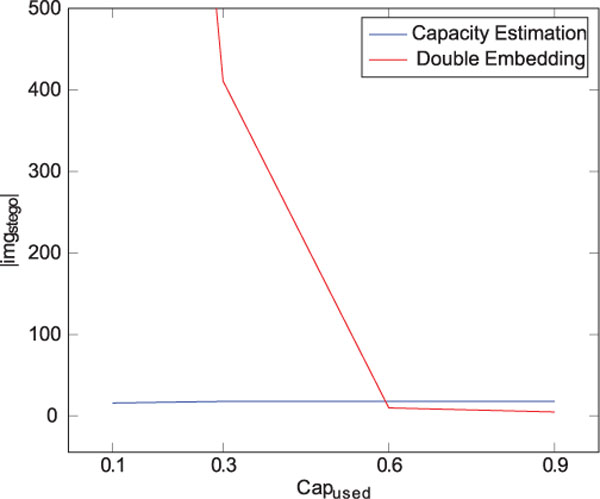
Figure 8 Channel detection comparison with Rstego 0.1.
7 Targeted Monitoring
The second scenario that we are going to analyze is Targeted Monitoring. In this scenario we assume that during the course of an investigation law enforcement was able to identify a certain number of suspicious social media accounts. It is suspected that these accounts use the modified version of the App, as described in Section 5, to secretly conspire to break the law.
For a F5 detection approach this means that it does not need to scale to the degree that is required in Network Wide Monitoring. It does however pose stricter contraints on the degree of false negatives that can be tolerated. It also means that we must assume that only a limited number of images are available for every monitored message channel.
Looking again at Table 3 and our results from the Network Wide Monitoring scenario we can see that the ideal attack for this scenario is the Capacity Estimation Attack, as it features a significantly lower false negative rate. For this evaluation we will assume that each image channel provides up to |img|: 100 images. We will also assume that in order to conceal their secret communication the suspects only use a fraction of the available message capacity (Capused ≤ 0.3) and further only use 10% of the posted images for comunication (Rstego ≤ 0.1).
Table 8 False Positive Rate using Capacity Estimation Attack with Capused: 0.3
| Threshold | False Positive Rate | False Positives/100 images |
|---|---|---|
| 1 Positive | 0.306846999 | 30.6847 |
| ⋮ | ⋮ | ⋮ |
| 4 Positives | 0.008865179 | 0.8865 |
| 5 Positives | 0.002720254 | 0.2720 |
| 6 Positives | 0.000834702 | 0.0835 |
Since we know that Capused is a critical parameter in the image detection we again need to distinguish between two cases:
- the best case with Capused: 0.3,
- the worst case with Capused: 0.1.
For the best case we analyze the payload usage Capused: 0.3. We see in Table 8 that this use case requires at least five detected stego images in order to achieve the required false positive rate (one false alarm in 100 images) when classifying the channel.
We know from our analysis of the Capacity Estimation Attack that the achieved detection success rate for the given parameters (Capused: 0.3, Res:1080 × 1080 px, Q: 75) is approximately 99.88%. We therfore calculate the final value for the number of stego images that need to be present as:
This means that given the channel size of |img|: 100 and Rstego: 0.1 we need to classify 6 out of 10 stego images correctly in order to achieve the required degree of certainty of the channel classification. In oder to further quantify this certainty we need to evaluate the probability of the Capacity Estimation Attack missing at least 5 out of 10 stego images and thus not detecting the communication in the image channel. The results of this analysis is listed in Table 9.
We can see that using the image parameters described above it is extremely unlikely that our attack should miss more then 2 stego images, which means that the Capacity Estimation Attack is able to detect the vast majority of all image channels with a high degree of certainty.
Table 9 False Negative Rate using the Capacity Estimation Attack with Capused: 0.3
| False Negatives | False Negative Rate | Occurrence/100 images |
|---|---|---|
| 1 | 0.00162074554295 | 0.162074554295 |
| 2 | 0.00000262681611 | 0.000262681611 |
| 3 | 0.00000000425740 | 0.000000425740 |
| 4 | 0.00000000000690 | 0.000000000690 |
| 5 | 0.00000000000001 | 0.000000000001 |
Table 10 False Positive Rate using the Capacity Estimation Attack with, Capused: 0.1
| Threshold | False Positive Rate | False Positives/100 images |
|---|---|---|
| 1 Positive | 0.306587838 | 30,6588 |
| ⋮ | ⋮ | ⋮ |
| 4 Positives | 0.008835267 | 0.8835 |
| 5 Positives | 0.002708785 | 0.2709 |
| 6 Positives | 0.000830481 | 0.0830 |
We know that the Capacity Estimation Attack did not produce any false negatives for Capused: 0.1. This means that for this value we will only look at the false positive rate. It also means, that we do not need to correct the number of stego images needed, as is the case in the worst case of Network Wide Monitoring.
The results in Table 10 show that we need to detect at least |imgstego|: 5 images in order to provide the desired detection quality. At Rstego: 0.1 this means we need to sample |img| ≥ 50 images. This implies that even in the described worst case we are able to successfully detect the secret communication in the image channel with the required high degree of certainty if we can sample |img|: 100 images.
8 Conclusion
Our contribution in this paper is twofold. First we show how challenging steganalysis based on single images is when applied in real-world scenarios. The limited usage of available capacity in a stego image makes steganalysis less reliable than discussed in the literature. The varying nature of images with respect to frequency distribution and composition causes high variance in error rates. The low probability that images are actually stego covers lead to a higher likelihood of stego detections to be false positives than true positives. Then we briefly introduce two novel steganalytic methods and use them in channel detection, where not single images, but the occurrence of multiple detections is the base for stego alarms.
Our results show that in a social media environment, in which we can assume a given minimum number of images per channel, the detection of secret channels vastly outperforms the detection of individual images as we are able to leverage additional probabilistic methods on top of the existing attack to further reduce both the false positive and negative rate to the required level. This finding applies to both evaluated scenarios: Targeted Monitoring in which only a selected number of suspicious channels are under surveillance as well as Network Wide Monitoring in which every channel in the network is monitored.
In the case of the Network Wide Monitoring we show that a reliable decision on the image channel can be made after a mix containing 18 stego images has been classified using the Capacity Estimation Attack if we can assume that at least 30% of the available message capacity is being utilized by the payload. For Targeted Monitoring we further show that if we evaluate an image channel containing 100 images, of which every tenth image contains a F5 payload, we are able to classify the channel correctly with a false positive rate of 0.0027 and a false negative rate FN of 10−14, thus vastly outperforming any classification approach that is based on attacking individual images. This is the case even if only approximately 10% of the available message capacity of the cover image is being used for the F5 message.
The attacks proposed here are of course directly aimed at a particular steganographic algorithm. Further research needs to be conducted in order to evaluate which of the attack vectors used in the Double Embedding Attack and Capacity Estimation Attack can be used on a more abstract level in order to create a more generalized detection methodology for LSB steganography in JPEG images.
Acknowledgment
This work has been funded by the German Federal Ministry of Education and Research (BMBF) in the Fraunhofer Cybersecurity Training Lab (LLCS).
References
[1] Mo Chen, Vahid Sedighi, Mehdi Boroumand, and Jessica Fridrich. Jpeg-phase-aware convolutional neural network for steganalysis of jpeg images. In Proceedings of the 5th ACM Workshop on Information Hiding and Multimedia Security, pages 75–84. ACM, 2017.
[2] Rémi Cogranne, Vahid Sedighi, and Jessica Fridrich. Practical strategies for content-adaptive batch steganography and pooled steganalysis. In Acoustics, Speech and Signal Processing (ICASSP), 2017 IEEE International Conference on, pages 2122–2126. IEEE, 2017.
[3] Ron Crandall. Some notes on steganography. In Posted on Steganogra- phy Mailing List, online: http://dde.binghamton.edu/download/Crandall matrix.pdf, (accessed Feb. 2018).
[4] Andre Ester. Steganalysis of communication channels in social networks. Master’s thesis, TU Darmstadt, Germany, 2018.
[5] Jessica J. Fridrich, Miroslav Goljan, and Dorin Hogea. Steganalysis of JPEG Images: Breaking the F5 Algorithm. Springer-Verlag, London, UK, online: http://www.ws.binghamton.edu/fridrich/Research/f5.pdf, (accessed Oct. 2017).
[6] Tom Kellen. Hiding in Plain View: Could Steganography be a Terrorist Tool? SANS Institute, online: https://www.sans.org/reading-room/whitepapers/stenganography/hiding-plain-view-steganography-terrorist-tool-551, (accessed Sept. 2017).
[7] Andrew D Ker. Batch steganography and pooled steganalysis. In International Workshop on Information Hiding, pages 265–281. Springer, 2006.
[8] Li Lin, Jennifer Newman, Stephanie Reinders, Yong Guan, and Min Wu. Domain adaptation in steganalysis for the spatial domain. Electronic Imaging, 2018(7), 2018.
[9] Declan McCullagh. Bin Laden: Steganography Master? Wired Magazine, online: https://www.wired.com/2001/02/bin-laden-steganography-master, (accessed Sept. 2017).
[10] Noah Shachtman. FBI: Spies HID Secret Messages on Public Websites. Wired Magazine, online: https://www.wired.com/2010/06/alleged-spies-hid-secret-messages-on-public-websites, (accessed Sept. 2017).
[11] Martin Steinebach, Andre Ester, and Huajian Liu. Channel steganalysis. In Proceedings of the 13th International Conference on Availability, Reliability and Security, ARES 2018, pages 9:1–9:8, New York, NY, USA, 2018. ACM.
[12] Martin Steinebach, Andre Ester, Huajian Liu, and Sascha Zmudzinski. Double embedding steganalysis: Steganalysis with low false positive rates. In MPS ’18: Proceedings of the 2nd International Workshop on Multimedia Privacy and Security, CCS 2018, New York, NY, USA, 2018. ACM.
[13] Clement Fuji Tsang and Jessica Fridrich. Steganalyzing images of arbitrary size with cnns. Electronic Imaging, 2018(7), 2018.
[14] Andreas Westfeld. F5 – a steganographic algorithm. In Moskowitz I.S. (eds) Information Hiding. IH 2001. Lecture Notes in Computer Science, volume 2137, pages 289–302. Springer-Verlag, London, UK.
Biographies

Martin Steinebach is the manager of the Media Security and IT Forensics division at Fraunhofer SIT. From 2003 to 2007 he was the manager of the Media Security in IT division at Fraunhofer IPSI. He studied computer science at the Technical University of Darmstadt and finished his diploma thesis on copyright protection for digital audio in 1999. In 2003 he received his PhD at the Technical University of Darmstadt for this work on digital audio watermarking. In 2016 he became honorary professor at the TU Darmstadt. He gives lectures on Multimedia Security as well as Civil Security. He is Principle Investigator at CRISP and represents IT Forensics and Big Data Security. Before he was Principle Investigator at CASED with the topics Multimedia Security and IT Forensics. In 2012 his work on robust image hashing for detection of child pornography reached the second rank Deutscher IT Sicherheitspreis, an award funded by Host Görtz.
Huajian Liu received his B.S. and M.S. degrees in electronic engineering from Dalian University of Technology, China, in 1999 and 2002, respectively, and his Ph.D. degree in computer science from Technical University Darmstadt, Germany, in 2008. He is currently a senior research scientist at Fraunhofer Institute for Secure Information Technology (SIT). His major research interests include information security, digital watermarking, robust hashing and digital forensics.
Journal of Cyber Security and Mobility, Vol. 8_3, 365–392.
doi: 10.13052/jcsm2245-1439.834
This is an Open Access publication. © 2019 the Author(s). All rights reserved.
1 http://randomtextgenerator.com