Classifying Agricultural Crop Pest Data Using Hadoop MapReduce Based C5.0 Algorithm
R. Revathy1, S. Balamurali1’* and R. Lawrance2
1Department of Computer Applications, Kalasalingam University, Krishnankoil-626126, Tamil Nadu, India
2Department of Computer Applications, Ayya Nadar Janaki Ammal College, Sivakasi-626124, Tamil Nadu, India
E-mail: sbmurali@rediffmail.com; lawrancer@yahoo.com
*Corresponding Author
Received 04 January 2018; Accepted 04 June 2018;
Publication 02 April 2019
Abstract
Data mining is a methodology of exploring and processing large pre-existing databases in order to find the hidden information. In agriculture sector, data mining can help farmers to develop yield. Crops can be protected from vertebrate pests and diseases by predicting and enhancing crop cultivation through efficient data mining methods. The main aim of this research is to classify agricultural crop pests which are categorized by different colours. This research includes data cleaning, feature selection and execution of C5.0 algorithm using map reduce. Data cleaning has taken away the noisy data in crop pest data that offers improved accuracy. In feature selection, Relief filter is applied for selecting particular attributes of the crop pest data set instead of using full attribute set. It performs choosing attributes by calculating the attribute weights based upon distances. As the size of the pest dataset has attained terabyte range, typical data mining techniques cannot process the big data at logical time. Hadoop MapReduce programming model has been put into practice to compact with huge data set. It is a software framework for distributed processing of large amount of data. This research work proposed MapReduce implementation of C5.0 decision tree algorithm that gives more accurate result rapidly and holding less memory of huge crop pest data set.
Keywords: Data Mining, Data cleaning, Relief feature selector, MapReduce based C5.0 Classification.
1 Introduction
Currently the data accumulated in a database and which is used for application is vast. This likely to explode development in data and database has produced a significant requirement for new procedures that can cleverly transform the processed data into valuable knowledge. Therefore, data mining has become an essential field of research with rising importance. It is the technique of finding out new correlations, interesting patterns, and mining into huge amount of data stored in large databases [7].
Agriculture plays a crucial role in the existence of an economy. It is the backbone of Indian profitable system. The crop yield is primarily depends upon climatic conditions, rainfall, pests, diseases, etc. Farmers not only harvesting crops but also harvesting vast amount of data. As data mining in agriculture is a novel research field, it has been used to explore agricultural dataset in order to classify the crop pests. The key purpose of the work is to classify the crop pest data into three classes, affected crops, safe crops and protectable crops which is recognized as Yellow, White and Green colors.
2 Literature Survey
Jinubala, V., et al. [1] discussed the analysis of missing data and imputation on agriculture data using multiple mean matching methods. The linear regression models were used to find the missing values and impute the missing values in the agriculture data set. The predictive mean matching method was also used for imputing the missing values for continuous variables as well as it implicates a value randomly from a set of experimental values whose predicted values are neighboring to the predicted value for the missing value. Rosario, F, S., et al. [2] observed that Relief feature selection algorithm efficiently selected the relevant attributes in data set that helped to improve the efficiency of the classification algorithms. It used the Monte Carlo Approaches for selecting instances randomly for calculating attribute weights.
In [3] different decision tree algorithms like CHID, ID3, C4.5 and C5.0 algorithms are compared. C5.0 handled continuous and categorical, dates, time, timestamps data which can be applied in big data set. The speed was high and holds less memory. It used pre-pruning to eliminate unwanted branches in the decision tree. It supported boosting and could deal with missing values. C5.0 is easily handled the multi value attribute and missing attribute from data set. Revathi, P., et al. [14] classified the rice diseases depending upon the symptoms and implemented using Radial Basis Function (RBF), polynomial and sigmoid kernel function. It proved that the SVM method based on RBF kernel function had given the excellent performance for disease classification.
Yang, T., et al. [4] implemented C4.5 decision tree algorithm with Hadoop MapReduce computing engine and HDFS file system compact to large input problem size. When decision tree algorithm with Hadoop’s MapReduce is on process, rules for the condition of the virtual cluster performs mapper and reducer functions. Dai, W., et al. [5] introduced MapReduce based C4.5 for parallel processing. Map function transforms the instance into attribute table as key, and class label as values. Reduce function will merge all instances with associated class labels which are stored in the count table. Finally, the nodes are generated to construct the efficient C4.5 decision tree. In [9], C4.5 and Maximum Similarity Tree (MST) algorithms using MapReduce are discussed. Here, the entropy of each attribute was computed in C4.5 classifier whereas in MST, the similarity of each attribute was computed. The attribute with highest information gain was chosen and added to the decision tree in C4.5. But in MST, the attribute with the highest similarity was chosen and added. For this reason, parallel MST classifier offered good performance than C4.5 classifier.
The above surveyed papers concern data cleaning, different feature selection methods and comparison of classification methods in order to predict the crop pests. Among various classification methods C5.0 produces the finest classification except it cannot handle very large agricultural datasets with improved accuracy. Hence, the proposed method uses C5.0 classification with MapReduce to enhance the efficiency, time and accuracy of the classifier.
3 Dataset Description
Agriculture database is a storehouse, containing crop pest data. This dataset contains various attributes that are listed in the following Table 1.
Pest data are quantitative and many of the attributes contain numerical values. The significant attributes are selected by using feature selection. The MapReduce based C5.0 decision tree is used to classify the pests according to its average value.
Table 1 Attributes in crop pest dataset
| No. | Attribute Name | Value |
|---|---|---|
| 1 2 3 4 5 6 7 8 9 10 11 12 13 |
District Taluk Village Field Type Date of Observation Avg_SpoEggMass Avg_SpoGregLar Avg_SpoSolLar Avg_semilooper Avg_harmigera Avg_GD_damaged RAverage ETL Color Code |
Categorical Categorical Categorical Categorical Categorical Continuous Continuous Continuous Continuous Continuous Continuous Continuous Categorical |
The work flow of entire research is commonly divided into three phases such as Data preprocessing, MapReduce based C5.0 Classification and Accuracy prediction. Figure 1 shows the working process of the proposed system.
4 Data Preprocessing
4.1 Data Cleaning
Unwanted data can cause uncertainty for the mining process, resulting in unreliable output. In this research some of the unnecessary crop pest data have been wiped out in data cleaning practice [1]. The crop pest data incorporate unwanted values that are shown in Table 2.
All data in a row with zero values could be eliminated in crop pest dataset since it proves the absence of pest. The unwanted crop pest data have been removed by using data filtered method technically. After cleaning of data, the size of data set is reduced to 2,97,519 from 3,62,519. Thus, it improves the quality of the dataset which is recognized in terms of accuracy and efficiency of C5.0 decision tree [17]. The unwanted data in crop pest data are eliminated that are shown in Table 3.
4.2 Feature Selection
Feature selection is a method that is used for reducing the attribute space of a feature set. Additionally, it is recognizing a subset of features by eradicating unrelated or redundant features. Before classifying data, irrelevant attributes need to be filtered for getting better efficiency of the classification algorithms and make it to classify precisely. In this research relief feature selector has been selected for filtering the attributes of crop pest dataset [6].
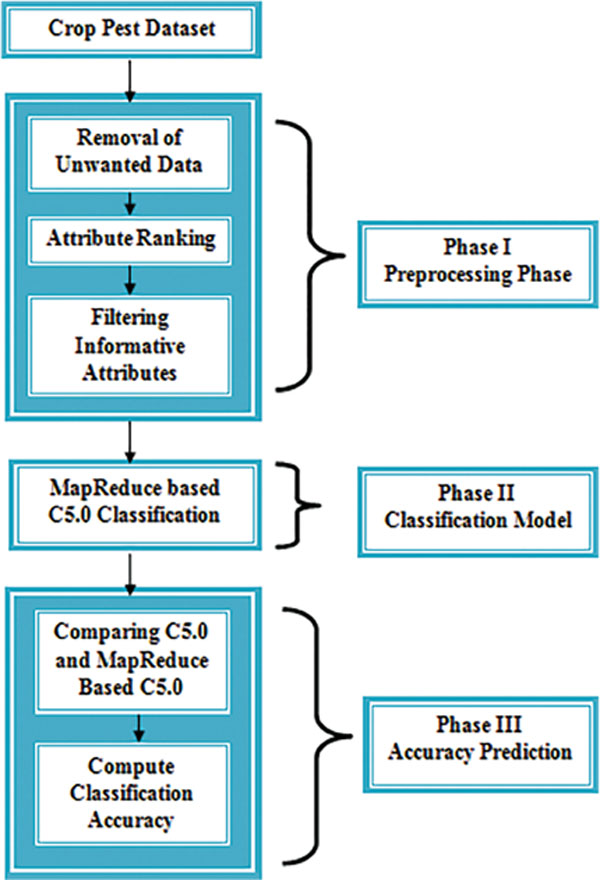
Figure 1 Working process of Crop pest Classification.
Relief filter algorithm estimates weights of continuous and discrete attributes depending upon a distance between instances. Relief Filter method gives the average weight of each feature. It was first illustrated by Kira and Rendell in 1992 [2], which is easy, quick, and efficient method for weighing attributes. The output weight of the Relief algorithm ranges between −1 and 1 for each attribute.
Table 2 Crop Pest Data incorporate unwanted values
| Avg_SpoEggMass | Avg_SpoGregLar | Avg_SpoSolLar | Avg_semilooper | Avg_harmigera | Avg_GD damaged | Average |
|---|---|---|---|---|---|---|
| 0 | 0 | 0 | 0 | 0 | 0 | 0 |
| 0.4 | 0 | 0 | 0 | 0 | 0 | 0.06 |
| 0.4 | 0 | 0 | 0 | 0 | 0 | 0.06 |
| 0.6 | 0 | 0 | 0 | 0 | 0 | 0.1 |
| 0 | 0 | 0 | 0 | 0 | 0 | 0 |
| 0 | 0 | 0 | 0 | 0 | 0 | 0 |
| 0.2 | 0 | 0.2 | 0.2 | 0 | 0 | 0.1 |
| 0 | 0 | 0.2 | 0.4 | 0.2 | 0.2 | 0.17 |
| 0 | 0 | 0 | 0 | 0 | 0 | 0 |
| 0 | 0 | 0 | 0.2 | 0.4 | 0.2 | 0.13 |
Table 3 Cleaned Crop Pest Data
| Avg_SpoEggMass | Avg_SpoGregLar | Avg_SpoSolLar | Avg_semilooper | Avg_harmigera | Avg_GD damaged | Average |
|---|---|---|---|---|---|---|
| 0.4 | 0 | 0 | 0 | 0 | 0 | 0.06 |
| 0.4 | 0 | 0 | 0 | 0 | 0 | 0.06 |
| 0.6 | 0 | 0 | 0 | 0 | 0 | 0.1 |
| 0.2 | 0 | 0.2 | 0.2 | 0 | 0 | 0.1 |
| 0 | 0 | 0.2 | 0.4 | 0.2 | 0.2 | 0.17 |
| 0 | 0 | 0 | 0.2 | 0.4 | 0.2 | 0.13 |
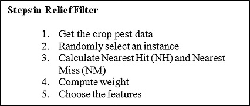
Pseudo code for Relief Algorithm
Input: a vector of attribute values and the class value for each training instance.
Output: the vector Wt of estimations of the qualities of attributes.
set Wt[a] = 0 for each attribute a
for i = 1 to n do
select sample sa from data at random
find nearest hit sah and nearest miss sam
for j = 1 to a do
ΔWti[a] = diff(a, sai, sam) - diff(a, saj, sah)
Wt[a] = Wt[a] +ΔWti[a]
end for
end for
for each attribute a
do
Wt[a] = Wt[a]/n
end for
where diff(a, sai, saj) = 0, if sai[a] = saj[a]
= 1, if sai[a] ≠ saj[a]
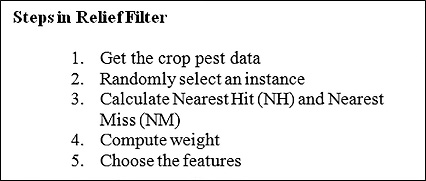
Figure 2 Working of Relief feature selector.
Table 4 Filtered attribute by Relief Method
| No. | Attribute Name | Value |
|---|---|---|
| 1 2 3 4 5 6 7 |
Avg_SpoEggMass Avg_SpoGregLar Avg_SpoSolLar Avg_semilooper Avg_harmigera Avg_GD_damaged RAverage |
0.003012987 0.000000000 0.044432857 0.061501607 0.028350649 0.087692264 0.091168887 |
Nearest hit sah is the nearest neighbor of the same class and the nearest miss sam, is the nearest neighbor of the different class. Differences normalized to the interval [0, 1], then all weights are in the interval [−1, 1]. Figure 2 represents the working of relief feature selection method [6].
The following Table 4 includes filtered crop pest data using Relief feature selector. After applying feature selection method, 7 attributes are filtered out from 13 attributes of crop pest data for further process accordingly.
Among 7 attributes, the attribute with maximum weight is selected as splitting attribute for construction of decision tree. Here, RAverage attribute contains the highest gain value which has been chosen as splitting attribute for classification [16]. According to Raverage value the crop pest data are classified using C5.0 classifier.
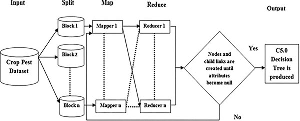
5 MapReduce Based C5.0 Classification
C5.0 algorithm is an extension of C4.5 algorithm. It is a classification algorithm which was developed by Ross Quinlan in 1993 [15]. This algorithm produces a decision tree for the given crop pest training data by recursively splitting of data. This research has splitted the crop pest dataset into training dataset and testing data set. C5.0 decision tree is built from the crop pest training data. Testing crop pest data is used to predict the accuracy of the decision tree. Both C4.5 and C5.0 can produce classifiers either in a way of decision trees or rule sets. C5.0 can obviously better than C4.5 by means of speed, memory and the efficiency. The following Table 5 illustrates the size of training and testing crop pest data.
Even though C5.0 is suitable for large datasets; the speed and size are considerable. To work with large datasets, MapReduce based C5.0 classification reduces the time complexity, gives excessive memory for huge datasets and processes in high speed [9].
The bulky crop pest dataset is passed to the mapper function line by line. The mapper function processed the crop pest data and created several small chunks of data. It processed a key/value pair to generate intermediate key/value. Reduce stage is a combination of shuffling and merging. All intermediate values associated with the same key are merged in reduce phase [8]. The following Figure 3 represents the internal working of MapReduce based C5.0 Classification.
After processing large crop pest dataset, a new set of output is produced that have been stored in Hadoop Distributed File System (HDFS) [11].
Table 5 Size of training and testing data
| Year | Training DataSet | Testing Dataset |
|---|---|---|
| 2010–2011 | 70,000 | 12850 |
| 2011–2012 | 60,000 | 19380 |
| 2012–2013 | 30,000 | 14215 |
| 2013–2014 | 30,000 | 15434 |
| 2014–2015 | 30,000 | 16550 |
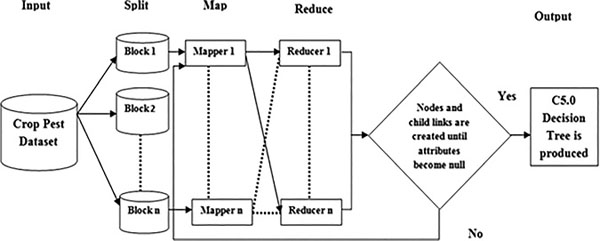
Figure 3 Working process of MapReduce based C5.0 Classification.
6 Experimental Results
The dataset used in this experiment is agricultural crop pest data. This data has been collected from department of agriculture. The crop pest dataset contains 3,62,519 data.
RStudio is a data mining tool which is used here for implementation of entire work. This research predicts the Agricultural crop pest data from the year 2011 to 2015 independently. The experiment is implemented in the R programming language; processing data via MapReduce is attainable by the rmr2 packages.
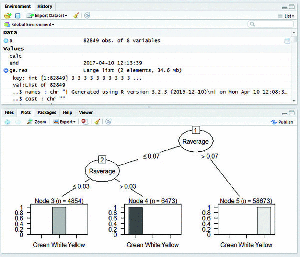
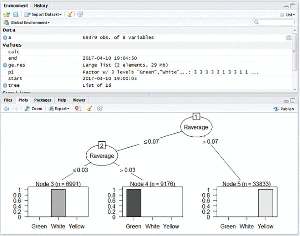
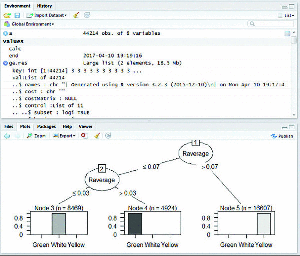
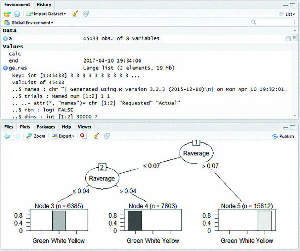
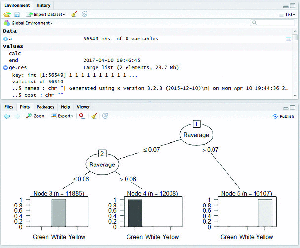
MapReduce based C5.0 classification works efficiently on large datasets. The C5.0 decision tree is constructed for five years of crop pest data from 2011 to 2015 individually. Figures (4–8) shows map reduce based C5.0 decision tree for 2011–2015 crop pest data respectively.
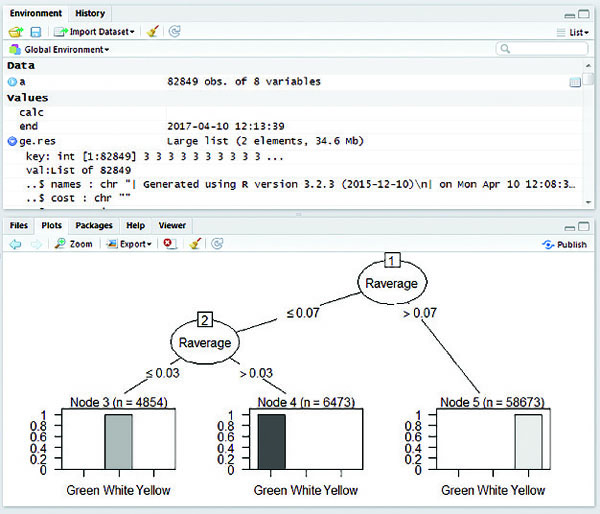
Figure 4 Map Reduce based C5.0 decision tree for 2011 crop pest data.
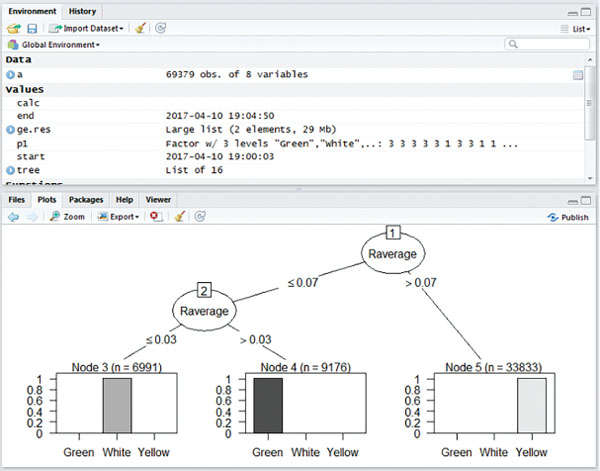
Figure 5 Map Reduce based C5.0 decision tree for 2012 crop pest data.
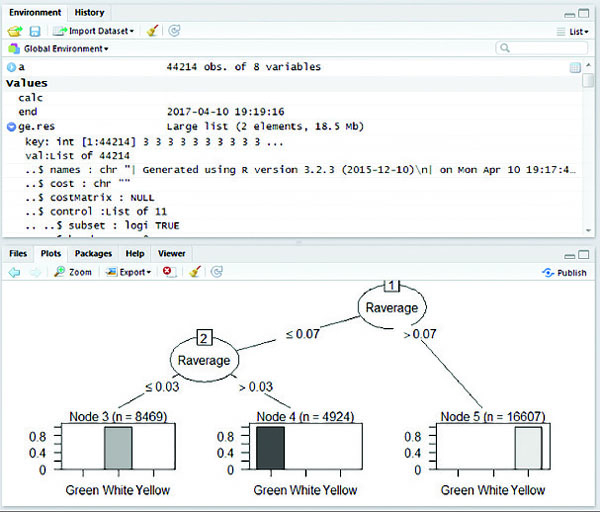
Figure 6 Map Reduce based C5.0 decision tree for 2013 crop pest data.
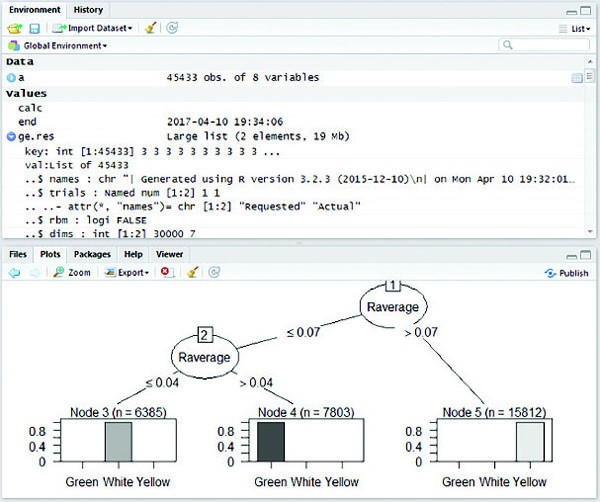
Figure 7 Map Reduce based C5.0 decision tree for 2014 crop pest data.
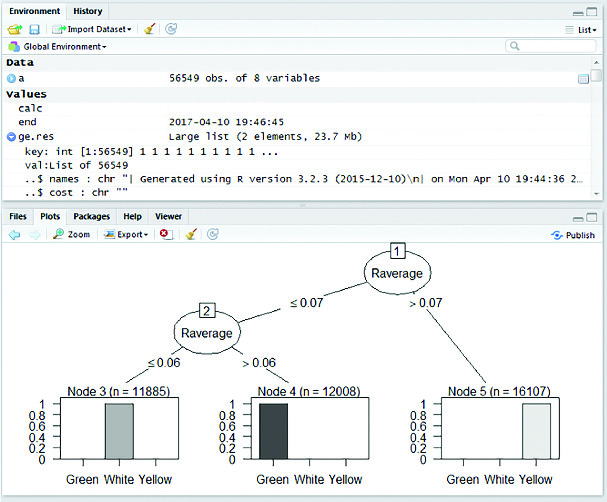
Figure 8 Map Reduce based C5.0 decision tree for 2015 crop pest data.

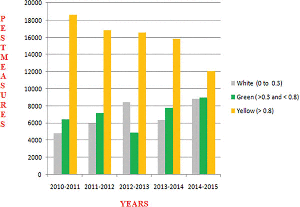
Figure 9 Yearly Predictions of Crop Pests.
Figure 9 shows the yearly prediction of crop pest differentiated by white, green and yellow respectively. The leaves affected by pests are identified by these three different colours. The white colour is determined if the value ranges between 0 and 0.3 which are in safe condition, Green colour is determined if the value is greater than 0.3 and lesser than 0.8 which can be protected, and finally Yellow colour is determined once the value is greater than 0.8 and it is recognized as danger.
7 Accuracy Prediction
In this research the accuracy of C5.0 decision tree with and without MapReduce has been predicted by using testing crop pest data. Classification accuracy can find out by the number of correctly classified instances divided by the total number of instances, and then multiplied it by 100 to get percentage value. The performance of the algorithm is calculated by using the given formula (1).
Table 6 Experimental Results
| Pest Data | Correctly Classified Instance | Incorrectly Classified Instance | Accuracy Prediction | Time Taken to Built Model (in Sec) | ||||
|---|---|---|---|---|---|---|---|---|
| With Map Reduce | Without Map Reduce | With Map Reduce | Without Map Reduce | With Map Reduce | Without Map Reduce | With Map Reduce | Without Map Reduce | |
| 2011 | 12802 | 12700 | 48 | 150 | 99.6% | 98.8% | 38.97% | 60 |
| 2012 | 19350 | 19200 | 30 | 180 | 99.8% | 99% | 27.82% | 55 |
| 2013 | 14188 | 14070 | 27 | 145 | 99.8% | 98.9% | 19.18% | 40 |
| 2014 | 15400 | 15300 | 34 | 134 | 99.7% | 99% | 20.20% | 42 |
| 2015 | 16510 | 16400 | 40 | 150 | 99.7% | 99% | 24.76% | 53 |
Where tp = True Positive, tn = True Negative. fp = False Positive, and fn = False Negative [7]. The accuracy is calculated for all the five years of crop pest data individually. When compared with other model, the performance of MapReduce based C5.0 decision tree gives more accuracy for the crop pest dataset.
Table 6 shows the result of C5.0 decision tree i.e., correctly classified instances, incorrectly classified instances, accuracy prediction, and duration of the decision tree with and without MapReduce. C5.0 decision tree with MapReduce takes less time to generate tree for all years when compared with C5.0 decision tree without MapReduce.
8 Conclusions
This research implemented MapReduce based C5.0 algorithm that improved both time efficiency and scalability due to parallel processing. It has been observed that the performance of C5.0 algorithm produced 99% of accuracy when compared with ID3 and C4.5 decision tree algorithms. In future, this work can be enhanced by applying back propagation neural network training based on MapReduce. It can reduce the volume of intermediate data created by Mappers and reduce the cost of I/O, thereby accelerating training speed.
Acknowledgement
The first author would like to thank the management of Kalasalingam University for providing fellowship to carry out the research work. The authors would like to thank the editor and the anonymous reviewers for their constructive comments.
References
[1] Jinubala, V., and Lawrance, R., “Analysis of Missing Data and Imputation on Agriculture Data With Predictive Mean Matching Method”, International Journal of Science and Applied Information Technology, Volume 5, Issue 1, 2016, pp: 01–04.
[2] Rosario, F, S., and Thangadurai, K., “RELIEF: Feature Selection Approach”, International Journal of Innovative Research & Development, Volume 4, Issue 11, October 2015.
[3] Krishna Kumar, V, S., Kiruthika, P., “An Overview of Classification Algorithm in Data Mining”, International Journal of Advanced Research in Computer and Communication Engineering, Volume 4, Issue 12, 2015, pp: 255–257.
[4] Yang, T., HiongNgu, H, A., “Implementation of Decision Tree Using Hadoop Map Reduce”, International Journal of Biomedical Data Mining, Volume 6, Issue 1, 2016, pp: 1–4.
[5] Dai, W., Ji, W., “A MapReduce Implementation of C4.5 Decision Tree Algorithm”, International Journal of Database Theory and Application, Volume 7, Issue 1, 2014, pp: 50–60.
[6] Sutha, S., Tamilselvi, J, J., “A Review of Feature Selection Algorithms for Data Mining Techniques”, International Journal on Computer Science and Engineering, Volume 7, Issue 6, 2015, pp: 62–67.
[7] Hen J. and Kamber M., “Data Mining: Concepts and Techniques”, Second Edition, ELSEVIER Publications, ISBN: 978-81-312-0535-81, 2005.
[8] Bikku, T., Rao, S, N., Akepogu, R, A., “ Hadoop based Feature Selection and Decision Making Models on Big Data”, International Journal of Science and Technology, Volume 9, Issue 10, 2016, pp: 1–6.
[9] Glory, A, H., Nithya, R., Jeyapaul, I, S., “Comparing C4.5 and MST Classifier Using MapReduce”, International Research Journal of Engineering and Technology, Volume 2, Issue 2, 2015, pp: 1–4.
[10] Patil, N., Lathi, R.,Chitre, V., Comparison of C5.0 & CART Classification algorithms using pruning Technique”, International Journal of Engineering Research& Technology, Volume.1, Issue 4, 2012, pp: 1–5.
[11] Prajapati, V., “Big Data Analytics with R and Hadoop”, First Edition 2013.
[12] Verma, S., Badhe, V., “Survey on Big Data and Mining Algorithm”, International Journal of Scientific Research in Science, Engineering and Technology, Volume.2, Issue 2, April 2016, pp: 1338–1344.
[13] Singh, S., and Gupta, P., “Comparative Study Id3, Cart and C4.5 Decision Tree Algorithm: A Survey”, International Journal of Advanced Information Science and Technology, Volume 27, Issue 27, 2014, pp: 97–103.
[14] Revathi, P., Revathi, R., Hemalatha, M., “Comparative Study of Knowledge in Crop Diseases Using Machine Learning Techniques”, International Journal of Computer Science and Information Technologies, Volume 2, Issue 5, 2011, pp: 2180–2182.
[15] HSSINA, B., MERBOUHA, A., EZZIKOURI, H., and ERRITALI, M., “A Comparative study of decision tree ID3 and C4.5”, International Journal of Advanced Computer Science and Applications, Special Issue on Advances in Vehicular Ad Hoc Networking and Applications, 2014, pp: 13–19.
[16] Joshi, K, K., “Indian Agriculture Land through Decision Tree in Data Mining” International Journal of Core Engineering and Management, Volume 1, Issue 5, 2014, pp: 93–103.
[17] Rajeswari, S., Suthendran, K., and Rajakumar, K., “A Smart Agricultural Model by Integrating IoT, Mobile and Cloud-based Big Data Analytics”, International Journal of Pure and Applied Mathematics,Volume 118, pp: 365–369, 2018.
Biographies

R. Revathy received B.Sc., M.Sc. and M.Phil. in computer science from Madurai Kamarajar University, Tamil Nadu. She is pursuing Ph.D. in the department of computer applications at Kalsaslingam University, Krishnankoil, Tamil Nadu since 2017. Her current research interests include data mining and machine learning algorithms.

S. Balamurali is a Professor of Statistics and Director of Computer Applications at the Kalasalingam Academy of Research and Education. He received his undergraduate, postgraduate and doctoral degrees in Statistics from Bharathiar University, India. His research interests include applied statistics, data mining, network security and bioinformatics.

R. Lawrance has received B.Sc. & M.Sc. degree in Computer Science from St. Joseph’s College, Trichy in 1993 & 1998, M.Phil. Computer Science from M.S. University in 2003 and Ph.D. degree from the Vinayaka Missons University in 2011. He has joined Ayya Nadar Janaki Ammal College since 1998 as an assistant Professor. From 2011 onwards, he has been working as a Director in the Department of Computer Applications. His current research interest lies in data mining and machine learning Algorithms. He has produced 24 M.Phil. Scholars and one Ph.D. Scholar and guiding for 7 Ph.D. Scholars. He has published 25 National level conferences, 36 International level conferences and 8 International level Journals.
Journal of Cyber Security and Mobility, Vol. 8_3, 393–408.
doi: 10.13052/jcsm2245-1439.835
This is an Open Access publication. © 2019 the Author(s). All rights reserved.