Cover-aware Steganalysis
Niklas Bunzel*, Martin Steinebach and Huajian Liu
Fraunhofer Institute for Secure Information Technology SIT, Darmstadt, Germany
E-mail: niklas.bunzel@sit.fraunhofer.de; martin.steinebach@sit.fraunhofer.de; huajian.liu@sit.fraunhofer.de
*Corresponding Author
Received 30 November 2020; Accepted 01 December 2020; Publication 06 March 2021
Abstract
The increasing digitization offers new ways, possibilities and needs for a secure transmission of information. Steganography and its analysis constitute an essential part of IT-Security. In this work we show how methods of blind-steganalysis can be improved to work in cover-aware scenarios, we will call this non-blind steganalysis. The main objective was to examine how to take advantage of the knowledge of reference images to maximize the accuracy-rate of the analysis.
Therefore we evaluated common stego-tools and their embedding algorithms and established a dataset of 353110 images. The images have been applied to test the potency of the improved methods of the non-blind steganalysis. The results show that the accuray can be significantly improved by using cover-images to produce reference images. Also the aggregation of the outcomes has shown to have a positive impact on the accuracy. Particularly noteworthy is the correlation between the qualities of the stego- and cover-images. Only by consindering both, the accuracy could strongly be improved. Interestingly the difference between both qualities also has a deep impact on the results.
Keywords: Steganography, steganalysis, information hiding.
1 Introduction
The ever-increasing digitization of almost all areas of life has brought about fundamental social changes, especially in the field of communication.
Alongside cryptography, which is undoubtedly one fundamental mechanism of digital security technology, steganography is another important field of work in IT security. The latter pursues the approach of secrecy through camouflage. Whereas cryptography protects information by means of encryption, steganography is primarily concerned with concealing information in order to prevent it from being accessed by third parties. The aim of a steganographic procedure is the inconspicuous embedding of information in other digital media. An attacker must not recognize that a second hidden message is present. Thus, it provides a way to transmit content securely and protect sensitive data.
The social contexts of use and user groups of steganographic methods are diverse and constitute a field of tension that ranges from regime critical efforts of democratic freedom movements [2] to the development of secret service networks [1, 7] to the organization of terrorist actions [12, 15].
As different as the motivation behind the individual contexts of use may be, there are third parties wanting to recognize and, if possible, decode the hidden information. For example, police investigations could include the need to provide evidence and determine the perpetrator.
Steganalysis attempts to fulfill this need. Research on steganalysis as well as available steganographic tools focus on digital images. While there are other multimedia data like audio or video as well as natural language, formatted documents software and also communication channels, digital images have always been the most prominent example of steganographic information carrier.
1.1 Use Case
To illustrate the goal of our approach, we provide a simple use case and illustrate the challenges of current steganographic solutions. We assume that a person has become a suspect for illegal distribution of information. No evidence has been found so far, but it is assumed that steganography is used to hide the transfer of information.
An investigation is started including the forensic analysis of the computer belonging to the suspect. Not unlikely thousands of images are found on the hard drive, and each image could be a stego cover. Stego tools are also found on the computer, but there are no logs if they have been used and if so, which images were accessed or created by them.
A standard steganalytic procedure would take each single image and calculate a likelihood for it being a stego cover. Let us assume that the true positive rate is 95% which is quite high and the false positive rate is rather low with only 5%. Now we need to specify the chance by which an actual stego cover is included in the images under investigation: in our case we assume that one in a thousand images is a stego cover. An investigation of one thousand images would now have a fair chance that one true positive is present and is also detected. At the same time, 5% of the remaining images would falsely be labeled as stego covers due to the false positive rate. The investigator ends up with an estimated number of 50 alarms of which only one is true.
This makes it obvious that for real-world use cases more reliable detection strategies are required. We suggest one under the assumption that on a hard drive of a suspect both the original and the stego cover can be found.
1.2 Research Goal
In contrast to [18] where it is assumed that multiple images are used for a steganografic communication channel, we only consider cases in which individual images are used as analysis material. To date, however, there are no research studies describing cases in which several versions of the same image (reference images) exist. In this work we want to close this research gap. It can be assumed that at least one version of the image contains no secret message. This case is described in this paper as non-blind steganalysis.
Our aim is to develop a method for non-blind steganalysis. Based on the findings of blind steganalysis, we show how the knowledge of a reference image can be used to achieve higher accuracy in steganalysis.
In this work we investigate known stego methods and tools. From a research point of view, the examined software and the algorithms it is based on are dated and beyond the state of the art. However, since they are freely available and easy to use programs that can be downloaded from the Internet, it can be assumed that they are nevertheless used far more frequently than newer technologies. In relation to the concrete application, a high relevance can be derived from the frequency of use. We address the following software: Hide’n’Send, Steghide, Steg, JPHide, SilentEye and an F5 implementation.
One aspect we do not discuss in detail in our work is the question how different versions of perceptually identical images can be found during examination of a hard drive. This is not possible with cryptographic hashes, as they can only identify binary identical images. Embedding a stego message will break the hash and therefore prevent copies to be found. This can be solved by robust or perceptual hashes like discussed in [14] or [16]. With these hashes, multiple copies of images which differ regarding their binary representation, but look identical to a human observer, can be found reliably and efficiently.
1.3 Paper Structure
Our paper is structured as follows: First we briefly discuss steganography and steganalysis in Section 2. In contrast to other works focused more on scientific aspects of steganography we also provide an overview of existing tools for end users and not only mention algorithms. In Section 3 we introduce our non-blind strategy on an abstract level. In the following sections we provide details for the core elements of our strategy: training, blind analysis, non-blind analysis and result aggregation. In Section 8 we provide evaluation results showing the improvements made by our approach. As we aim for real-world forensic investigations in this work, we provide a look at the GUI of our implemented tool in Section 9. We close our paper with a summary and a brief path for future work.
2 Related Work
Steganography and steganalysis in digital data have become a broad area of research in the last 25 years. In this section we give a coarse overview on areas relevant to this work. As we focus on real-world steganalysis in forensic scenarios, we do not discuss the most recent approaches for steganography, but only address methods for which end-user software is widely available. Then we briefly discuss steganalyis and provide an overview of solutions available to an forensics expert tasked with a steganalytic examination.
2.1 Steganography Software
There is a variety of steganography tools, for different file formats and embedding algorithms. Most of them are designed for images and especially support lossless formats like BMP or PNG. For example: StegoShare, OpenPuff, StegHide, SilentEye, StegoStick, JHide, Hallucinate, Hide’n’Send.
2.2 Steganalysis Methods
Analogous to the versatility of steganographic algorithms and the corresponding stego software, there are steganalysis procedures. Some of these procedures are designed to detect a special embedding algorithm, such as Jessica Fridrich’s Breaking F5 [11] or Attacking OutGuess [10]. Some procedures are applicable to a class of algorithms. For example, Pfitzmann and Westfeld’s Chi-Square attack [20] can be used against sequential LSB embedding, such as by S-Tools, EZStego, or JSteg. The first universal steganalysis method was presented in 2003 by Memon et al. [3]. This method uses different image quality measures as features for the classifier. In [17] a classifier for different steganographic systems for JPEG images was presented. The classifier is a SVM with 23 features, most of which are calculated from the DCT coefficients. The work of Butora and Fridrich [5] utilizes CNNs to detect the usage of various stego embedders.
Many recent approaches utilize machine learning concepts, like Chen et al. [6]. Nonetheless their work concludes with the statement that even with the help of machine learning, a reliable detection of stego images is far away. A publication by Lin et al. [13] shows combined error rates (false negative and false positive) of 25% to 40%. A work by Tsang [19] states error rates of as low as 13%, but also only provides a combined error rate.
2.3 Steganalysis Tools
There is very little ready-to-use steganalysis software available. Most steganalysis implementations are MatLab scripts on the website of Jessica Fridrich.1 The steganographic software examined in this paper was selected based on the criteria of availability, support of JPEG images and usability through a graphical user interface.
StegExpose2: StegExpose is a platform independent steganalysis tool. It is a command line tool developed in Java. It combines the steganalysis methods Primary Sets, Sample Pairs, Chi Square and RS Analysis. The standard combination is the arithmetic mean of the individual components or methods. StegExpose offers another fast variant, in which the methods are executed one after the other and after each step the arithmetic mean of the methods used up to that point is calculated and compared against a threshold. The order is the same as given above. If a threshold is exceeded, the image is identified as clean and the process is terminated [4]. The default threshold is 0.2. In [8] a false positive rate of 26% was achieved with the default settings.
Virtual Steganographic Laboratory (VSL)3: VSL is a modular program with a graphical interface. It is both a tool for embedding messages and for analysis. For embedding messages a simple LSB algorithm, the Karhunen-Loeve Transform (KLT) technique and the F5 algorithm are available. For steganalysis the user can choose between RS analysis and a Support Vector Machine with Binary Similarity Measures as features. The output of the analysis is written into a report.
StegSecret4: StegSecret is a steganalysis software with a graphical user interface. In version 0.1 it supports Chi-Square Attack and RS analysis for BMP images. StegSecret additionally supports a check for a so-called End-Of-File steganography. This means that data is hidden behind the end of the image information. This check supports BMP, GIF and JPEG format.
Ben-4D5: Ben-4D is a steganalysis software written in Java that uses various tests to determine whether a file contains a message or not. Three tests are performed on the Exif data. If a valid signature of Microsoft Paint is present, this does not indicate an embedding. However, if the signature of the stego program Camouflage is present, it can be assumed to contain an embedding. If a special Huffman Table, as used in JPHide, is present it can also be assumed to contain an embedding. For the last test, a “clean” test image is created. For both the stego image and the test image it is examined to what extend the byte distribution follows Benford’s law and how much the byte distribution of the stego and test pattern are alike.
3 Steganalyis Strategy
In this section we describe the strategy implemented for our detection strategy. As it is a non-blind approach, it differs from known methods as discussed in the previous section. We distinguish three different phases in our concept:
• Training: In the training phase, we learn detection thresholds for the various individual steganalytic sensors.
• Blind Phase: This is the first detection phase where we decide whether an image is more likely a cover or a stego image.
• Non-Blind Phase: Here we use the images assigned as covers in the blind phase to execute non-blind steganalyis.
We discuss each phase in detail in the following sections. All phases produce estimations whether a given image is a stegon cover or not. As we utilize a number of steganalytic sensors in our approach, we need to aggregate their individual detection results for a final decision. There are various possible ways to achieve this:
• Average combines all sensors and calculates the average of their individual decisions.
• Min responds negative as soon as one sensor rejects a stego detection.
• Max responds positive as soon as one sensor supports a stego detection.
• Accuracy Voting is based on the performance of the individual sensors learned in the training phase.
• Accuracy Judge selects the best sensor from the training phase and uses their thresholds.
A more detailed discussion of these aggregation methods is later given in a following section.
4 Training
The first phase of our strategy is to learn the detection thresholds. Each individual steganalytic sensor and also the aggregation functions must decide whether an image contains a message or not based on the threshold. This threshold must provide acceptable results for all steganographic systems examined. Therefore, the image quality was taken into account in the phase of blind analysis. In the non-blind analysis all pairs of cover quality and stego quality were considered. The data set used for this purpose must be sufficiently large and diverse to function in real applications later on. We used the training data to manually find suitable thresholds in a ROC like manner.
5 Blind Steganalysis
The blind analysis is the first detection phase in our steganalysis strategy.
In blind analysis, several images or image versions of the same original image are available. For no version of the image is it known whether a message has been embedded or not. This means that a classical analysis must first be carried out to determine which images are probably originals and which may contain a message.
In this step it is of particular importance that no image is falsely recognized as an original. A wrong assignment could lead to it being used as a reference image in the non-blind analysis, thus causing subsequent errors. This could lead to an original image being classified as a stego image and vice versa. If an image is falsely identified as a stego image, it could be identified as harmless during non-blind steganalysis compared to the original and the classification could be corrected. This means that in blind analysis, false negatives are more serious than false positives.
Each image is subjected to various analysis procedures. In addition to the known steganalysis procedures, the creation time can also be used as a feature. In this paper we used the timestamp of the system for this. Also conceivable is the timestamp from the meta information of the image, such as in the Exif data. It can be assumed that an unchanged image was first created and then processed further. From this it can be concluded that the image with the oldest timestamp is unchanged. Whether the change was caused by a quality change, a filter or a stego software has to be clarified. These time stamps are easy to manipulate by an experienced user. Therefore this feature should only be used in conjunction with others. Our experiments that Breaking F5, Category Attack, the deviation, Co-Occurence, the creation time as well as the dual and local histogram analysis yield the best results.
The images are analyzed in parallel for better performance. The results are then merged using the aggregation function set to make a preliminary decision. The following functions were examined: The Average, Min & Max.
Here the average function has established itself as the standard. After the blind analysis, the data is forwarded to the next phase, the non-blind analysis.
6 Non-Blind Steganalysis
The last phase of our strategy is the non-blind analysis. In non-blind analysis, the images assigned as covers in the blind phase are assumed to contain no message and are used to create the reference images. The images assigned as stego in the blind phase will be analyzed. For each supposed stego image, a reference image is created from the most appropriate original image. The most appropriate image is the one that, if possible, does not need to be rescaled and if, then scaled down, for JPEG images where the quality is the same or needs to be changed downwards. On the most appropriate image the operations that are necessary to achieve the same dimensions and quality as the supposed stego image are applied. The resulting image is the reference image.
On each combination of stego image and reference image various non-blind analysis methods are applied. The following analysis procedures have been developed from the experiments as standard: The Category Attack and its local variant, the local Chi-Square Attack, the Co-Occurence, the histogram analysis in the variants global, local and dual, the deviation and the Breaking F5 attack.
The adaptation of the blind steganalysis methods to non-blind steganalysis methods are straightforward calculated from the reference image. Steganalysis Methods that calculate a statistic by estimating the cover image, for example [11] and [17], calculate the statistic in the non-blind variant using the reference image. Blind steganalysis methods like Chi-Square Attack that use statistics like the arithmetic mean of the Pairs of Value of the potential stego image can be modified to use the frequency of the Pairs of Value of the reference image instead.
The modified steganalysis methods benefit from the advantage of a known version of the cover image. However, this version of the cover image may differ from the actual cover image in file format, dimensions and quality. To match the characteristics of the actual cover image as closely as possible, a reference image is created from the existing cover image version. This reference image corresponds to the Stego image in file format, dimensions and quality level.6 In order to determine suitable thresholds that can differentiate between stego and cover images, the quality of the present cover image and the quality of the stego image or the difference in quality to the potential stego image was taken into account. If only the quality of the stego image is considered, the statistical characteristics of the DCT coefficients differ significantly. This is visualized in Figure 1 by means of an example. On the left is the original image from the image corpus with a quality level of 50, which serves as potential stego image. Next to it, the difference between the “stego image” and a reference image created from a cover version of the image with quality level 100 (center) or 80 (right) is shown. It can be clearly seen that there are different changes in the DCT coefficients for both images and that the images therefore have different statistical characteristics. Or the characteristics are differently pronounced. This makes it difficult to find a single threshold that can precisely distinguish between stego and cover image at different output qualities of the present cover image.
The same applies if the original quality of the cover image is considered separately. Figure 2 shows the same example image as Figure 1, but this time, the output quality of the cover image was set to 100 and the quality of the stego image was changed. On the left side, the difference between the stego image with quality level 90 and the reference image is shown, and on the right side with quality level 80. The resulting differences are also considerable and make it difficult to find a threshold that can differentiate between stego and cover image with high accuracy for different quality levels of the stego images.
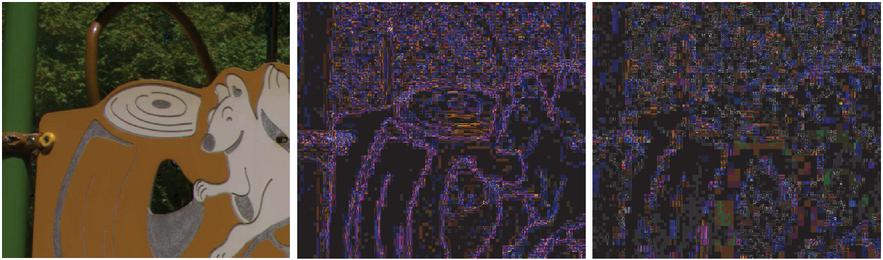
Figure 1 Left the original image, the difference between stego and reference image with cover quality 100 in the middle and on the right with quality 80.
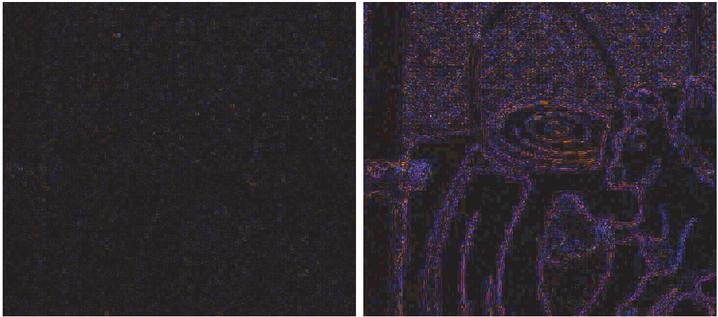
Figure 2 The difference between stego and reference image with stego quality 90 on the left and 80 on the right.
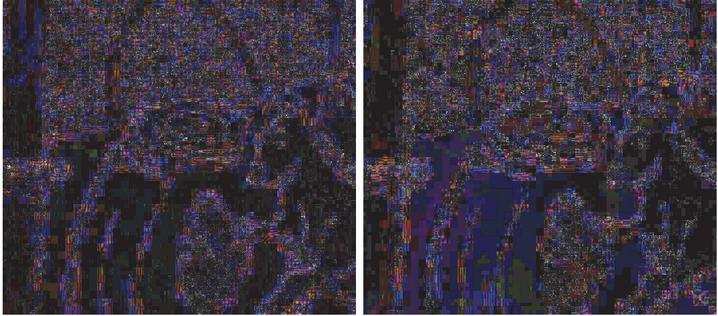
Figure 3 Left with stego quality 70 and right with 60.
The difference between the quality of the stego image and the output quality of the reference image combines both features, but still no threshold can be found for the difference alone that would promote a correspondingly high accuracy. For example, a quality difference of 10 can result from a stego image with quality 70 and an original image with quality 80 or a stego image with quality 60 and an original image with quality 70. The difference between the reference images created here and their corresponding stego images can be seen in Figure 3. Since for all characteristics, the value range of the cover images takes its maximum with a quality difference between cover and stego image of 10 at least for one of the cover quality levels of 90 – 70.7 So there is not only a connection between cover and stego quality, but also between cover quality and the difference in quality between cover and stego quality. As in the blind analysis, the images are examined in parallel. The individual results of the analysis procedures are combined into one result using one of the aggregation functions. The following functions were examined: Average, Accuracy Voting, Accuracy Judge, Min & Max.
The Accuracy Judge function is the default setting as it has the best true negative rates. For large messages, it also has very good true positive rates and therefore the best accuracy values.
In non-blind analysis, it is important to avoid a high false positive rate, otherwise investigators will turn to an image that contains no hidden messages or even convict an innocent person on false evidence.
7 Aggregation Functions
As stated in our strategy in section 3 each detection phase utilizes various steganalytic sensors, thus we need to aggregate their individual results. We examined six different aggregation functions:
Average
Since the individual analysis methods, as in the blind variant, do not map to the same value range and also not with the same significance, each analysis method first decides whether the image contains a message or not with a weight of 1 or 0. Afterwards the average is formed over the individual decisions. If an image receives a value above 0.5, it is classified as a stego image.
Accuracy Voting
For this aggregation function, each analysis method was assigned its accuracy from the training set per JPEG quality and quality difference as a weight. If an analysis method considers the file to be a stego image, its vote is weighted with its accuracy. For the non-stego decision, the weight is set to 0. This is to avoid that a few uncertain analysis methods override a safe one. Since the uncertainties are usually based on increased false negative rates, the decision stego image is given a more significant weighting. The result is then normalized with the number of analysis methods.
Accuracy Judge
For this aggregation function, each analysis method is assigned its accuracy from the training set. To make a decision, the analysis method with the highest accuracy is selected and the final decision is made with the threshold set for it. The decision maps to 0 for non-stego and 1 for stego images.
Min & Max
With these aggregation functions, analogous to the blind variant, the image in question is classified as stego or non-stego as soon as a detector classifies it accordingly. These aggregation functions map to the values 0, for non-stego, and 1, for stego.
8 Evaluation
In order to learn the detection thresholds and evaluate our non-blind steganalysis, we established a data set of 353110 images. Therefor we randomly selected 999 images of the Alaska8 training set in TIFF-format. These images were transformed into JPEG-format (sequential, no subsampling) with ImageMagick.9 Each image was transformed with a quality factor of 100, 90, 80, 70, 60, and 50. Resulting in 5994 cover images. In these images random messages were embedded with the steganographic tools F5, Steg, JPHide, Hide’n’Send, StegHide and SilentEye. If possible, message sizes of 5%, 10%, 20%, 30%, 40%, 50%, 60%, 70%, 80%, 90% and 100% of maximum capacity were embedded. In some cases the embedding does not take place, this can have various causes. For example, the steganographic programs estimate the maximum capacity per image, which means that embeddings with maximum capacity in particular are often not possible. This results in 347,116 stego images and a total corpus of 353110 images. From our image corpus, 2/3 of the images were randomly selected for the training phase and finding suitable threshold values. We used the remaining images to perform the accuracy tests. For a non-blind steganalysis at least two versions of the same image must be available. Assuming that steganography was used in this minimal scenario, the resulting distribution is 50% cover images to 50% stego images. As a result, the accuracy values given here refer to this 50–50 distribution of cover images to stego images. Due to the lack of usage statistics, the use of the different steganographic systems is considered equally likely. In the non-blind analysis, a high true negative rate of the individual analysis methods is prioritized over the true positive rate. This is due to the application of this method in forensic scenarios. Since a message tends to be embedded only once in a cover image, the cover rate increases with the number of versions of the image. The high true negative rates then result in increasing accuracy. In the training phase we learned the thresholds for the individual steganalytic sensors and the aggregation functions. The aggregation functions Average, Accuracy Voting and Accuracy Judge achive better results than the individual sensors in most cases. In Figure 4, we can see that the Accuracy Judge in particular achieves a better or equal accuracy for every quality delta as each single sensor.
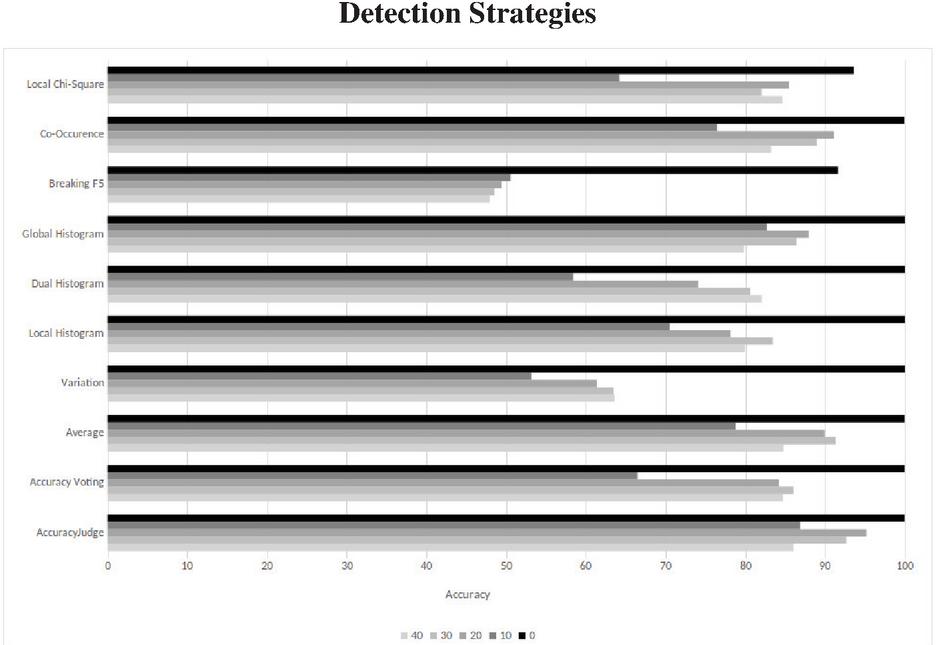
Figure 4 Comparison of accuracies for different quality deltas (0–40). Top worst average, bottom best average.

Figure 5 Comparison of detections for original and embedding algorithms under different quality deltas. Detections in the original are false positives.
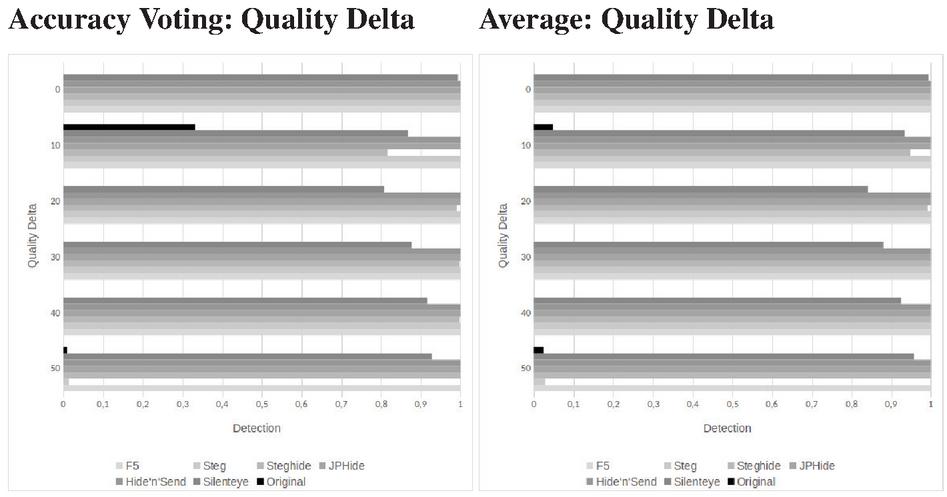
Figure 6 Comparison of detections for original and embedding algorithms under different quality deltas. Detections in the original are false positives. On the right the Accuracy Voting and on the left the Average function.
In order to achieve our results we have learned thresholds for each quality delta. In Figure 5, we can see in the example of Accuracy Judge that the detection rates are not in linear dependency to the quality delta. For a high quality image (100 JPEG quality) the false detection rates vary between 0% and 6% with the maximum at a quality delta of 10. The true detection rates of the stego images depend on the steganographic algorithm. For JPHide, Hide’n’Send, StegHide and F5 we achive almost for every quality delta a detection rate of nearly 100%. The lowest detection rate of StegHide is achieved at a quality delta of 10 with 94%. We achieve detection rates of 100% for Steg, except for a quality delta of 50. The detection rates for SilentEye vary between 79% and 99%.
We can see the same behaviour with the Accuracy Voting and Average functions in Figure 6 on the left or on the right respectively. Especially the Accuracy Voting function has a high false positive rate at a quality delta of 10 with 33%. The Average function has the best detection rate against F5, Hide’n’Send, JPHide and especially Silenteye, where we can see improvements of up to 10% compared to Accuracy Judge and Accuracy Voting.
The JPEG quality is one of the major factors for the performance of our nonblind steganalytic system. Most modern cameras - whether DSLR or integrated in a cell phone - or image processing software like GIMP10 use high JPEG quality as default setting. Therefore, we have focused on achieving high accuracy and very low false positive rates for images with high JPEG quality. If the JPEG quality decreases, our accuracy can decrease significantly. The quality of the non-stego image plays an important role, more important than the quality of the stego image. This behaviour is shown in Figure 7.
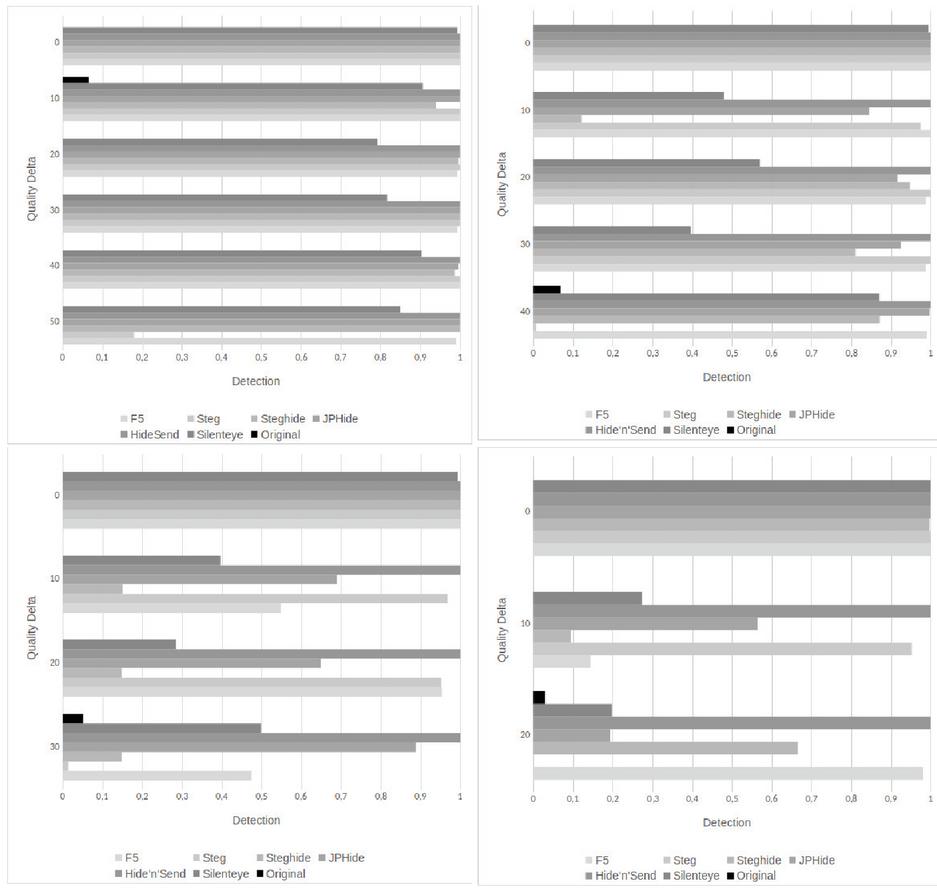
Figure 7 Comparison of Accuracy Judge detections for original and embedding algorithms under different quality deltas. Each figure shows another non-stego image quality. Upper left: 100, upper right: 90, lower left: 80, lower right: 70.
The influence of the embedded message size on our steganalytic system is shown in Figure 8 with a non-stego image with a JPEG quality of 100 and stego images with quality 90. We can see that the detection accuracy correlates strongly with the capacity used. The more of the images capacity is used, the better the detection accuracy for every steganographic algorithm. With 90% of the capacity used we achieve over 90% accuracy. We achieve over 74% accuracy for Hide’n’Send embeddings of 20% of the maximum capacity. For SilentEye we achieve over 34% for embeddings up to 5% of maximum capacity.
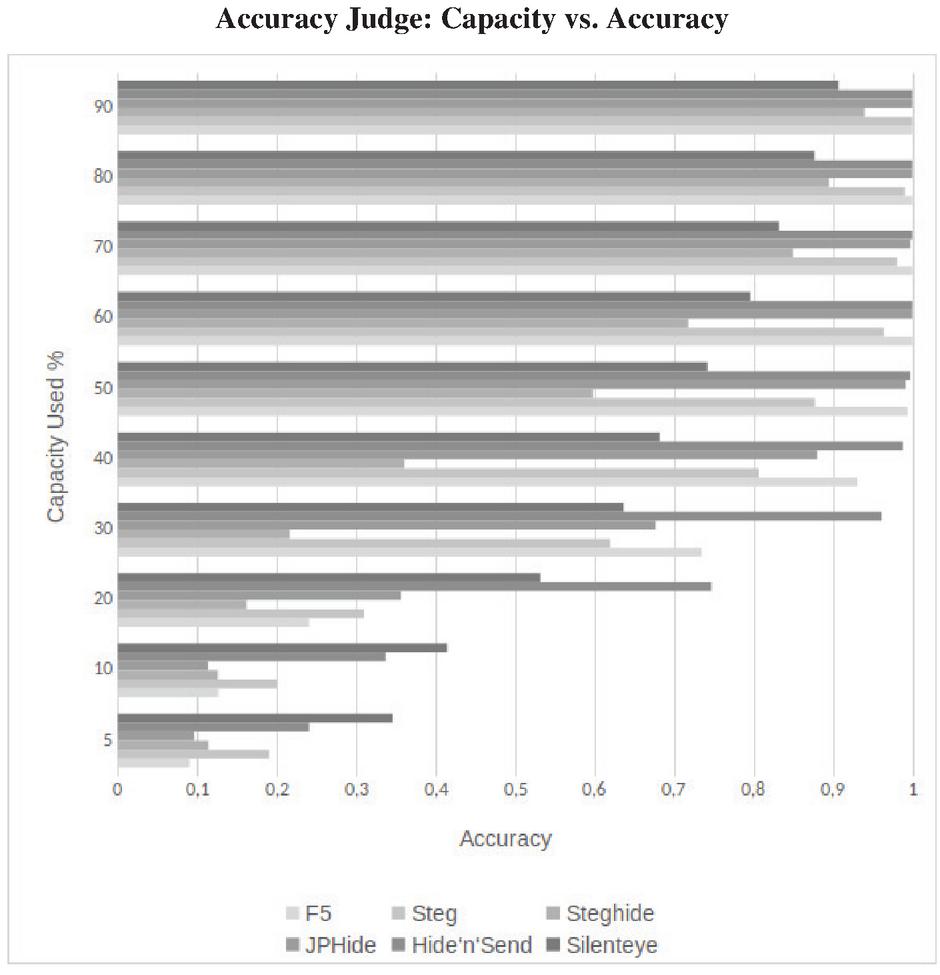
Figure 8 Comparison of accuracies for different capacity usage and embedding algorithms.
In Figure 9 we can see how the used message size and the JPEG quality combined affect the detection accuracy in the example of Accuracy Judge. In this scenario we set the non-stego image quality to 100 and varied the stego image quality from 100 to 70. We can see that for a stego images with the same quality factor we nearly reach a perfect detection even for small capacities such as 5% of the maximial capacity. We can detect some steganographic systems like Steg or Hide’n’Send with a larger quality delta up to a message size of 5% with a very high accuracy. For example, with a quality difference of 30 we still achieve an accuracy of over 97% with these two methods. However, as already mentioned in the quality evaluation in Figure 7, we can see that with a quality difference of 10, we often get the worst results.
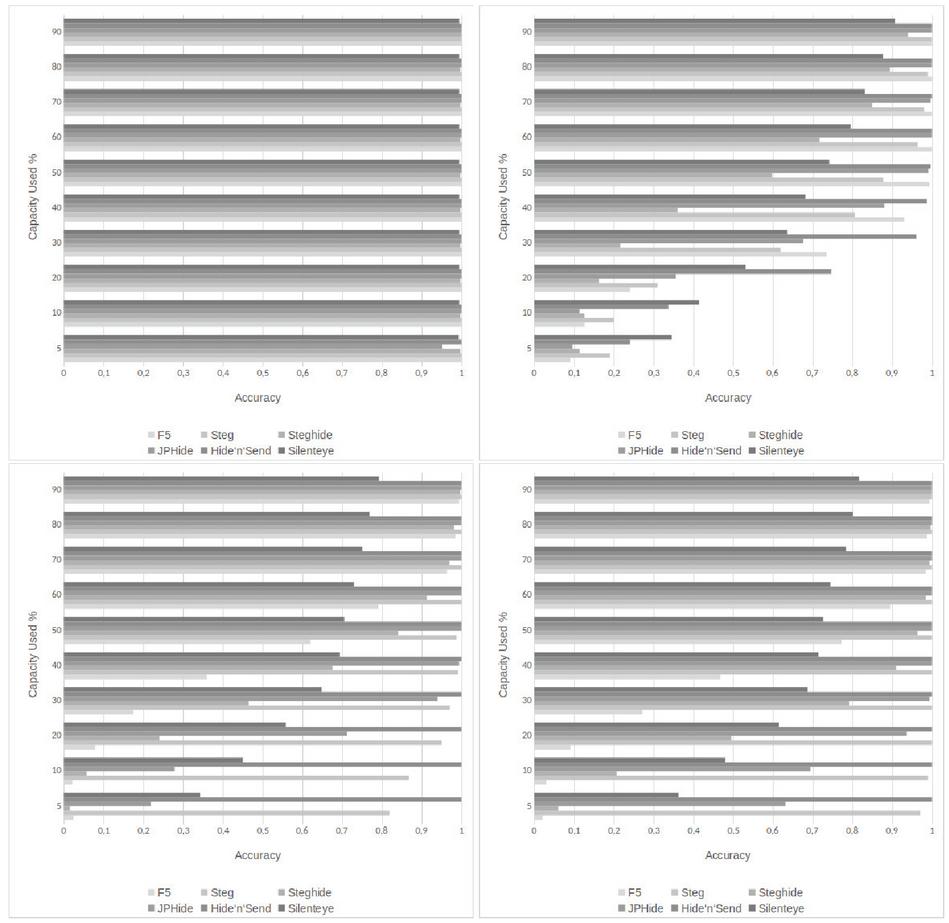
Figure 9 Comparison of Accuracy Judge detections for different capacity usage and embedding algorithms. Each figure shows another stego image quality. Upper left: 100, upper right: 90, lower left: 80, lower right: 70.
In Figure 10, we can see that the ROC curve of Accuracy Voting and Average (with a high quality cover image and a quality delta of 40) are close to an ideal discriminator. We obtain a true positive rate of 0.974 or 0.973 respectively with a false positive rate of 0. From a false positive rate of about 0.01, the false positive rate starts to increase faster than the true positive rate. Especially at a false positive rate of about 0.15 the true positive rate is growing so slowly that it seems to stagnate.
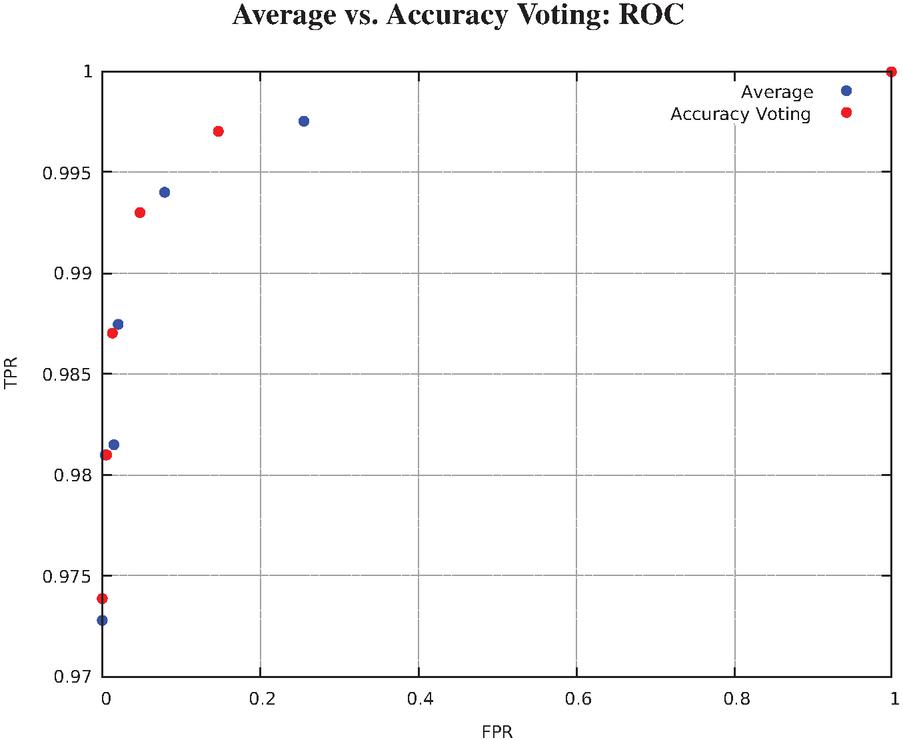
Figure 10 ROC with varying thresholds.
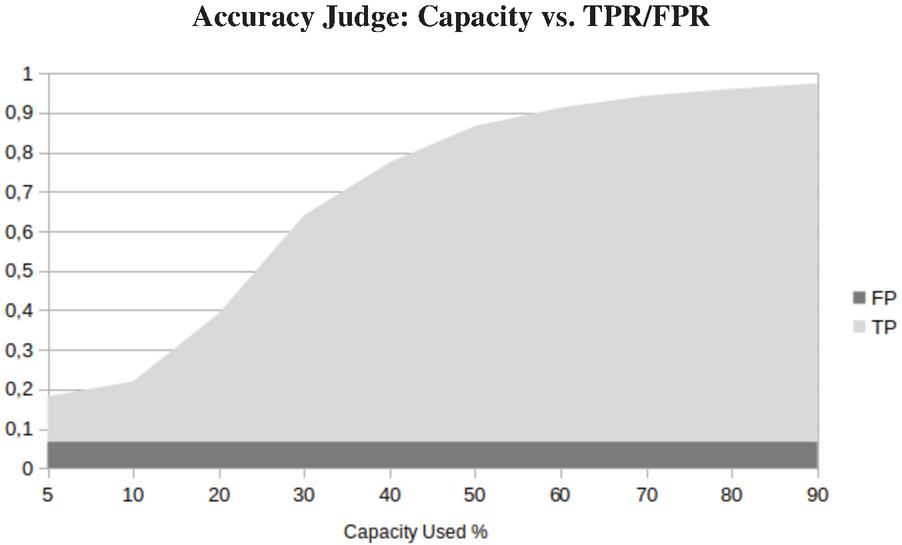
Figure 11 Comparision of TPR and FPR.
In Figure 11, we can see that the true positives are increasing with the increase of the used capacity. The false positive rate is fix, by fixing the quality delta.
9 Implementation
The software for non-blind stego analysis, which was developed in the course of this work, has both a console interface and a graphical user interface. In order to make the handling as easy and intuitive as possible. Both use the developed library to calculate the analysis. This library can be easily extended with plug-ins using the Strategy Design Pattern to include new sensors for blind and non-blind analysis, as well as aggregation functions. This can be seen in a UML diagram in Figure 12. In the diagram the dashed arrow is used to indicate a usage of the class or package respectively. The arrow with the closed tip is a generalization of the interface. The user can choose between blind and non-blind analysis. Each image is subjected to the sensors defined in the settings. The images are analyzed in parallel for better performance. After the blind analysis, the data is automatically transferred to the non-blind analysis. Figure 13 shows the blind analysis of the image ”Sigma-SD1Merrill_0304” in different quality levels with and without embedding from different stego software. Embeddings between 5% and 100% of the maximum capacity were used. You can see that the original image with a JPEG quality factor of 90 was recognized as a non-stego image in the blind analysis. The remaining images were classified as stego images. This is shown in the PreDecision column. Afterwards the non-blind analysis was performed with the image just selected as cover image. Based on this, the software classifies the original image with only 70% JPEG quality as non-stego. The remaining images in this example were images with embedded secret messages and were also recognized as such. The Decision column contains the final decision. If a file is selected, a bar chart is displayed in the lower half of the program, which displays the results of the selected blind and non-blind procedures.
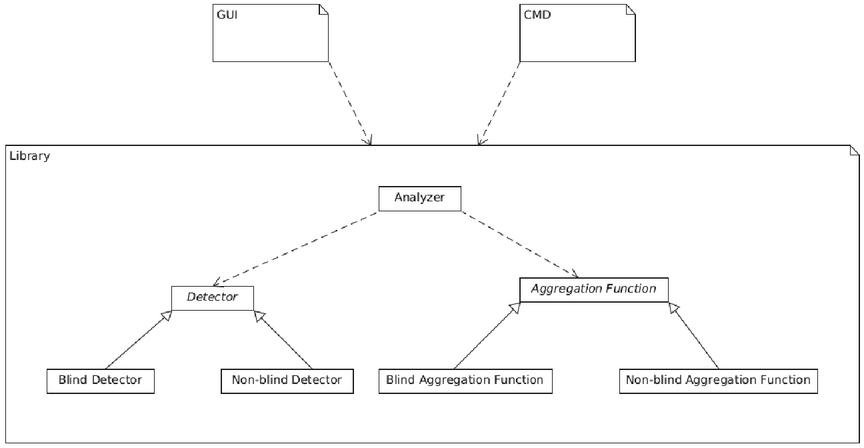
Figure 12 UML diagram of most important packages and classes.
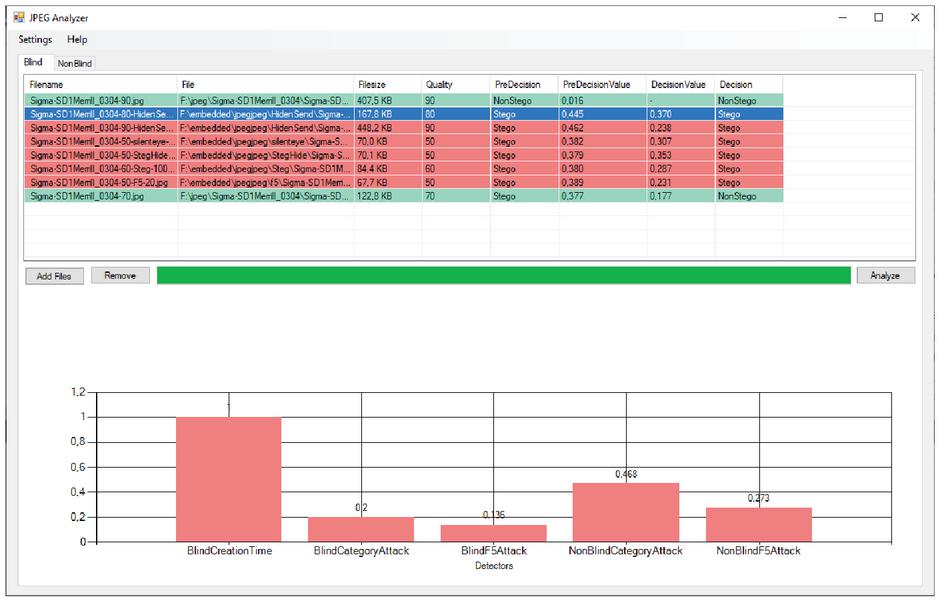
Figure 13 Exemplary application of our steganalysis strategy.
10 Summary
In this paper we have shown that by knowing an unaltered version of the same image, significant improvements in accuracy can be achieved, while maintaining the quality of the potential stego image and the quality of the original image are decisive. Using these two dimensions we were able to determine thresholds that allow an extraordinary separation of stego and cover images. Furthermore, we have shown that the results of individual analysis methods can be combined using different aggegation functions to achieve better results. The Average function has proven to be particularly helpful in blind applications. As it achieves good true positive rates, with reasonable true negative rates. The examined Min & Max functions acted like a baseline and accordingly classified all images as stego or non-stego. In the non-blind phase, the Accuracy Judge function was found to be the best option in a forensic scenario with the best true negative rate and an average accuracy of 84%. However, the Accuracy Voting function with a lower true negative rate showed a higher true positive rate. The Max function has the lowest true negative rate but the highest true positive rate and is therefor conceivable for other scenarios.
11 Future Work
In this work we have shown that, LSB matching and LSB replacement embeddings in JPEG images can significantly improve the accuracy by knowing a cover image. Even if the present cover image is not the actual cover image. It has been found that for JPEG images, the quality of the cover image and the difference in quality between the cover and stego image is crucial for recognition. In this paper we investigated the case where the cover image differed in quality. In particular, the Cover quality and the stego quality are selected so that the following applies: with . The following cases require further investigation:
• The quality levels below 50.
• , this case was not relevant for the scenario underlying this work. However, it could become relevant in other scenarios.
• Different dimensions in height and width . Subsequently the cases where the cover file was scaled down and then embedded into the cover file ( and ). Also the cases where the stego image is larger than the found cover image ( and ), but this is an unlikely case.
• The non-blind steganalysis of potential stego images edited with color filters. This is a conceivable scenario, for example, if a mobile phone is to be forensically examined. More and more often photos are taken with a mobile phone [9] and can be manipulated afterwards with various applications. Especially predefined color filters are offered for manipulation.
We implemented an analysis method of the file types as an example. It classifies JPEG images as unsuspicious and all other formats as suspicious. This behavior can be mapped to the usage statistics of the image formats of the channel under investigation. For example, if a memory card is examined, it could be assumed that it was used in a camera. JPEG is probably the most used image format for photos in most digital cameras and therefore not suspicious. The BMP format is rarely used to store photos due to the size of the images. Furthermore, due to its simple structure, BMP is supported by most stego software and is therefore more suspicious.
The non-blind analysis methods implemented in this work allow different ways of implementation. These still need to be investigated. For example an adjustment of the DCT coordinates depending on the cover or stego quality.
Furthermore, different analysis methods can be implemented such as the RS analysis or the Markov features from [17].
A machine learning approach should also be investigated, for example by training SVMs for each combination of cover quality and quality difference between stego and cover image.
Acknowledgment
This work has been funded by the German Federal Ministry of Education and Research (BMBF) in the Fraunhofer Cybersecurity Training Lab (LLCS).
Notes
1http://dde.binghamton.edu/download/
2https://github.com/b3dk7/StegExpose
4http://stegsecret.sourceforge.net/
5https://sourceforge.net/projects/ben4dstegdetect/
6The quality level is only considered in cases of stego images in JPEG format.
7With a cover quality of 60, only potential Stego images with quality 50 exist in our image corpus. It follows that the maximum value range is trivially fulfilled with a quality difference of 10 in this case.
9https://imagemagick.org/index.php
References
[1] Malte Arnsperger. Die spione aus der nachbarschaft. www.stern.de/panorama/stern-crime/russische-agenten-in-usa-enttarnt-die-spione-aus-der-nachbarschaft-3284138.html, 2010. Accessed: 2019-05-13.
[2] Charles Arthur. China and the internet: Tricks to beat the online censor. www.theguardian.com/world/2010/mar/25/china-internet-how-to-beat-censorship?intcmp=239, 2010. Accessed: 2019-05-25.
[3] I. Avcibas, N. Memon, and B. Sankur. Steganalysis using image quality metrics. IEEE Transactions on Image Processing, 12(2):221–229, Feb 2003.
[4] Benedikt Boehm. Stegexpose a tool for detecting lsb steganography, 2014.
[5] Jan Butora and Jessica Fridrich. Detection of diversified stego sources with cnns. Electronic Imaging, 2019(5):534–1–534–11, 2019.
[6] Mo Chen, Vahid Sedighi, Mehdi Boroumand, and Jessica Fridrich. Jpeg-phase-aware convolutional neural network for steganalysis of jpeg images. In Proceedings of the 5th ACM Workshop on Information Hiding and Multimedia Security, pages 75–84. ACM, 2017.
[7] Felix Disselhoff and Manuela Pfohl. Kalter krieg im hortensien-idyll. www.stern.de/panorama/stern-crime/russische-spione-in-den-usa-aufgeflogen-kalter-krieg-im-hortensien-idyll-3278380.html, 2010. Accessed: 2019-05-13.
[8] Larry Carter Eric Olson and Qingzhong Liu. A comparison study using stegexpose for steganalysis. International Journal of Knowledge Engineering, 3(1), June 2017.
[9] Flickr. Beliebteste kameras in der flickr community. https://www.flickr.com/cameras, 2019. Accessed: 2019-05-25.
[10] Jessica Fridrich, Miroslav Goljan, and Dorin Hogea. Attacking the outguess. In Proceedings of the ACM Workshop on Multimedia and Security, volume 2002. Juan-les-Pins, France, 2002.
[11] Jessica Fridrich, Miroslav Goljan, and Dorin Hogea. Steganalysis of jpeg images: Breaking the f5 algorithm. In Fabien A. P. Petitcolas, editor, Information Hiding, pages 310–323, Berlin, Heidelberg, 2003. Springer Berlin Heidelberg.
[12] SEAN GALLAGHER. Steganography: how al-qaeda hid secret documents in a porn video. arstechnica.com/information-technology/2012/05/steganography-how-al-qaeda-hid-secret-documents-in-a-porn-video. Accessed: 2019-05-10.
[13] Li Lin, Jennifer Newman, Stephanie Reinders, Yong Guan, and Min Wu. Domain adaptation in steganalysis for the spatial domain. Electronic Imaging, 2018(7):319–1–319–9, 2018.
[14] Arambam Neelima and Kh Manglem Singh. A short survey on perceptual hash function. ADBU Journal of Engineering technology, 1, 2014.
[15] LILY HAY NEWMAN. Mysterious ’muslimcrypt’ app helps jihadists send covert messages. https://www.wired.com/story/muslimcrypt-steganography/. Accessed: 2019-05-10.
[16] Yang Ou and Kyung Hyune Rhee. A survey on image hashing for image authentication. IEICE TRANSACTIONS on Information and Systems, 93(5):1020–1030, 2010.
[17] Tomás Pevný and Jessica J. Fridrich. Merging markov and dct features for multi-class jpeg steganalysis. In Security, Steganography, and Watermarking of Multimedia Contents, 2007.
[18] Martin Steinebach, Andre Ester, and Huajian Liu. Channel steganalysis. In Proceedings of the 13th International Conference on Availability, Reliability and Security, pages 1–8, 2018.
[19] Clement Fuji Tsang and Jessica Fridrich. Steganalyzing images of arbitrary size with cnns. Electronic Imaging, 2018(7):121–1–121–8, 2018.
[20] Andreas Westfeld and Andreas Pfitzmann. Attacks on steganographic systems. In Andreas Pfitzmann, editor, Information Hiding, pages 61–76, Berlin, Heidelberg, 2000. Springer Berlin Heidelberg.
Biographies

Niklas Bunzel received his B.Sc. and M.Sc. degrees in computer science and IT security from Technical University Darmstadt 2015 and 2020, respectively. He is currently a research scientist at Fraunhofer Institute for Secure Information Technology (SIT). His major research interests include artificial intelligence, IT security and steganography.

Martin Steinebach is the manager of the Media Security and IT Forensics division at Fraunhofer SIT. From 2003 to 2007 he was the manager of the Media Security in IT division at Fraunhofer IPSI. He studied computer science at the Technical University of Darmstadt and finished his diploma thesis on copyright protection for digital audio in 1999. In 2003 he received his PhD at the Technical University of Darmstadt for this work on digital audio watermarking. In 2016 he became honorary professor at the TU Darmstadt. He gives lectures on Multimedia Security as well as Civil Security. He is Principle Investigator at ATHENE and represents IT Forensics and AI Security. Before he was Principle Investigator at CASED with the topics Multimedia Security and IT Forensics. In 2012 his work on robust image hashing for detection of child pornography reached the second rank Deutscher IT Sicherheitspreis”, an award funded by Host Görtz.
Huajian Liu received his B.S. and M.S. degrees in electronic engineering from Dalian University of Technology, China, in 1999 and 2002, respectively, and his Ph.D. degree in computer science from Technical University Darmstadt, Germany, in 2008. He is currently a senior research scientist at Fraunhofer Institute for Secure Information Technology (SIT). His major research interests include information security, digital watermarking, robust hashing and digital forensics.
Journal of Cyber Security and Mobility, Vol. 10_1, 1–26.
doi: 10.13052/jcsm2245-1439.1011
© 2021 River Publishers