Fast Network Attack Modeling and Security Evaluation based on Attack Graphs
Received 3 February 2014; Accepted 27 April 2014; Publication 2 June 2014
Journal of Cyber Security, Vol. 3 No. 1 , 27–46.
doi: 10.13052/jcsm2245-1439.312
Copyright © 2014 River Publishers. All rights reserved.
Igor Kotenko and Andrey Chechulin
- Laboratory of Computer Security Problems, St. Petersburg Institute for Informatics and Automation of the Russian Academy of Sciences (SPIIRAS), 39, 14th Liniya, St. Petersburg, Russia {ivkote, chechulin}@comsec.spb.ru
Abstract
The paper suggests an approach to network attack modeling and security evaluation which is realized in advanced Security Information and Event Management (SIEM) systems. It is based on modeling of computer network and malefactors’ behaviors, building attack graphs, processing current alerts for real-time adjusting of particular attack graphs, calculating different security metrics and providing security assessment procedures. The novelty of the proposed approach is the use of special algorithms for construction, modification and analysis of attack graphs aimed at rapid security evaluation. This allows using this approach in SIEM systems that operate in near-real time. The generalized architecture of the Attack Modeling and Security Evaluation Component (AMSEC), as one of the main analytical components of SIEM systems, is outlined. The main components and techniques for attack modeling and security evaluation are defined. A prototype of the AMSEC is presented. Experiments with this prototype are evaluated.
Keywords
- network attack modeling
- attack graphs
- security evaluation
- near real time
- security information and event management
1 Introduction
In SIEM systems the security administrator should check whether network configuration parameters and security procedures provide the necessary security level. Moreover, at exploitation stage, a lot of security events and alerts have place, the configuration of computer networks can be changed, new vulnerabilities may be discovered, new attack exploits can be developed, new services are able to be added, etc. That’s why it is necessary continually to perform network monitoring, analyze available vulnerabilities, current security events and evaluate security level.
The main purpose of the presented work was to increase the speed of network security evaluation. To achieve this purpose an original set of models, algorithms and techniques was developed. The performance of the proposed technique, as it was demonstrated in experiments, allows using the results of this research in systems operating in near real time.
Key elements of suggested architectural solutions for network attack modeling and security evaluation in SIEM systems are using a comprehensive security repository, effective attack graph (tree) generation techniques, taking into account known and new attacks based on zero-day vulnerabilities, stochastic analytical modeling, and interactive decision support to choose preferred security solutions [12, 14–16].
This paper considers the state-of-the-art in network attack modeling and security evaluation based on attack graphs, the essence of the approach to analytical attack modeling as well as a generalized architecture of Attack Modeling and Security Evaluation Component (AMSEC) suggested in the EU MASSIF project [25].
The paper is structured as follows. Section 2 summarizes related work. The common framework for computer attack modeling and security assessment is presented in Section 3. A technique for attack graph construction and analysis is outlined in Section 4. Implementation issues are outlined in Section 5. Section 6 describes some experiments that we have carried out. The Conclusion summarizes the main results and suggests some future work.
2 Related Work
One of the fist descriptions of attack graphs was suggested by Schneier [4]. In this work the approach to manual construction of attack graphs was used for security evaluation. Each graph contains nodes that represent attacker’s aims and nodes that represents attack actions.
Moore et al. [1] proposed a structured and reusable tree-based form for attacks description and modeling. Swiler and Phillips [20] presented one of the first software tools for attack graph generation. Each node of attack graph modeled in this tool represents an attack state and edges specify the attacker’s actions.
Lippmann and Ingols [33] considered a tool that is used to construct and analyze automatically attack graphs for detection of firewall configuration defects and host critical vulnerabilities. Information about network vulnerabilities is collected by Nessus security scanner [30], and this information must be manually entered in the database.
Ingols et al. [18] extended this approach to take into account modern network attacks and countermeasures. Particularly, they suggest the improvements to model additional modern threats and countermeasures.
The list of papers in this area is very huge.
In addition to theoretical work, there are several software implementations of security evaluation systems based on different principles of security analysis. For example, Gamal et al [23] presented a security analysis system OpenSKE (Open Security Knowledge Engineered), which uses an expert system to assess security. The other example is CAULDRON [6], developed at George Mason University, which is also based on the construction and analysis of attack graphs.
The most common platform and vulnerability specifications are proposed by MITRE Corporation [27]: CPE[7], CVE[8], CVSS[9] and CAPEC [5].
Common Platform Enumeration (CPE) [7] provides a unified description language for information technology systems, platforms, and packages. It is based on the generic syntax for Uniform Resource Identifiers (URI). CPE contains a formal name format, a language for specifying complex platforms, a method for checking names against a system, and a description format for binding text and tests to a name.
Common Vulnerabilities and Exposures (CVE) [8] dictionary contains the list of known information security vulnerabilities and exposures. Each vulnerability/exposure has a unique identifier. This enables data exchange between different security products and gives an opportunity to evaluate different tools and services.
Common Vulnerability Scoring System (CVSS) [9] is an open and standardized vulnerability scoring system. CVSS gives an opportunity to prioritize and coordinate a reasonable response to security vulnerabilities via the base, temporal and environmental properties of vulnerability.
Usage of the National Vulnerability Database (NVD) [29] based on the CVE dictionary is the basis for constructing of attack graph via known vulnerabilities and Common Attack Pattern Enumeration and Classification (CAPEC) [5] provides data about attack patterns.
Important aspects of building a data repository, allowing promptly provide data for the security evaluation system based on attack graphs, are presented in [17].
Kheir et al. [28] propose to extend the use of CVSS metrics in the context of intrusion response, by supplying dynamic information about system configuration and service dependencies structured within dependency graphs.
Security metrics are an important element of the security evaluation system. From the system security level point of view a set of security metrics can be outlined: integral metrics of the common security level of system, metrics that define topological characteristics, malefactor characteristics and attack characteristics [3, 19, 32, 34, 35, 37].
The analysis of network security against unknown zero day attacks is also an important related topic of research [10, 21, 22, 24].
3 Common Framework
The Attack Modeling and Security Evaluation Component (AMSEC) is intended to complement the SIEM analysis functionality with the capability of network attack modeling and security evaluation [13, 14, 16].
The main inputs for AMSEC are:
- configuration of the computer network (system);
- policy determining a set of permissions or policy rules;
- event and alerts;
- external databases (DBs) of vulnerabilities, attacks, platform, etc.;
- possible malefactor profiles (as a set of malefactor characteristics);
- required values of security metrics (as a set of requirements to security).
The main results of AMSEC are as follows:
- vulnerabilities detected;
- possible routes (graphs) of attacks and attack goals;
- payload internal dependencies;
- bottlenecks (“weak places”) in network security;
- preliminary attack graphs;
- adjusted attack graphs based on changes in the network and alerts;
- predictions of the malefactor’s next steps taking into account the current situation;
- security metrics, which can be used for general security level evaluation of computer network (system) and its components;
- attack and countermeasures impacts;
- guidelines for increasing the security level and solutions based on security measures/policies/tools.
The general architecture of the AMSEC and its interaction with other components of SIEM system are shown in Figure 1. Connections, depicted in the figure, show the direction of interactions between different components.
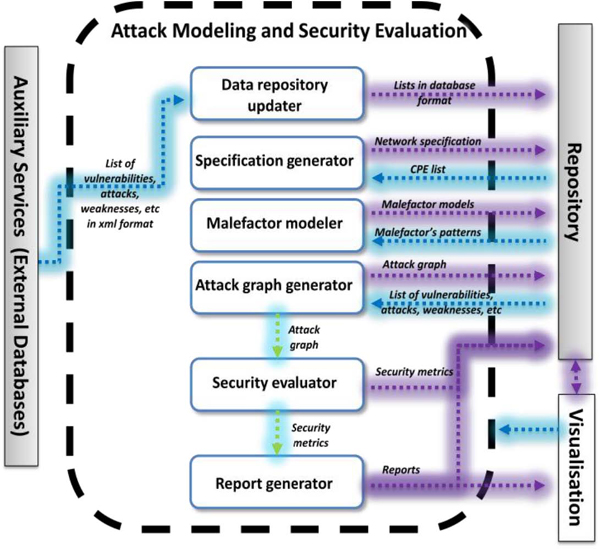
Figure 1 General architecture of AMSEC
Data repository updater downloads the open databases of vulnerabilities, attacks, configurations, weaknesses, platforms, and countermeasures from the external environment (sending requests to external databases for updates and communicating with data sources).
Specification generator converts the information about network events, configuration and security policy, from other SIEM components or from users, into an internal representation.
Malefactor modeler determines malefactors’ individual characteristics, skill level, their initial position (insider/outsider, available points of entry, etc.), the set of permissions, possible actions/attacks already fulfilled (which can be predicted according to events and alerts) and knowledge about the analyzed network.
It also recognizes the most probable malefactor model based on detected attacks and modifies the attack graph based on the changes of the network.
Attack graph generator builds attack graphs by modeling sequences of malefactor’s attack actions in the analyzed computer network using information about available attack actions of different types, services dependencies, network configuration and used security policy. Attack graph generator can also build attack traces taking into account zero-day vulnerabilities – unknown vulnerabilities which are required to compromise network assets.
Security evaluator assists the selection of solutions (validated events and alerts, possible future security events, countermeasures) needed for other SIEM components. It simulates stochastically multi-step attacks and studies the cost and effect of various countermeasures. For example, it generates combined objects and calculates their security metrics in order to evaluate the common security level and possibly make recommendations on strengthening it.
Report generator shows vulnerabilities detected by the AMSEC, represents “weak” places, generates recommendations on strengthening the security level and depicts other relevant security information.
The AMSEC operates in two main modes (Figure 2):
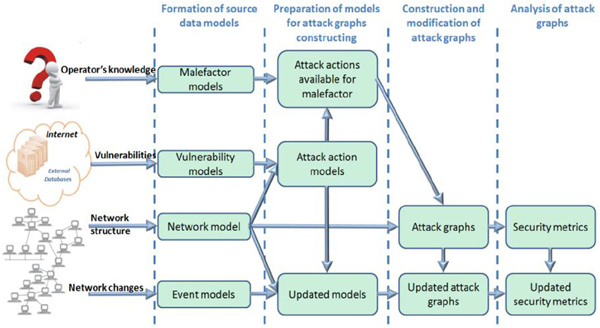
Figure 2 Main procedures of AMSEC
- Design time (or configuration), when the AMSEC is used for design and initial analysis of the network analyzed (or the system under protection). It is a non real-time mode;
- Exploitation, when the AMSEC is used for real-time or near real-time operation of the SIEM system.
Each of the modes may in turn be divided into the following steps (Figure 2):
- Creating initial data models;
- Preparation of the models for construction of attack graphs;
- Generation of attack graphs;
- Analysis of attack graphs.
The functionality of the AMSEC requires the presence of the vulnerability database loaded from the Internet as well as repository which will store the input and output data of the AMSEC. As external repository for the AMSEC the Common Repository is used.
The second component with which AMSEC has tightly integration is the Visualization Component.
Let us consider the main procedures of AMSEC and the interaction of the AMSEC with SIEM components on main modes.
Design (configuration) stage.
The AMSEC needs to have a detailed description of protected network topology and configuration for correct and efficient operation. This information is retrieved from the user (through the Visualization system), from predefined data (through Repository) and from sensors placed in the network. As a result, the AMSEC produces attack graphs and calculates security metrics.
Attack graphs can be used to refine event processing rules, and security metrics can be used for decision support and reaction to form the list of recommendations to increase the security level. Since at this stage real-time mode is not required, the information flow can go through the Repository.
Exploitation stage.
There are several tasks performed by the AMSEC at this stage: attack graphs adjustment; attack detection improvement by searching matches between real-time events and attack graphs; security metrics evaluation and prediction of potential threats and attacks.
4 Attack Graph Construction and Analysis Technique
We developed a set of algorithms of attack graphs construction, modification and analysis that can be implemented in various stages of a network lifecycle. The main steps of these algorithms are shown in Figure 3.

Figure 3 Representation of main steps of attack graph construction, modification and analysis algorithms
Blocks (1), (2) and (3) perform various tasks in the attack graphs construction and modification processes for the design and operation stages of the network lifecycle. Block (4) performs the analysis of attack graphs.
Let us consider the application of the algorithms for network lifecycle in more detail.
On the design stage the algorithms for construction and analysis of attack graphs are used. Blocks 1 – 3 perform the following steps to construct attack graph:
- The Block 1 generates a list of possible attack actions divided into groups according to the following parameters: attack class, required access and required knowledge level of the malefactor. For each group, in turn, a list of realizable specific attack actions and vulnerabilities is created.
- For each network’s host, Block 2 selects the attack actions that can be used by each malefactor model.
- On the basis of network host connections and available attack actions, Block 3 generates host accessibility connections taking into account available attack actions. These connections are constructed for all selected malefactor models.
- Based on accessibility connections, the Block 3 also forms the attack graphs for the initial access points for all malefactors.
On the exploitation stage the computer network represents a continuously changing object, i.e. its structure and the elements (e.g., hosts) may be changed over time. The computer network model and consequently attack models and their evaluation results also can be changed according with the changes in the real network. An important peculiarity of this stage is that the most of existing attack modeling systems may require a lot of time and resources for this kind of modeling more or less equal with the design stage.
On the exploitation stage the proposed modification algorithm uses different blocks according to a network’s change type. The possible network change types are as follows:
- change of network topology (adding or removing connections between network hosts);
- change in the hosts (adding, removing or changing of software and hardware, policies, etc.);
- adding, removing or changing of malefactor models;
- adding, removing or changing vulnerabilities.
For each type of change a subalgorithm is developed. It allows to minimize the time required for model updating.
There are three classes of changes grouped by impact on attack graphs:
- that do not affect the attack graph;
- that reduce the attack graph (for example, uninstalling of some software or hardware);
- that extend the attack graph (for example, installing of some vulnerable software or hardware).
Similarly, the changes are grouped by affecting to the available malefactor’s attack actions. This approach allows us to significantly reduce the models’ modification time.
A security evaluation often requires detailed analysis of all elements of the network model. Such an analysis can take a long time. Thus, the exact values of security metrics (for example, attack impact or common security level) may not be available after the beginning of the evaluation until some time.
To solve this problem, we propose the following approach: the security evaluation problem is represented as a series of algorithms with varying computational complexity. An example of block diagram illustrating this approach is shown in Figure 4. For this purpose, first of all, the structure and content of input data are changed.
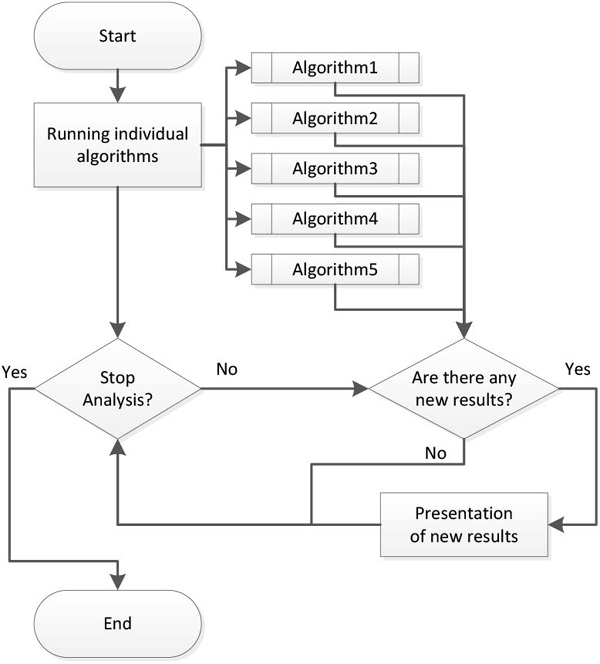
Figure 4 Block diagram of combining different approaches to security evaluation Implementation
The algorithms can use (in the order of increasing the complexity of the analyzed network model):
- a list of individual hosts, excluding topology;
- a simplified model of the network topology (subnets are grouped by the criticality level and presented in the form of integrated models);
- a complete network model including separate models for each object in the network.
For instance, for security evaluation based on the network model (1) the vulnerabilities of hosts are taken into account. In this case the network is considered insecure if at least one vulnerability with high-risk exists in the network. This approach allows us to define a secure network as a network that has no vulnerabilities. But if vulnerabilities on some hosts exist, the result of security evaluation is inaccurate, since the malefactor might not have access to these hosts.
Security evaluation based on a simplified topology (2) uses an approach similar to (1), but only for certain sub-networks. Thus, the attack graph is formed in a simplified form and comprises substantially fewer possible routes. This approach allows a more accurate security evaluation, but at the level of sub-networks has the same disadvantages as the first approach.
Security Evaluation (3), conducted on the basis of a complete network model, is the most accurate, but requires a much more time for analysis, since the attack graph as a rule will include a great number of attack routes.
5 Implementation
The prototype of Attack Modeling and Security Evaluation Component (AMSEC) is designed as an element of SIEM system. The prototype of AMSEC includes the following functional subsystems: data storage subsystem; generator of network and malefactor models; generator of attack graphs (working in the mode of construction and modification); data analysis subsystem [13, 14, 16].
The generator of random network models was implemented as a data source for the experiments. It allows shaping the input data, containing descriptions of interconnected hosts. The resulting models may contain the specifications of user and server (databases, application servers, etc.) hosts with different parameters of the stored information criticality.
To obtain data on real computer networks, we used the security scanner MaxPatrol [26]. This scanner has two main scanning modes: system (Audit) and network (PenTest). System scanning mode assumes that the special agent is installed on each host. This agent allows gathering all necessary information about the software and hardware of the host and possible vulnerabilities in the operating system settings and individual programs. Network scanning mode allows seeing the network through the eyes of the malefactor. In this mode, the scanner implements scanning from an external host and collects information available outside about each network host.
Information obtained in the system scanning mode:
- list of software (applications) and operating system components detected;
- list of vulnerabilities found in software (applications) and components of the operating system.
Information obtained in the network scanning mode:
- list of network services and protocols found;
- list of vulnerabilities found in network services and protocols.
The main standards used for processing of initial data are depicted in Table 1.
Table 1 Initial data representation formats
| Data | Format |
|---|---|
| Data about software and hardware of hosts | CPE (Common Platform Enumeration) [7] |
| Network topology | XML |
| Vulnerabilities | CVE (Common Vulnerabilities and Exposures) [8] |
| Malefactor model | XML |
| Data on attacks | CAPEC (Common Attack Pattern Enumeration and Classification) [5] |
| Security metrics | CVSS (Common Vulnerability Scoring System) [9] |
To implement the proposed approach we have built a distributed architecture based on the following products: AMSEC, application server Apache Tomcat [2], DBMS Virtuoso [36], and security scanner MaxPatrol [26]. Elements of the techniques suggested have been implemented as services running on the application server in Java [31].
The AMSEC visualization subsystem provides visual tools for input data configuring and presenting results of attack modeling and security evaluation.
Let us represent the Network Constructor dashboard of the AMSEC used to setup initial data (Figure 5). It is divided into four subviews [11].
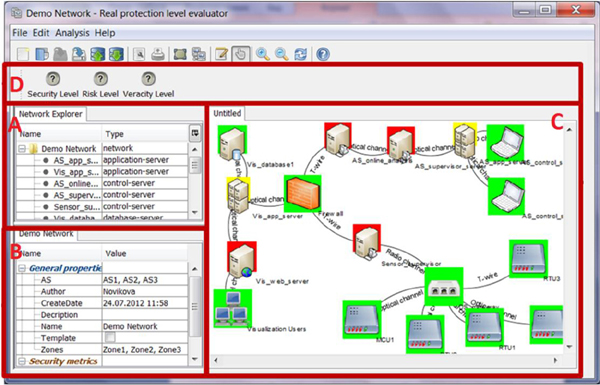
Figure 5 Network Constructor dashboard
The main view C shows the topology of the studied network, while the view A reflects the hierarchical structure of the network, depicting domains or specified network zones. The graph based techniques are used to represent network topology. Each network object is represented by an icon. The user has possibility to define icons for each type of the network objects. The background color of the icon is used to encode values of the security metrics calculated for the given host, such as Criticality, Mortality, Risk Level [13].
These metrics are chosen by the user from the predefined list. The brief information about each host is available via a tool tip which appears when mouse hovers over the network object.
The user can configure each host and network using the property view B. It can specify predefined properties of the host such as IP address, host type (web server, ftp server, database server, router, firewall, etc.), installed software and hardware, user-defined host criticality. These properties are necessary for attack graph generation. There is also a possibility to define user properties. This property view is updated whenever a particular state node is selected.
The view D shows the security metrics calculated for the network itself. As these metrics can have value from the predefined set of values {Low, Medium, Above Medium, High, Undefined}, they are presented in a form of the semaphore signal.
To depict the attack modeling results, we use graph based attack representation [11]. Each node of the graph denotes to specific attack action, and their order reflects the sequence of the malefactor actions: the nodes located on one level characterize actions that can be implemented simultaneously or independently from each other, while nodes located on different levels describe actions that are implemented in certain order.
The current version of the AMSEC prototype allows to use two levels of attack graph - network and host representation. At the first level, the graph is a visualization of a computer network with the transitions between hosts that indicate possible movements of malefactor. At the second level, the graph represents possible sequences of exploits (Figure 6).

Figure 6 Attack graph for one host
This view could be useful when using color encoding of the security metrics of the attack actions, providing general impression on the attack complexity or severity. The tree view is more traditional and convenient when identifying the sequence of the malefactor actions.
6 Case Study and Experiments
We performed several experiments with the prototype implemented to show the advantages of the proposed framework.
The network for the case study “Managed Enterprise Service Infrastructures” [25] was selected.
The attack modeling and security evaluation process contained the following steps:
- Preparation of data for constructing attack graphs (using source data collected from the network scanner);
- Analysis of vulnerabilities inherent to hosts (taking into account software and hardware installed on each host);
- Constructing attack graphs (based on data about attack actions available to the malefactor and about the network topology);
- Analysis of attack graphs and security evaluation (for each host and for the whole network).
Then the changes in the network were simulated (about 10% of network objects were completely updated) and all steps were carried out again.
As a platform for experiments we used a computer with Windows 7 Service Pack 1 x64-based on quad-processor Intel i5 2, 3 GHz with 4 GB of RAM.
Figure 7 shows the dependency between the time required for different steps of attack modeling and security evaluation process and the amount of hosts in the network. The source network was generated randomly with condition that each host should contain at least one vulnerable software.
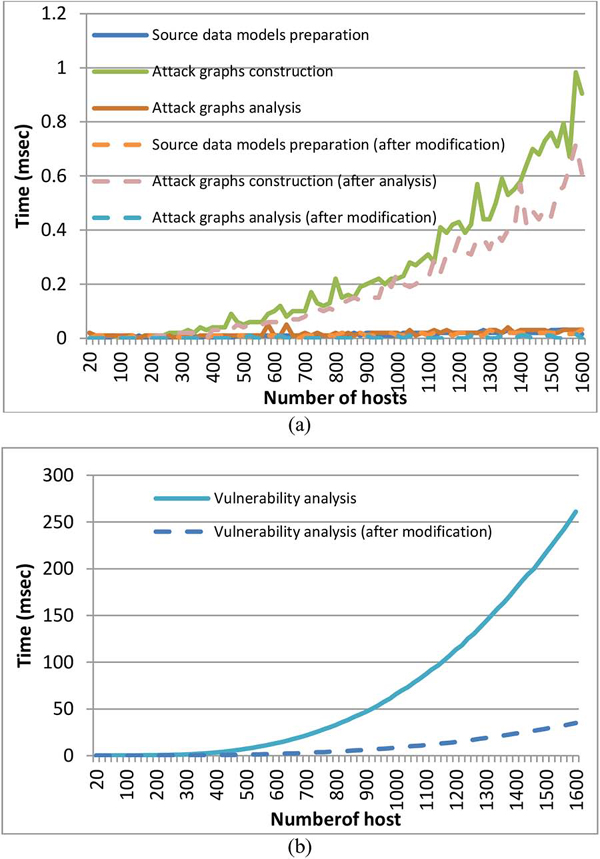
Figure 7 Approximate dependency between the time (sec) of AMSEC functioning and the number of hosts in the network
Experiments have shown that the vulnerability analysis (generation of possible attack actions) for hosts in the network is the most costly phase (in terms of execution time). Time spent on other phases does not exceed a few seconds.
The experimental results are averaged values. Analysis of these results gives an indication that the time required for construction and analysis of attack graphs for a computer network consisting of 1000 hosts does not exceed 2 minutes, and the time for complete renewal of 10% of hosts of the network (for this example it will be approximately 100 hosts) does not exceed 10 seconds. If the change affects only individual models (e.g. update of software on hosts), the necessary time can be greatly reduced. Thus, we can conclude that this approach can be used in systems that operate in near real time.
7 Conclusion
In the paper we presented the framework for computer attack modeling and security evaluation component (AMSEC). It outlines also the current prototype of the AMSEC on the whole and the implementation of the particular techniques for attack modeling and security analysis mechanisms. The AMSEC prototype was evaluated by several examples, and AMSEC successfully calculated the security metrics for them.
The results obtained make it possible to evaluate the security of computer networks in near real time, using techniques of analytical modeling of network attacks suggested in this paper. These results can be used to enhance the effectiveness of existing security mechanisms in SIEM systems.
All elements of attack modeling and security evaluation described in the paper will be considerably extended and detailed in the further research. Future research will be connected with enhancing of attack graphs building and analysis techniques. The analysis of the approach effectiveness assessment on real examples and extension of the set of security metrics will be performed.
8 Acknowledgment
This research is being supported by the grants of the Russian Foundation of Basic Research (13-01-00843, 13-07-13159, 14-07-00697, 14-07-00417), the Program of fundamental research of the Department for Nanotechnologies and Informational Technologies of the Russian Academy of Sciences (contract #2.2), and the project ENGENSEC of the TEMPUS program of the European Community.
References
[1] A. P. Moore, R. J. Ellison, and R. C. Linger, ‘Attack Modeling for Information Security and Survivability’, Technical Note CMU/SEI-2001-TN-001. Survivable Systems, 2001.
[2] Apache tomcat, http://tomcat.apache.org/
[3] B. A. Blakely, ‘Cyberprints Identifying cyber attackers by feature analysis’, Doctoral Dissertation: Iowa State University, 2012.
[4] B. Schneier, ‘Attack Trees – Modeling Security Threats’, Dr. Dobbs Journal, December, 1999.
[5] CAPEC. Common Attack Pattern Enumeration and Classification, http://capec.mitre.org/
[6] CAULDRON, http: //proinfomd.com/how.html.
[7] Common Platform Enumeration (CPE). http://cpe.mitre.org/
[8] Common Vulnerabilities and Exposures (CVE). http://cve.mitre.org/
[9] Common Vulnerability Scoring System (CVSS). http://www.first.org/cvss/
[10] E. Bursztein, ‘Extending Anticipation Games with Location, Penalty and Timeline’, LSV, ENS Cachan, CNRS, INRIA, France, 2008.
[11] E. Novikova, I. Kotenko, ‘Analytical Visualization Techniques for Security Information and Event Management’, Proceedings of the 21th Euromicro International Conference on Parallel, Distributed and network-based Processing (PDP 2013). Belfast, Northern Ireland. Los Alamitos, California. IEEE Computer Society, pp.519–525, 2013.
[12] I. Kotenko, A. Chechulin, ‘A Cyber Attack Modeling and Impact Assessment Framework’, Proceedings of the 5th International Conference on Cyber Conflict 2013 (CyCon 2013), IEEE and NATO COE Publications, Tallinn, Estonia, pp.119–142, 2013.
[13] I. Kotenko, A. Chechulin, ‘Attack Modeling and Security Evaluation in SIEM Systems’, International Transactions on Systems Science and Applications, Vol.8, December, pp.129–147, 2012.
[14] I. Kotenko, A. Chechulin, ‘Common Framework for Attack Modeling and Security Evaluation in SIEM Systems’, Proceedings of the 2012 IEEE International Conference on Green Computing and Communications, Conference on Internet of Things, and Conference on Cyber, Physical and Social Computing. Los Alamitos, California, IEEE Computer Society, pp.94–101, 2012.
[15] I. Kotenko, A. Chechulin, ‘Computer Attack Modeling and Security Evaluation based on Attack Graphs’, Proceedings of the IEEE 7th International Conference on “Intelligent Data Acquisition and Advanced Computing Systems: Technology and Applications” (IDAACS’2013), Berlin, Germany, pp.614–619, 2013.
[16] I. Kotenko, A. Chechulin, and E. Novikova, ‘Attack Modelling and Security Evaluation for Security Information and Event Management’, Proceedings of the International Conference on Security and Cryptography (SECRYPT 2012). Rome, Italy, pp.391–394, 2012.
[17] I. Kotenko, I. Saenko, O. Polubelova, A. Chechulin, ‘Design and Implementation of a Hybrid Ontological-Relational Data Repository for SIEM systems’, Future internet, vol.5, No.3, pp.355–375, 2013.
[18] K. Ingols, M. Chu, R. Lippmann, S. Webster, and S. Boyer. ‘Modeling modern network attacks and countermeasures using attack graphs’, Proceedings of the 2009 Annual Computer Security Applications Conference (ACSAC’09), Washington, D.C., USA, IEEE Computer Society, pp.117–126, 2009.
[19] K. J. S. Hoo, ‘How much is enough? A risk-management approach to computer security’, PhD thesis, Stanford University, CA, 2000.
[20] L. P. Swiler, C. Phillips, D. Ellis, and S. Chakerian, ‘Computer-Attack Graph Generation Tool’, Proceedings of the Second DARPA Information Survivability Conference & Exposition (DISCEX II), LosAlamitos, California, vol. II, pp. 307–321, 2001.
[21] L. Wang, A. Singhal, S. Jajodia, and S. Noel, ‘K-zero day safety: measuring the security risk of networks against unknown attack’, Proceedings of the 15th European conference on Research in computer security (ESORICS’10), Springer-Verlag Berlin, Heidelberg, 2010, pp.573–587.
[22] L. Williams, ‘GARNET: A Graphical Attack Graph and Reachability Network Evaluation Tool’, Proceedings of the 5th international workshop on Visualization for Computer Security, Springer-Verlag Berlin, 2008.
[23] M. M. Gamal, D. Hasan, A. F. Hegazy, ‘A Security Analysis Framework Powered by an Expert System’, International Journal of Computer Science and Security, vol.4, Issue 6, pp.505–526, 2011.
[24] M. McQueen, T. McQueen, W. Boyer, M. Chaffin, ‘Empirical estimates and observations of 0-day vulnerabilities’, Hawaii International Conference on System Sciences, 2009.
[25] MASSIF, 2013. Massif project, http://www.massif-project.eu
[26] MaxPatrol security scanner, http://ptsecurity.com/maxpatrol
[27] MITRE Corporation. http://mitre.org/
[28] N. Kheir, H. Debar, N. Cuppens-Boulahia, F. Cuppens, and J. Viinikka, ‘Cost evaluation for intrusion response using dependency graphs’, IFIP International Conference on Network and Service Security (N2S), IEEE, Paris, France, pp.1–6, 2009.
[29] National Vulnerability Database (NVD). http://nvd.nist.gov/
[30] Nessus scanner software. http://www.tenable.com/products/nessus
[31] Oracle Java SE? http://www.oracle.com/technetwork/java/javase/
[32] R. Dantu, P. Kolan, and J. Cangussu, ‘Network risk management using attacker profiling’, Security and Communication Networks, vol.2, No.1, pp.83–96, 2009.
[33] R. Lippmann, K. Ingols, ‘Validating and Restoring Defense in Depth Using Attack Graphs’, Proceedings of MILCOM 2006, Washington, DC, 2006.
[34] T. Olsson, ‘Assessing security risk to a network using a statistical model of attacker community competence’, Proceedings of the 11th international conference on Information and Communications Security, 2009, pp.308–324.
[35] The Center for Internet Security, The CIS Security Metrics, 2009.
[36] Virtuoso universal server, http://virtuoso.openlinksw.com/
[37] W. Kanoun, N. Cuppens-Boulahia, F. Cuppens, J. Araujo, ‘Automated reaction based on risk analysis and attackers skills in intrusion detection systems’, Proceedings of the third International Conference on Risks and Security of Internet and Systems (CRiSIS’08), Toezer, Tunisia, pp.117–124, 2008.
Biographies

Igor Kotenko is a professor of computer science and Head of Research Laboratory of Computer Security Problems of the St. Petersburg Institute for Informatics and Automation of the Russian Academy of Science. He graduated with honors from St.Petersburg Academy of Space Engineering and St.Petersburg Signal Academy, obtained the Ph.D. degree in 1990 and the National degree of Doctor of Engineering Science in 1999. He is the author of more than 200 refereed publications, including 12 textbooks and monographs. Igor Kotenko has a high experience in the research on computer network security and participated in several projects on developing new security technologies. For example, he was a project leader in the research projects from the US Air Force research department, via its EOARD (European Office of Aerospace Research and Development) branch, EU FP7 and FP6 Projects, HP, Intel, F-Secure, etc. The research results of Igor Kotenko were tested and implemented in more than fifty Russian research and development projects.

Andrey Chechulin received his B.S. and M.S. in Computer science and computer facilities from Saint-Petersburg State Polytechnical University, Saint-Petersburg, Russia, and PhD from St.Petersburg Institute for Informatics and Automation of the Russian Academy of Sciences (SPIIRAS). He is now a senior researcher at the Laboratory of Computer Security Problems of SPIIRAS. He is the author of more than 30 refereed publications. His primary research interests include computer network security, intrusion detection, analysis of the network traffic and analysis of vulnerabilities.