Evaluation and Analysis of Distributed Graph-Parallel Processing Frameworks
Received 15 June 2014; Accepted 20 August 2014 Publication 7 October 2014
Journal of Cyber Security, Vol. 3, 289–316.
doi: 10.13052/jcsm2245-1439.333
Copyright © 2014 River Publishers. All rights reserved.
Yue Zhao,1 Kenji Yoshigoe,1 Mengjun Xie,1 Suijian Zhou,1 Remzi Seker2 and Jiang Bian3*
- 1Department of Computer Science, University of Arkansas at Little Rock, Little Rock, AR 72204, USA
- 2Department of ECSSE, Embry-Riddle Aeronautical University, Daytona Beach, FL 32114, USA
- 3Department of Biomedical Informatics, University of Arkansas for Medical Sciences, Little Rock, AR 72205, USA
{yxzhao; kxyoshigoe; mxxie; sxzhou}@ualr.edu, sekerr@erau.edu, jbian@uams.edu (*Corresponding)
Abstract
A number of graph-parallel processing frameworks have been proposed to address the needs of processing complex and large-scale graph structured datasets in recent years. Although significant performance improvement made by those frameworks were reported, comparative advantages of each of these frameworks over the others have not been fully studied, which impedes the best utilization of those frameworks for a specific graph computing task and setting. In this work, we conducted a comparison study on parallel processing systems for large-scale graph computations in a systematic manner, aiming to reveal the characteristics of those systems in performing common graph algorithms with real-world datasets on the same ground. We selected three popular graph-parallel processing frameworks (Giraph, GPS and GraphLab) for the study and also include a representative general data-parallel computing system– Spark–in the comparison in order to understand how well a general data-parallel system can run graph problems. We applied basic performance metrics measuring speed, resource utilization, and scalability to answer a basic question of which graph-parallel processing platform is better suited for what applications and datasets. Three widely-used graph algorithms–clustering coefficient, shortest path length, and PageRank score–were used for benchmarking on the targeted computing systems. We ran those algorithms against three real world network datasets with diverse characteristics and scales on a research cluster and have obtained a number of interesting observations. For instance, all evaluated systems showed poor scalability (i.e., the runtime increases with more computing nodes) with small datasets likely due to communication overhead. Further, out of the evaluated graph-parallel computing platforms, PowerGraph consistently exhibits better performance than others.
Keywords
- Big data
- Graph-parallel computing
- Distributed processing
1 Introduction
Recent years have seen the exponential growth of scale and complexity of networks from various disciplines, sectors, and applications such as World Wide Web, social networks, brain neural networks, transportation networks and so on. These real-world networks are often modeled as graphs and studied by applying graph theories. It becomes increasingly important to gain insights and discover knowledge from those large, real-world networks, e.g., identifying critical nodes in information distribution by studying social networks and discovering biomarkers from gene regulatory networks and human brain connectome [13]. However, gigantic size of those graphs that consist of millions (or even billions) of vertices and hundreds of millions (or billions) of edges poses a great challenge to study them as effective parallelization of graph computations becomes the key.
There are many parallel computing paradigms–e.g., Message Passing Interface (MPI) [1], Open MultiProcessing (OpenMP) [2], MapReduce [3], and graph-parallel computing systems [4–6]–available for parallel processing. The general idea of parallelizing computational and/or data intensive tasks is to split a large computing job into multiple smaller tasks and distribute them onto multiple computing machines for parallel processing.
Traditionally, MPI has been very popular as it provides essential virtual topology, synchronization, and communication functionality between a set of processes (that have been mapped to computer nodes) in a language-independent way. MPI achieves these goals through standardizing message passing between processes on parallel computers. On the other hand, OpenMP provides shared memory parallelism with a set of compiler directives and library routines for Fortran and C/C++ programs. The learning curve for programming in MPI and OpenMP environments has been quite steep even after many helper software packages (e.g., PETSc [7]) have become available to ease the use of MPI. On the other hand, MapReduce [3] is significantly easier to learn because of a well-defined programming model. In MapReduce, nodes communicate through disk I/O (i.e., a shared distributed file system) while nodes in MPI exchanges data and states by message passing. Consequently, in general, MapReduce is more suitable for data-intensive tasks (data-parallelism) where nodes require little data exchange to proceed while MPI is more appropriate for computation-intensive tasks (task-parallelism) [8]. Moreover, the support of fault tolerance is a built-in feature in MapReduce, making application development more user-friendly, transparent and easy to debug.
Unfortunately, traditional data-parallel computing systems such as MapReduce [3] and Spark [9] cannot take advantage of the characteristics of graph-structure data and often result in complex job chains and excessive data movement when implementing iterative graph algorithms. In order to seek the leap of performance on processing graph data, numerous specialized graph-computing engines such as Pregel [14], and Graphlab [4–6] have been developed.
Effective parallelization of computing tasks can vary substantially depending on the characteristics of computation (e.g., task parallelism vs. data parallelism and fine-grained parallelism vs. coarse-grained parallelism vs. embarrassing parallelism). For example, MapReduce based frameworks are extremely good at solving SIMD (single-instruction, multiple-data) problems. Efficient parallelism arises by breaking a large dataset into independent parts with no forward or backward dependencies in each Map-Reduce pair. In contrast, parallelizing machine learning algorithms such as logistic regression and random forest requires a different computing model, as the algorithms are often iterative where future iterations have a high-level of data dependency over previous results. Running iterative algorithms using MapReduce is shown to incur excessive communications and hurt the performance [9]. A comprehensive understanding of the characteristics of different big data computing platforms through quantitative and qualitative measurements is necessary to understand their respective strengths in handling different types of computational tasks.
In this paper, we studied different distributed graph-parallel computing systems processing graph-structured data due to: 1) the growing importance and popularity of graph data in both industry and academia; and 2) better performance over data-parallel platforms reported in existing work for certain computation tasks [15, 16]. Our analyses aim to not only evaluate and compare the basic performance metrics (e.g., runtime, resource utilization, and scalability) of these systems, but also to present instructive experience for selecting the most appropriate data processing platforms based on characteristics of the applications and/or datasets. Spark [9, 10] was included in this study, as a representative of data-parallel processing systems, with the intent to better understand the difference between graph-parallel and data-parallel platforms. Our evaluation was conducted by executing three important graph-processing algorithms (i.e., PageRank, clustering coefficient and shortest path length) under the targeted systems (i.e., Spark [9, 10], Graphlab [4–6], GPS [17], Pregel/Giraph [14, 18]). The input data for the experiments are three graph-structured datasets extracted from real-world use with diverse characteristics and different scales in size.
The experiment results show that 1) comparing with Spark - a data-parallel processing system, graph-parallel computing platforms exhibited better performance in terms of graph computing rate and resource utilization; 2) PowerGraph outperformed others graph-parallel computing platforms under most evaluation cases; and 3) all evaluated graph-parallel computing systems exhibited different scalability on datasets with diverse scales in size.
The rest of the paper is organized as follows. Section 2 describes our design for evaluating and analyzing distributed graph-parallel computing platforms. Experiment results and analysis are presented in Section 3. Section 4 overviews related work, and Section 5 concludes this paper.
2 Design of experiments
In this section we detail the design of the experiments for evaluating distributed graph-parallel processing platforms. Our experiments focused on graph algorithms and graph-structured datasets as they were aimed to examine whether and how graph-parallel systems improve the efficiency of executing large-scale graph algorithms compared to general-purpose data-parallel systems. The experiment design essentially had three key considerations: 1) identifying performance metrics that system users are mostly concerned with; 2) selecting representative graph algorithms and real-world datasets of different scale; and 3) identifying representative graph-parallel computing systems. We conducted experiments on each of the selected parallel computing system, compared and analyzed the results in terms of both the quantitative performance metrics and qualitative user experiences of the systems.
2.1 Performance Metrics
The performance metrics we considered in the experiments are mainly from the perspective of an end user of a parallel computing platform. Nowadays big data computation jobs including those large-scale graph computations are quite likely to be executed in a computing cloud environment leased by the user. Obviously, the sooner the job completes and the less the resources are used, the better. Therefore, we chose metrics that measure data processing rate (speed) and resource utilization. We also studied the system scalability which is directly related to the processing rate.
1) Data Processing Rate: Data processing rate measures how quickly a distributed computing platform can process data and finish the execution of the computation job. We are interested in the overall runtime spent by the system on processing a particular dataset. The entire runtime consists of two parts: the data ingress time and job execution time. The former refers to the amount of time spent by the system from bootstrapping to the completion of data ingestion and the latter refers to the amount of time spent by the system in executing the computation job. Typically, in a distributed environment, the ingress time consists of the time for bootstrapping the computing cloud (or cluster) and the time for reading and partitioning the data and the ingress time is usually dominated by the latter.
2) Scalability: Scalability is the ability of a computing system to accommodate the growth of the amount of work by adding more computing resources (e.g., compute nodes) without changing the system itself. For distributed computing systems, a larger dataset usually indicates more computations. We studied the scalability of the selected distributed systems by examining: 1) the execution time of the same computation job with different size of dataset; and 2) the speedup achieved by using more compute nodes when dealing with the same dataset.
3) Resource Utilization: Resource utilization measures the degree of usage for each type of hardware and software resources (e.g., CPU, memory, file system cache, etc), which helps to understand the running behavior and efficiency of a computing platform. For a distributed computing system, the most concerned computing resources are CPU, memory, and network bandwidth. Thus, we selected the following metrics: CPU load, amount of consumed memory, and network I/O volume, to study the resource utilization of the targeted platforms.
In summary, the performance metrics studied in this work include data ingress time, job execution time, CPU load, memory consumption, and network I/O volume. Since the platforms we studied are distributed computing systems, the CPU load, memory consumption and network I/O volume are normalized by the number of computing nodes if not specified.
2.2 Benchmarking Datasets and Graph Algorithms
This section discusses the selected benchmarking datasets and graphs algorithms.
1) Benchmarking Datasets
We selected three graph datasets extracted from real-world social networks with diverse characteristics (e.g. graph density, average vertex degree (AVD), and directivity) and different scales (in terms of number of vertices and edges). We included both the directed and undirected graphs. Table 1 summarizes the datasets used in this study. Dataset G1, a sampled snapshot of the Facebook social graph obtained in 2009 [23], has the largest number of vertices and edges. Datasets G2 and G3 reflect LiveJournal friendship network (directed) and DBLP coauthorship network (undirected), respectively. Both of them are obtained from Stanford Network Analysis Project (SNAP)1. The graph density measures the proportion of the number of actual edges over the maximal possible number of edges. It is defined as 2| E| /(| V| (| V| -1)) for undirected graph and | E| /(| V| (| V| -1)) for directed graph. The average vertex degree is defined as | E| /| V| for directed graph and 2| E| /| V| for undirected graph.
Table 1 Summary of the experiment datasets

2) Graph Algorithms
Table 2 lists the three graph algorithms being studied. We chose those algorithms because they are basic graph algorithms and commonly used in network analysis studies. Those algorithms often are already implemented in distributed graph-parallel computing systems and used as the benchmarking algorithms to evaluate system performance in existing studies (e.g. [4][6]).
Table 2 Summary of the studied graph algorithms
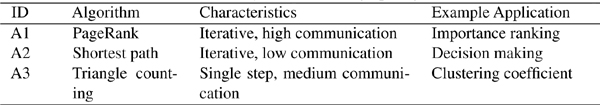
PageRank [19] and its variants such as Personalized PageRank [20] are effective methods for link prediction based on finding structure similarities between nodes in a network. Conceptually, the PageRank score of a node is the long-term probability that a random web surfer is at that node at a particular time step. For sufficiently long time, the probability distribution of the random walks on the graph is unique, that is, minor changes to the graph make the random walk transition matrix aperiodic and irreducible [21]. The computation of the PageRank score of a node v is an iterative process where the PageRank algorithm recursively computes the rank R(v) considering the scores of nodes u that are connected to v, defined as:
where α is the damping factor (see Langville et. al.’s “Deeper Inside PageRank” for a detailed and excellent description of the PageRank algorithm).
Topological features of a network can be quantitatively measured as network characteristics such as the clustering coefficient and characteristic path length. These structural network characteristics are often used to benchmark or infer the functional aspects of the network.
The clustering coefficient of a vertex expresses the chance of how likely its neighbors are also connected to one another. The (global) clustering coefficient is based on triplets of nodes, where a triplet consists of three nodes that are connected by either two (open) or three (closed) undirected ties. The global clustering coefficient is therefore defined as the fraction of the number of closed triplets over number of total connected triplets of vertices. Therefore, the method of calculating the global clustering coefficient is also often called triangle counting [22]. The clustering coefficient measures the degree of herding effect in a network (or network component), a larger coefficient value implies that nodes tend to create more tightly knit groups.
The characteristic path length is the average shortest path length in a network [22], which measures the average degree of separation between nodes in a network (or network component). Therefore, the shorter the length, the “easier” (or more likely) it can reach another node in a network.
The clustering coefficient and the characteristic path length are important network measures that are often used to determine the type of a network (e.g., random, small-world and scale-free). For example, Watts and Strogatz [22] coined the term “small-world” networks to categorize complex sparse real-life networks that have significantly high clustering coefficients than sparse random graphs yet have small degrees of separation (i.e., characteristic path length) between nodes.
2.3 Distributed Big Data Platforms and the Targeted Platforms
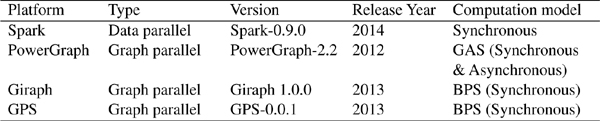
As this work focuses on the evaluation of graph-parallel processing platforms, we selected three systems that are recent and popular both in academia and industry. They are Giraph, GPS, and PowerGraph (the upgraded version of GraphLab). In addition, we also included a popular general-purpose data-parallel computing platform, Spark, into the study in order to understand the performance difference between a data-parallel computing platform and graph-parallel computing platform in executing a graph computation job. The general information of the computing platforms evaluated in this study is summarized in Table 3. Note that Spark, Giraph, and GPS use only synchronous computation mode while both synchronous and asynchronous modes are supported by PowerGraph and were tested in our experiments.
Table 3 Summary of the studied distributed computing platforms
1) Data-Parallel Computing System
Data-parallel computing systems use a simple programming model to process large-scale data. Whereby the data-parallelism feature, these systems support and implement a couple of fault-tolerance strategies and are highly scalable [24]. They are able to process data organized in any kinds of format, such as table and graph. Thus, data-parallel computing systems are also tagged as generic data processing systems [11]. MapReduce/Hadoop [3] and Spark [9] are the most popular representatives of data-parallel computing systems. Because literatures [9, 27] have demonstrated that Spark Mapreduce: simplified data processing on large clusters performs much better than Mapreduce/Hadoop in the big data processing rate and efficiency, we selected Spark, but not Mapreduce/Hadoop, as a representative of data-parallel computing systems to evaluate and analyze in this work.
Spark [9]: While retaining the fault tolerance and scalability of MapReduce Spark proposes three simple data abstractions: two restricted types of shared variables (broadcast variables and accumulators) and the resilient distributed datasets (RDDs). In particular, RDDs are read-only partitioned objects stored separately on a set of computing nodes. It can be rebuilt if a partition is lost. Spark can outperform Hadoop by 10x in executing time for iterative machine learning jobs. The graph analytic library, GraphX [24], on Spark efficiently formulates graph computation within the Spark data-parallel framework, and it exploits the special graph data structures such as vertex cuts, structural indices and graph-parallel operators.
2) Graph-Parallel Computing System
Graph-parallel platforms are designed and developed specially for processing graph data. In a graph-parallel computing system, the input of an algorithm is presented as a sparse graph G = {V, E}, and the computation is conducted by executing a vertex-program Q in parallel on each vertex v∈V. The vertex-program Q(v) can communicate with neighboring instances Q(u) where (u, v)∈E. For example, GraphLab [5] provides a shared data table (SDT), an associative map, to support globally shared information and Pregel [14] adopts message-passing model to exchange information among vertex-program instances [3]. In the following paragraphs we introduce the targeted graph-parallel computing systems evaluated in this work and demonstrate their characteristics to clarify the reason why we selected them.
PowerGraph [6]: GraphLab exhibits more competitive performance than others in graph processing [11, 15, 24]. Besides bulk-synchronous computation model GraphLab also supports asynchronous graph computation to alleviate the overhead induced by waiting for barrier synchronization. PowerGraph is a representative of GraphLab platform series [4, 5, 6, 28] and it is an open-source, distributed graph-specific computing system implemented in C++. Based on the primary distributed Graphlab [4] PowerGraph makes the following improvements. First, PowerGraph proposes a three-phase programming model, Gather, Apply and Scatter (GAS), for constructing a vertex-program. By directly exploiting the GAS decomposition to factor vertex programs over edges, PowerGraph eliminates the degree dependence of the vertex-program [6]. Second, PowerGraph incorporates the best features from both Pregel [14] and GraphLab [4]. Like GraphLab, PowerGraph adopts the shared-memory and data-graph view of computation that frees users from architecting a communication protocol for sharing information. PowerGraph borrows the commutative associative message combiner from Pregel, which reduces communication overhead in the Gather phase. At last, PowerGraph uses a vertex-cut approach to address the issue of partitioning power-law graphs [6]. Vertex-cutting can quickly partition a large power-law graph by cutting a small fraction of very high degree vertices.
Giraph [18]: Pregel [14] is a most popular and representative bulk synchronous parallel (BSP) computing system, in which all vertex-programs run simultaneously in a series of global super-steps. Many other state-of-the-art graph-parallel systems [17, 18, 29] derive from Pregel. Pregel employs message passing model to exchange information among vertex-computing instances. However, the source code of Pregel is not open and it is not feasible to evaluate it directly, thus we selected its public implementation: Giraph to evaluate in this work. Giraph inherits the vertex-centric programming model of Pregel and isan open-source, distributed graph-parallel processing platform. Giraph leverages the Map phase from Mapreduce/Hadoop and to achieve fault tolerance Giraph adopts the periodic checkpoints. Like Graphlab, Giraph is also executed in-memory, in which a whole graph needs to be imported into memory to process. Although this feature can accelerate the graph processing, it can also lead to crashes when there is not enough memory for large amounts of messages or big datasets.
GPS [17]: GPS is also an open-source distributed graph-parallel processing system. GPS is a Pregel-like system, with three new improvements: First, in order to make global computation more easily expressed and more efficient GPS proposes an extended API with an additional function: master.compute(); second, GPS proposes a dynamic repartitioning scheme, which reassigns vertices to other computing nodes during the job execution based on messaging patterns; and last, GPS conducts an optimization, which distributes adjacency lists of high-degree vertices across all compute nodes, to further improve the system performance.
In summary, we have considered the diversity in platform type and computing model, and the representativeness and novelty in similar systems as selecting standard consequently selecting one advanced data parallel platform and three most representative graph parallel platforms to evaluate and analyze in this work.
3 Experimental Evaluation and Analysis
3.1 Experiment Environment
Our experiments were conducted on a Linux-based cluster with 65 nodes (528 processors). The cluster consists of one front-end node that runs the TORQUE resource manager and the Moab scheduler and 64 computing (worker) nodes. Each computing node has 16 GB RAM and 2 quad-core Intel Xeon 2.66GHz CPUs. All the nodes share /home partition through NFS. Up to 48 nodes were used in our experiments.
3.2 Experiment Design, Results, and Analysis
We obtained the results of the targeted metrics mainly through two methods: extracting information from job execution logs and using Linux ps command. In particular, the data processing time and volume of network I/O were obtained from the job execution logs. And the ingress time information on GPS and Giraph also came from their job execution logs. However, to measure the ingress time in Spark and PowerGraph, we modified the source code of these systems. We essentially measured the time spent between the initiation of a job and the beginning graph computing phase. Further, memory consumption and CPU load were derived by averaging the snapshot results measured using the ps [30] command in Linux. We ran each experiment at least three times.
3.2.1 Applicability
An interesting observation from our study is that not all the tested platforms were able to handle all the datasets in the experiments. Only PowerGraph could successfully process the largest graph, G1. All other platforms (Spark, Giraph, and GPS) crashed2 while working on dataset G1. For PowerGraph, it also crashed when loading G1 under the asynchronous execution mode. The reason of the crashes is that the memory required by those systems for processing the graph exceeds the total amount of physical memory that the system can supply. In particular, GPS crashes when a large number of messages overwhelm the message queue kept by the message parser thread. For Giraph, the memory on one particular worker node is exhausted during the graph loading phase. For PowerGraph asynchronous engine execution mode, if the number of graph partitions is large, the messages exchanged among the partitions will explode and exhaust the memory of computing nodes. Spark crashes due to the overflow of the Java heap space during the shuffle phase. Even in each node we increased the size of heap space up to almost equal to the size of the memory capability of that node (16GB) the crash still persisted.
3.2.2 Data Processing Rate
We measured the time spent on processing the datasets. As mentioned in Section 2 we measured both the ingress time and the computing time for a graph computation job.
Ingress Time: The default graph loading strategy of Giraph and GPS is multi-loading, that is, each computing node loads its part in parallel. In contrast, the default graph loading strategy of PowerGraph is single-loading, in which the master reads the graph file from disk and distributes the graph to computing nodes. To be consistent with the graph loading strategy of Giraph and GPS, we configured PowerGraph to also use multi-loading strategy. Two data partitioning methods–random partitioning and oblivious partitioning–are available for PowerGraph and we tested both.
Figure 1 shows the ingress time for datasets G2 and G3 on each tested platform. There is no ingress time data available for G1 as our tested platforms crashed during data loading. We can clearly see in the figure that the ingress times of those graph-parallel processing platforms decrease when adding more computing nodes for medium-size graph G2 while they keep almost constant for small-size graph G3. For these graph-parallel processing platforms, the ingress time consists of the time for reading and partitioning the data and the time for system setup. When the dataset is large and multi-loading strategy is employed, increase of nodes increases the degree of parallelism, effectively reduces the workload of data reading and partitioning on each node, and therefore reduces the overall ingress time. For small graphs, the graph loading time is negligible and ingress time is mainly determined by the system setup time, which stays approximately the same when more nodes are added.
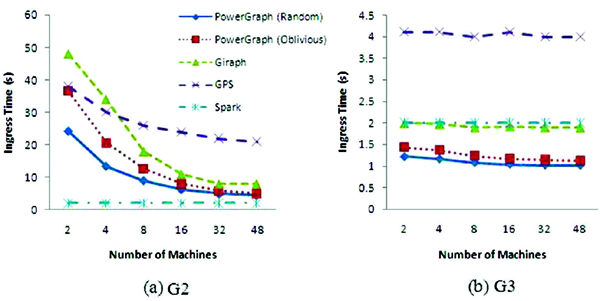
Figure 1 Ingress time for different dataset on each platform
Another interesting observation is that the ingress time of Spark is fairly small in all cases and its curve keeps flat for both G2 and G3. Unlike the three evaluated graph-parallel processing platforms that need to load the entire graph into memory before running any graph computation job, Spark does not need to wait for the whole graph being loaded into memory. Instead, Spark begins its data computing immediately after part of the data is available in memory. The ingress time of Spark actually records the time for loading partial graph instead of the entire graph. Thus the ingress time of Spark is small and remains constant even though more nodes are added.
Graph Computing Time:
Figures 2–4 show the computing time results of each platform for three selected graph algorithms with different dataset and number of computing nodes. Note that, the triangle counting algorithm implemented in PowerGraph does not support the asynchronous execution mode. Thus our results do not include those results of triangle counting under asynchronous mode in PowerGraph. Since all the platforms except PowerGraph were not able to handle G1 dataset, we only show the PowerGraph results on G1 in those figures. PowerGraph exhibits different execution times when it is configured with synchronous communication mode and asynchronous communication mode (the ingress times in both modes are the same). Due to the excessive memory usage incurred by asynchronous communications, we were only able to run PageRank and SSSP algorithms on PowerGraph in synchronous communication mode with G1 on 2, 4, and 8 computing nodes and show their results in Figures 2 and 3.
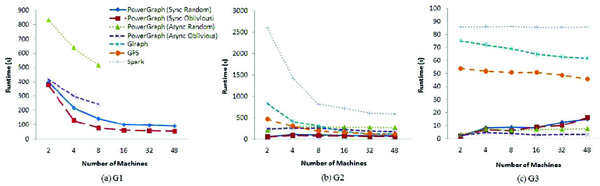
Figure 2 Computing time of PageRank
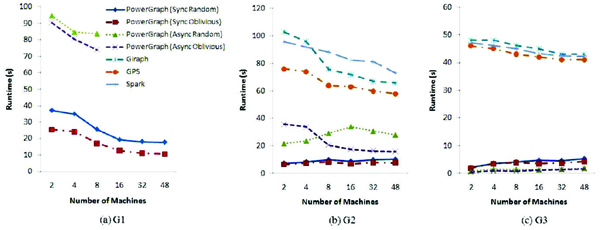
Figure 3 Computing time of single source shortest path (SSSP)
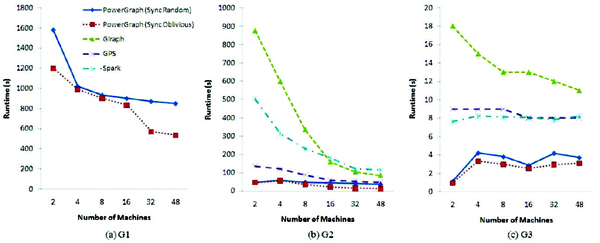
Figure 4 Graph computing time of triangle counting
For PageRank, Spark always performs worse than other platforms in terms of computing time. The main reason is that Spark has a significant I/O between two continuous iterations and suffers a heavy shuffle phase between the map and the reduce phases. The implementations of single-source shortest path (SSSP) and triangle counting algorithms we used for Spark come from the graph analytic library supplied by Spark. The graph analytic library on Spark efficiently formulates graph computation within the Spark data-parallel framework, and it exploits the special graph data structures such as vertex cuts, structural indices and graph-parallel operators [24]. Thus, for SSSP and triangle counting algorithms, the graph computing time results of Spark are more competitive.
For all three algorithms and three datasets PowerGraph exhibits the best performance in graph computing time. One of the reasons for PowerGraph’s superior performance can be attributed to its highly optimized C++ implementation. All other platforms use Java as the development language. Another reason is that Giraph, GPS and Spark all use Hadoop MapReduce-like resource scheduling mechanism, which induces substantial overhead especially when the graph is small [24].
Because asynchronous mode incurs more communications than synchronous mode, PowerGraph (v2.2) cannot achieve runtime gain from asynchronous mode under the experiment environment of this work. For dataset G2 and G3 which are relatively small graphs, PowerGraph does not achieve better runtime when increasing the number of computing nodes. The runtime even increases when more machines are used. The reason is that PowerGraph splits the high-degree vertices across partitions, which incurs the overhead due to the joins and aggregations required for coordinating vertex properties across partitions [24]. When the size of graph is small, the synchronization overhead exceeds the benefit obtained from workload distribution. For the largest dataset G1 PowerGraph exhibits good scalability for all the algorithms. For other platforms, their scalability becomes more evident when the dataset is relatively large. Consequently, distributed data processing platforms are more suitable for processing large size of data, which is especially true for PowerGraph.
3.2.3 Resource Utilization
In order to understand the resource utilization of the targeted platforms, we collected network I/O, CPU load, and memory usage of the jobs executed on the selected platforms.
Network I/O: We measured the overall volume of network traffic (in unit of GB) generated by each platform when executing each of the three algorithms. Both G2 and G3 were tested. Results for PageRank, SSSP, and triangle counting are depicted in Figures 5, 6, and 7, respectively. As shown in those figures, in general, the more nodes are employed (i.e., the more partitions are generated), the more communications are incurred, which is reflected by rising curves in the figures. One notable exception to this pattern is the network traffic generated by Giraph, which remains fairly constant across different datasets and number of nodes for all three different algorithms. Relative lower communication overhead growth rate with more machines being used is one of the reasons why Giraph can achieve a better scalability on graph computing time than other platforms.
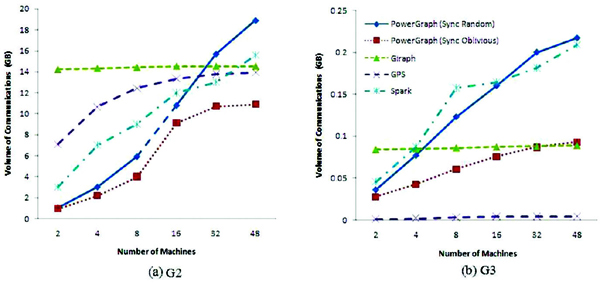
Figure 7 Network I/O of triangle counting
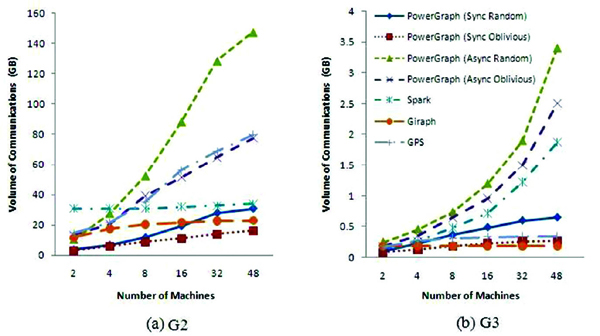
Figure 5 Network I/O of PageRank
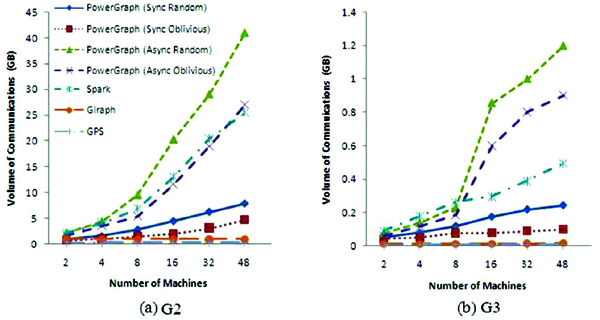
Figure 6 Network I/O of SSSP
Among the evaluated platforms the asynchronous PowerGraph suffers the largest communication overhead especially when the number of machines used becomes large. Because there is no synchronization between each round of computing, asynchronous PowerGraph needs to launch more communications to synchronize the vertex properties across partitions, which may account for the fact that the graph processing rate of PowerGraph in the asynchronous mode is worse than that in the synchronous mode.
Memory Consumption: We measured the average memory consumption of each platform for running PageRank, SSSP, and triangle counting algorithms with datasets G2 and G3 and show their results in Figures 8–10. As shown in the figures, the more machines participate in the computing, the more memory each job will consume. Similar to the results in graph computing time, compared with other platforms, Spark consumes relatively more memory resource for PageRank algorithm. But its graph analytic library performs much better in memory usage. It is similar that the graph analytic library outperforms the raw Spark in the CPU resource utilization, which is presented in the following section. The reason is that the graph-parallel systems only conduct the operation related to the activated vertices in each iteration. This feature help to reduce the memory consumption for graph-parallel systems.
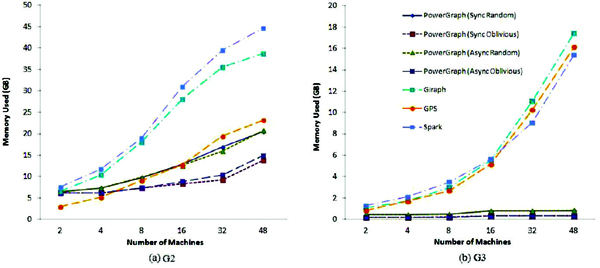
Figure 8 Memory used by PageRank
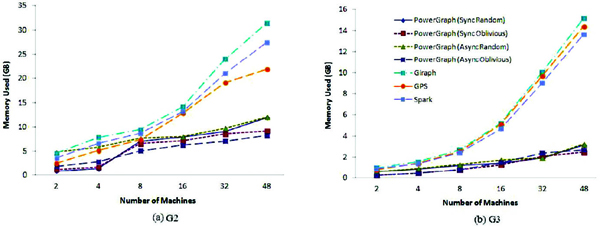
Figure 9 Memory used by SSSP
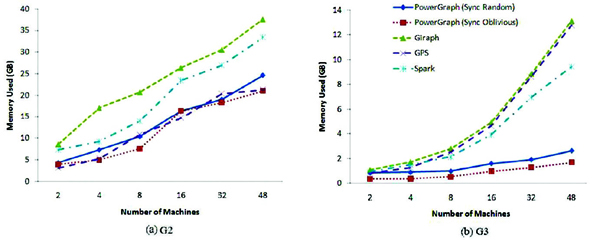
Figure 10 Memory used by triangle counting
CPU Load: We measured the average CPU load of all computing nodes involved in the execution of each algorithm for each platform. In particular, we first sampled the CPU load of each computing node every second and calculated the average of the samples. Then, we averaged these CPU load values of all computing nodes. As the results of each platform exhibited similar trends for G1 and G2, only the results for G1 are presented.
Figure 11 depicts the variation of CPU load with the increase of computing nodes. It is clear that with the increase of the number of machines used, the CPU load of each machine goes down evidently. This is expected as more machines process the graph in parallel, the computation workload distributed to each machine decreases. On the contrary, there is more CPU idle time induced by waiting for data transmission among machines.
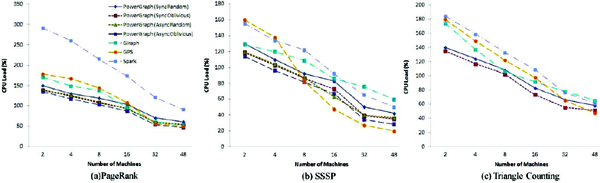
Figure 11 CPU Load for G2
Spark consumes more CPU time during job execution for all three algorithms (and for all datasets). One of the reasons for the high CPU load is that the ingress time for Spark is much shorter than those for other platforms. The operations during ingress time are mainly for loading the graph data from disk and configuring the running environment, which incur minor CPU utilization. Among graph-parallel processing systems, PowerGraph runs faster than others with lower CPU load. And its CPU load in asynchronous mode is lower than that in synchronous mode. The relatively low CPU load in asynchronous mode coincides with the relatively high communication overhead, which suggests that PowerGraph has more idle CPU in asynchronous mode due to more network communications occurred during graph processing.
4 Related Work
Many previous works [11, 15, 17, 24, 25, 26] have conducted performance evaluation of distributed graph-parallel computing platforms as well. Study [11] presented a detailed and real-world performance evaluation of six representative graph-processing systems (i.e., (Hadoop, YARN, Stratosphere, Giraph, GraphLab, and Neo4j) aiming to facilitate platform selection and tuning for processing tasks in Small and Medium Enterprise (SME) environment where computing resources are limited. In [15], the authors presented an evaluation of big data processing frameworks and provided a comparison between MapReduce and graph-parallel computing paradigms. However, its analysis is limited to the k-core decomposition problem. A number of other works [17, 24, 25, 26] have proposed new computing platforms and conducted evaluation of a few graph-parallel computing systems to prove the effectiveness of the new platforms. Thus, in terms of evaluation, these work are diverted from conducting a comprehensive evaluation and analysis of graph-parallel processing systems. In all these existing works, studies on the following two aspects are inadequate. First, in contrast to bulk synchronous computing model, asynchronous computing model has been recently proposed for graph processing. Existing works leave out thorough comparison and analyses of the performance exhibited by these two different computing models. Second, these existing works do not attach importance to explore and analyze the performance impact of the scale of datasets on distributed graph-parallel processing systems. Although some of their evaluations used different sized datasets, they failed to answer some interesting and important problems such as “Is it suitable to use a distributed computing system to process relatively small datasets?” and “What are the different performance characteristics when processing a large and a relative smaller dataset, respectively?”. The answers to these questions can be valuable reference to users for platform selection. By conducting a comprehensive evaluation and analysis on the most concerned performance aspects of representative platforms, we seek to find the answers to these questions.
5 Conclusion
In this work, we performed a comprehensive evaluation of several popular graph-parallel computing platforms aiming to facilitate platform selection and tuning. For completeness, we also compared the performance of these graph-parallel systems with a popular data-parallel processing platform, Spark. We found that graph-parallel computing platforms outperform general data-parallel systems on both graph computing rate and resource utilization for processing graph-structured data. However, Spark uses less ingress time than graph-parallel systems when the sizes of the graphs are large. Further, all systems evaluated in this work exhibit better scalability on large dataset compared with small dataset. With an optimized C++ implementation and a sophisticated modular scheduling mechanism, PowerGraph exhibits a better graph processing rate than other graph-parallel computing platforms. Furthermore, PowerGraph has an intelligent graph partitioning strategy, which coordinates the vertices distribution among machines, improves both the execution efficiency and resource utilization. However, we found that the asynchronous computing mode proposed by PowerGraph does not bring improvement in performance in our experiments. Moreover, Giraph can achieve a better scalability on graph computing time than other platforms due to its relatively lower communication overhead growth rate when more machines are used. However, its graph computing rate is slower than PowerGraph and GPS.
6 Acknowledgment
This work was supported in part by the National Science Foundation under Grant CRI CNS-0855248, Grant EPS-0701890, Grant EPS-0918970, and Grant MRI CNS-0619069.
References
1. Forum, M.P., MPI: A Message-Passing Interface Standard. 1994, University of Tennessee.
2. Dagum, L. and R. Menon, OpenMP: An Industry-Standard API for Shared-Memory Programming. IEEE Comput. Sci. Eng., 1998. 5(1): p. 46–55.
3. Dean, J. and S. Ghemawat, MapReduce: simplified data processing on large clusters. Commun. ACM, 2008. 51(1): p. 107–113.
4. Low, Y., et al., Distributed GraphLab: a framework for machine learning and data mining in the cloud. Proc. VLDB Endow., 2012. 5(8): p. 716–727.
5. Low, Y., et al., Graphlab: A new framework for parallel machine learning. arXiv preprint arXiv:1006.4990, 2010.
6. Gonzalez, J.E., et al., PowerGraph: distributed graph-parallel computation on natural graphs, in Proceedings of the 10th USENIX conference on Operating Systems Design and Implementation. 2012, USENIX Association: Hollywood, CA, USA. p. 17–30.
7. Katz, R.F., et al., Numerical simulation of geodynamic processes with the Portable Extensible Toolkit for Scientific Computation. Physics of the Earth and Planetary Interiors, 2007. 163(1–4): p. 52–68.
8. Chen, W.-Y., et al., Parallel spectral clustering in distributed systems. Pattern Analysis and Machine Intelligence, IEEE Transactions on, 2011. 33(3): p. 568–586.
9. Zaharia, M., et al., Spark: cluster computing with working sets, in Proceedings of the 2nd USENIX conference on Hot topics in cloud computing. 2010, USENIX Association: Boston, MA. p. 10–10.
10. Zaharia, M., et al., Resilient distributed datasets: a fault-tolerant abstraction for in-memory cluster computing, in Proceedings of the 9th USENIX conference on Networked Systems Design and Implementation. 2012, USENIX Association: San Jose, CA. p. 2–2.
11. Guo, Y., et al. How well do graph-processing platforms perform? an empirical performance evaluation and analysis.
12. Scott, J. and P.J. Carrington, The SAGE handbook of social network analysis. 2011: SAGE publications.
13. Newman, M., Networks: An Introduction. 2010: Oxford University Press, Inc. 720.
14. Malewicz, G., et al., Pregel: a system for large-scale graph processing, in Proceedings of the 2010 ACM SIGMOD International Conference on Management of data. 2010, ACM: Indianapolis, Indiana, USA. p. 135–146.
15. Elser, B. and A. Montresor. An evaluation study of Big Data frameworks for graph processing. In Big Data, 2013 IEEE International Conference on. 2013.
16. Guo, Y., et al., Towards Benchmarking Graph-Processing Platforms.
17. Salihoglu, S. and J. Widom. Gps: A graph processing system. in Proceedings of the 25th International Conference on Scientific and Statistical Database Management. 2013. ACM.
18. The Apache Software Foundation. Apache Giraph. 2014 cited 2014; Available from: http://giraph.apache.org/.
19. Page, L., et al., The PageRank citation ranking: Bringing order to the web. 1999.
20. Haveliwala, T., S. Kamvar, and G. Jeh, An analytical comparison of approaches to personalizing PageRank. 2003.
21. Langville, A.N. and C.D. Meyer, Deeper inside pagerank. Internet Mathematics, 2004. 1(3): p. 335–380.
22. Watts, D.J. and S.H. Strogatz, Collective dynamics of ‘small-world’networks. nature, 1998. 393(6684): p. 440–442.
23. Minas Gjoka, Maciej Kurant, Carter T. Butts and Athina Markopoulou, Walking in Facebook: A Case Study of Unbiased Sampling of OSNs, Proceedings of IEEE INFOCOM ’10, San Diego, CA, 2010.
24. Crankshaw, Daniel, Ankur Dave, Reynold S. Xin, Joseph E. Gonzalez, Michael J. Franklin, and Ion Stoica, The GraphX Graph Processing System.
25. D. Gregor and A. Lumsdaine, “The Parallel BGL: A Generic Library for Distributed Graph Computations,” POOSC, 2005.
26. K. Kambatla, G. Kollias, and A. Grama, “Efficient Large-Scale Graph Analysis in MapReduce,” in PMAA, 2012.
27. M. Zaharia, M. Chowdhury, T. Das, A. Dave, J. Ma, M. McCauley, M. Franklin, S. Shenker, and I. Stoica. Fast and interactive analytics over Hadoop data with Spark. USENIX; login, 37(4), 2012.
28. Yue Zhao, Kenji Yoshigoe, Mengjun Xie, Suijian Zhou, Remzi Seker, and Jiang Bian, LightGraph: Lighten Communication in Distributed Graph-Parallel Processing, in Proceedings of the 3rd IEEE International Congress on Big Data (BigData 2014), Anchorage, Alaska, USA, 2014.
29. POWER, R., AND LI, J. Piccolo: building fast, distributed programs with partitioned tables. In OSDI (2010).
30. http://en.m.wikipedia.org/wiki/Ps_(Unix)
Biographies

Yue Zhao received his B.S and M.S. degree in Computer Science and Technique in 2006 and 2009, respectively, from Jilin University. Currently he is a Ph.D candidate in Integrated Computing program at University of Arkansas at Little Rock. His research interest includes big-data analytic, distributed computing, High performance computing, and wireless network.

Kenji Yoshigoe is an Associate Professor in the Department of Computer Science and the Director of Computational Research Center (CRC) at UALR. He received his Ph.D. degree in Computer Science and Engineering from the University of South Florida. He is currently investigating the reliability, security, and scalability of various interconnected systems ranging from tightly coupled high performance computing systems to resource-constrained wireless sensor networks

Mengjun Xie is an Assistant Professor in the Department of Computer Science at the University of Arkansas at Little Rock. He received his Ph.D. degree in Computer Science from the College of William and Mary. His research interests include cyber security, information assurance, mobile computing, and big data analytics.

Suijian Zhou is a Postdoctoral Researcher in the Department of Computer Science at UALR. He received his Ph.D degree in Particle Physics from the Institute of High Energy Physics in China. He participated in the Atlas Grid Computing project at CERN and the IGE Grid Computing project in Sweden during the past few years. He is interested in the Big Data analysis and Cloud Computing techniques.

Remzi Seker is a Professor in the Department of Electrical, Computer, Software, and Systems Engineering at Embry-Riddle Aeronautical University at Daytona Beach, Florida. He received his Ph.D. degree in Computer Engineering from the University of Alabama at Birmingham. His research interests are safety and security critical systems and computer forensics. He is co-author of one of the first papers that was published on Mobile Phishing, and possible techniques for preventing it.

Jiang Bian received the M.S. degree in Computer Science in 2007 and his Ph.D. degree in Integrated Computing in 2010 both from University of Arkansas at Little Rock, Little Rock. He is currently an Assistant Professor of Biomedical Informatics at University of Arkansas for Medical Sciences, Little Rock. His research interest includes big-data analytic, network science, machine learning, and knowledge discovery and representation.
1http://snap.stanford.edu/data/
2We conducted experiments with 16, 32, 48 computing nodes and system crash occurs in all of those experiments.