Measurable Security, Privacy and Dependability in Smart Grids
Received: 1 December 2014; Accepted: 2 February 2015;
Publication: 3 April 2015
Josef Noll1, 2, Iñaki Garitano2, Seraj Fayyad1, 2, Erik Åsberg3 and Habtamu Abie4
- 1University of Oslo, Oslo, Norway,
- 2UNIK, Kjeller, Norway,
- 3eSmartSystems, Halden, Norway,
- 4Norwegian Computing Centre (NR), Oslo, Norway
{josef, igaritano, seraj}@unik.no; erik.aasberg@esmartsystems.com; habtamu.abie@nr.no
Abstract
This paper presents a methodology for assessing security, privacy and dependability (SPD) of embedded systems. The methodology, developed through the European collaboration SHIELD, is applied for the smart grid network as deployed in the South of Norway. Three Smart Grid use cases are analysed in detail, being billing, home control and alarm.
The SHIELD methodology uses a Multi-Metrics approach to evaluate the system SPD level during running processes and compares it with use case goals for S, P, and D. The simplicity, applicability, and scalability of the suggested Multi-Metrics approach is demonstrated in this paper. It shows that a single configuration is not sufficient to satisfy the given goals for all use cases.
Keywords
- Smart Grid
- Security
- Privacy
- Dependability
- Embedded Systems
- Internet of Things
- Measurable Security
- Advanced Metering Infrastructure
- AMI
1 Introduction
Our society is built and driven by Embedded Systems (ESs), ranging from low-end systems, such as smart cards, to high-end systems, like routers and smart phones. ESs thus constitute one of the key elements of the Internet of Things [1]. The technological progress produced several effects, such as the power and performance boost of ESs. Hence, their capabilities and services have raised, and in consequence, their usage has been substantially increased.
Together with the evolution of performance, energy consumption and size, ESs jump from isolated environments to interconnected domains. Although the evolution of connectivity enlarges the number of possible services, at the same time it increases the attackability of this kind of systems. When isolated, ESs were hard to attack, since attackers need to have physical access. However, the open connection towards Internet makes them vulnerable to remote attacks.
ESs are used for multiple purposes, mainly to capture, store and control data of sensitive nature, e. g. home or cottage usage. Attackers could have different goals to compromise ESs, from gathering sensitive data, thus compromising their privacy, to disrupt the service by a Denial of Service (DoS) attack, exploiting their security and dependability. The consequences of a malicious and a successful attack could cause physical and economic losses, and thus it is important to keep them as secure, privacy-aware and dependable as needed in a given situation.
In this paper, a functional SPD level evaluation methodology is presented and its applicability validated by implementing it in a real use case for a smart grid scenario.
Traditional smart grid installations focus on measuring the power consumption of the home. As such a smart grid infrastructure provides opportunities for the power-grid provider and incentives for the end-customer in saving power under high-demand circumstances. Extending the smart-grid infrastructures with home-control and alarm functionalities can open novel areas of operation for smart-grid providers. Our paper presents a smart-grid operation in the South of Norway, and the security demands of the operator towards novel services.
The core of the methodology resides in the Multi-Metrics SPD evaluation, which provides a practical and simple solution for SPD implementation during not only the design, but the whole lifetime of ESs. The presented concepts and results are developed through the European activity SHIELD. The nSHIELD project [25] looks at the applicability of the envisaged approach in different domains. This paper focusses on selected use cases for the smart grid, including billing, alarm and home control.
The rest of the paper is structured as follows: Section 2 shows a current and future view of Smart Grid; Section 3 provides an overview of related work on security, privacy and dependability; Section 4 introduces the smart grid scenario and explains the selected use cases; Section 5 presents the ESs SPD level methodology; Section 6 describes the evaluated use cases and describes the metrics used in this paper; Section 7 introduces the Multi-Metrics approach and shows its applicability by analysing the SPD level, SPD, of a the smart grid sub-system; Section 8 evaluates the results obtained in the previous section and finally, Section 9 provides a summary of the key contributions of this applied research work.
2 Smart Grid System and Services
Since Whyte published his patent on the powerline communication system back in 1975 [33], a variety of methods have been implemented to monitor the power consumption in a building. These methods range from low end optical readers of the numbers of the analogue reader to high-end control systems for the home, and are commonly treated as automatic meter readers (AMR). Karnouskos et al. described the change from an AMR system (AMS) into an advanced metering infrastructure (AMI), including initial security challenges [12].
This work introduces measurable security for AMI, focussing on the extension from meter readings into the home control. A typical infrastructure is indicated in Figure 1, collecting the meter readings in a concentrator and then using the mobile network to connect to the control centre.

Figure 1 Smart Grid for automatic meter readers
Though a variety of security papers have been published regarding AMI, e.g. the work from Beigi et al. on intrusion detection [3] and the work from Saputro and Akkaya on privacy in smart grids [27], little is published combining various aspects of security. Our approach is based on the industrial applicability of measurable security in an existing smart grid infrastructure. Our main focus is to see to what extend the deployed infrastructure (see Figure 1) can satisfy the needs of advanced services, including:
- Monitoring the grid to achieve a grid stability of at least 99, 96%,
- Alarm functionality, addressing both the failure of components in the grid, as well as alarms related to the Smart Home, e.g. burglary, fire, or water leakage,
- Billing functionality, providing at least the total consumption every hour, or even providing information such as max usage,
- Remote home control, interacting with e.g. the heating system,
- Intrusion detection, monitoring both hacking attempts to the home as well as the control center and any entity in between, and
- Fault tolerance and failure recovery, providing a quick recovery from a failure.
Examples of SPD analysis in the smart grid include for Security the control unit of a home, or the hacking of the control center; for Privacy the habit monitoring of the residents, e.g. nobody is at home; and for Dependability the supply security of the electrical power grid, which is mainly the component dependability of the grid. Further details on these selected use case are provided in Section 4.
3 Related Work
Security, Privacy and Dependability SPD and specially their measurement have been analysed through several papers. This section describes a representative set of those papers, most of them analysing SPD aspects individually, without considering all together at all.
Security, Privacy and Dependability metrics can be classified into (i) system-based and (ii) attacker-based measurements. On one hand, system-based metrics, also called as system-centric approaches, concentrate on system components and capabilities [22]. On the other hand, attacker-based measurements, or attacker-centric approaches, assume attacker capabilities, resources and behaviour. Previous research on security measurement has been mainly concentrated on attacker-centric approaches [30, 31], even if there are some system-centric methods [22]. When considering Smart Grids, the system-centric approach considers the design and configuration aspects rather than attacker capabilities and behaviour.
Several papers have been published considering security, privacy and dependability for Smart Grid. However, few of them measure the SPD level of a system by combining different metrics.
Referring to security, Mo et al. [24] analyse different Smart Grid security requirements by highlighting attack models and possible countermeasures. Due to the lack of security metrics, the work highlights the importance of identifying a set of metrics that combines and addresses the security concerns during the design of secure Smart Grid. In a similar way, Wang et al. [17, 32] explore Smart Grid security objectives by analysing possible attacks. Furthermore, they analyse network and cryptographic countermeasures and they suggest the design of secure network protocols.
Focusing on privacy, it is important to highlight that the exploitation of consumption data obtained from individual houses could end in a severe privacy violation. The knowledge obtained from the analysis of consumption data has a high economical value where different sectors could be interested [5]. The information gleaned through metered energy data processing can be demonstrated with the use of non-intrusive appliance load monitors (NALM), which can recognise and track appliance usage patterns [15, 26]. In this sense, Cavoukian et al. [4] analyse several privacy aspects to consider during the design phase. They classify the features into end user equipment, electricity distribution and generation. Kalogridis et al. [11] suggest an approach to mask the electricity usage by providing to the Automatic Measuring System (AMS) a balanced electricity consumption. To this end this work suggests the installation of a rechargeable battery and some power mixing algorithms. Furthermore their work proposes three different metrics to evaluate the privacy level of the end user real and faked measurements, (i) the relative entropy, (ii) the similarity based on cluster classification, and (iii) a regression analysis.
Regarding dependability metrics in Smart Grid, there are few papers in the literature using different metrics to evaluate dependability. One of them is the work of Gungor et al. [7], which uses LQI and RSSI metrics to evaluate the quality of a radio link. RSSI is the estimate of the signal power while LQI is used as chip error rate. The main purpose of this work lies in the characterisation of radio links for the usage of Wireless Sensor Networks (WSN) in Smart Grid. In the same way, Li et al. [16] use delay, cost and path length metrics to measure the Quality of Service (QoS) of Smart Grid packets routing. To continue with dependability metrics, the work of Gungor et al. [8] analyses different aspects of Smart Grid communication and highlights the necessity to measure the reliability of the communication system. This work is not going further with metric definition, and instead of measuring the reliability as a combination of multiple metrics, it defines reliability as a metric. The work presented by Lauby [14] is focused on the measurement of the energy distribution reliability. In this sense they define two different metrics, the System Average Interruption Frequency Index (SAIFI) and the Customer Average Interruption Duration Index (CAIDI). The first metric measures the number of sustained outage events experienced by a end customer, while the CAIDI metric refers to the average length in time of a end customer outage.
There are few research activities which propose a kind of SPD metric in the field of Smart Grid. Furthermore, the previously analysed ones are focused at most on three different metrics. Their objective is to measure the security, privacy or dependability levels of specific system components or to define a broad metric which involves several components but, without going far into the details. The methodology presented in this work defines and evaluates several metrics together to end up with a common SPD level result.
In addition to Smart Grid, the measurement of security, privacy and dependability have been analysed in different fields such as software. Considering the publications which combine multiple metrics resulting in a common measurement, Howard was one of the first to introduce an attack surface metric [9], which has been an starting point of multiple publications [2, 10, 13, 19, 23, 28–29] for measuring the software security in different domains. Defined as the attack opportunity or attackability of a system, or its exposure to attack [9, 10], attack surface is a relative metric that strikes at the design level of a system. One of the essential ideas behind attack surface metric is that it is important to remove unnecessary features, and offers those characteristics as reconfigurability or composability options.
Howard et al. [10] propose the attack surface metric for determining whether one version of a system is more secure than another with respect to a fixed set of dimensions. Their work evaluates the attack surface metric of five different versions of Windows operating system. To do so, they define and use five different elements to evaluate the Attack Surface level; Target, Enabler, Channel, Protocol and Access rights. After giving a specific weight to each element, which reflects the repercussion of each of them, all the elements are computed with a function resulting in attack surface level. The main advantage of this method is that dividing the metric into small elements helps to simplify the approach. However, the function for computing all the elements together have to be specified for each system, which, even for a simple system, can be extremely difficult. Additionally, this work relies on the history of attacks on a system, which prevents it for applying in a systematic form.
Continuing with attack surface, Manadhata and Wing [19] modified the attack surface metric by categorising the system resources into different attack classes. The main idea behind classifying system resources is based on the notion that some of them are more likely to be attacked than others. After identifying and classifying all attackable system resources, they presented, measured and compared the attack surface of two Linux distributions, two IMAP servers [20, 21, 23] and two FTP Daemons [18, 20, 23].
In the case of multiple metrics applied in ESs, Garitano et al. [6] present a methodology which evaluates the entire system SPD level. The presented methodology starts by evaluating each component of the system to jump over sub-system evaluation and end up with the entire system SPD level. However, their work is mainly focused on privacy, which will be further explained in this work.
Previous research analysed SPD elements individually. Even if some of them combine security and privacy or security and dependability, none of them combines all three (security, privacy, dependability) of them. Considering each SPD independently in designing fragile systems could result in a highly secure system, but the system might be highly vulnerable due to dependabilities. In most cases a specific SPD level requires a compromise between one or the other, implying a balance between all three of them. The next section describes a methodology to combine and evaluate different metrics by the usage of the Multi-Metrics approach.
4 Smart Grid Use Case
This section describes the evaluated Smart Grid installation in the south of Norway and analyses use cases. The applicability of the presented methodology is further explained in Section 7.
The presented Smart Grid is composed of (i) customer AMSs and information collector infrastructure, (ii) cloud services and (iii) remote access for monitoring and control. As shown in Figure 2, the information acquired from AMS devices is first collected by the control centre and later transmitted to the cloud services for its analysis and storage. At the same time, end customers can access, check and control remotely their home status by the cloud services.

Figure 2 Smart Grid topology including radio communication, cloud services and remote access
The Smart Grid provides several use cases such as grid monitoring, different types of alarms (fire, flood), billing, home control and smart energy generation. This work analyses and evaluates three of them, (i) billing, (ii) fire alarm and (iii) home control.
4.1 Billing Use Case
In case of the billing use case, the meter reader provides hourly meter values and real time energy related alarms (sags, swells and power faults). This information is first sent to the concentrator and kept there until it is sent to the control centre. The concentrator provides the control centre with the meter values typically every sixth hours, while alarms are sent in real time. All communication from the concentrator to the control centre is sent over mobile network. The data are stored in a cloud infrastructure, where they are validated, missing values estimated and billing is prepared.
4.2 Alarm Use Case
Alarm services are foreseen, including e.g. a fire alarm, which is communicated directly to the fire brigade, and to the control centre. In addition, the home owner might be informed by an SMS depending on his/her profile settings.
The current infrastructure first collects the alarm in the concentrator, and then directly forwards it to the control centre. One part of the SPD analysis will address the challenges of having just one communication channel.
4.3 Home Control Use Case
The home control use case uses a bidirectional communication both with the control centre and the cloud. In case of the meter reading, it checks the status of different home devices and it sends this information to the cloud. In the current centralised version the cloud runs load control algorithms, and might send control signals to the home. Future installations might address a local processing in the AMI infrastructure in the home. Furthermore, customers will gain the opportunity to check and change the settings that will be transmitted back to the AMI.
The presented Smart Grid has three main parts and multiple use cases. However, the analysis and SPD evaluation of all them is not feasible within this work. Thus, in Section 7, the SPD level for the customer AMSs and information collector infrastructure will be evaluated for the three use cases presented above. The evaluation will provide a clear clue whether the system will run according to the established SPDGoals or whether it will be necessary to redesign it to accomplish the set SPD requirements.
5 Methodology for Security, Privacy and Dependability
This section describes the methodology together with the system structure followed to evaluate the system Security, Privacy and Dependability, SPDSystem, level. The main objective is to evaluate multiple system configurations and select those which address or achieve the established requirements.
5.1 System SPD Evaluation
The SPDSystem level is represented by a triplet composed of individual Security, Privacy and Dependability levels (s, p, d). Furthermore, each element is described by a value in a range between 0 and 100, i.e. the higher the number, the higher the Security, Privacy and Dependability levels. The given methodology concludes with the SPDSystem level, however, the system criticality is used during the whole process as the main evaluation component. As such, as well as SPDSystem, criticality is a triplet defined as the complement of SPD, and expressed as (Cs, Cp, Cd) = (100, 100, 100) – (s, p, d).
A single system could work under different use cases, e.g. fire alarm, consumption measurement and billing in the case of the Smart Grid. Furthermore, depending on the use case, the system can be configured in multiple ways. Thus, for a given use case and system, there will be different configuration options. Besides multiple configurations, each system use case has a required SPD level, SPDGoal. Moreover, each configuration offers a different SPD level, hence, the proposed methodology evaluates all possible configurations looking for the most convenient one.
The evaluation process, for a given system configuration, starts by evaluating each single component to end up with the whole system evaluation. The scalability allowing an analysis of individual sub-systems simplifies the process complexity; at the same time it helps to identify the main risk sources. As shown in Figure 3, a system is composed of multiple sub-systems which at the same time consist of various components. The evaluation of components and sub-systems is performed by multiple metrics and the Multi-Metrics process, further explained in Section 7.
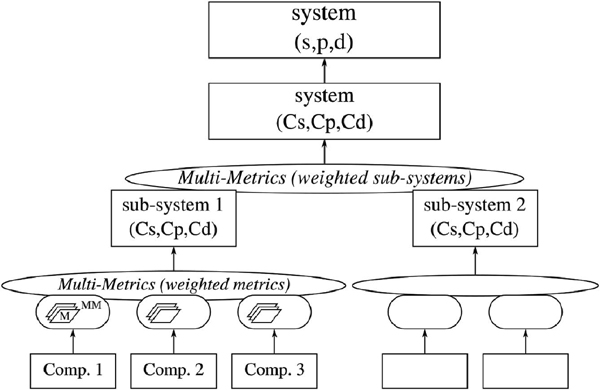
Figure 3 System level Multi-Metrics (MM), with M indicating a Metrics analysis
Metrics are objects or entities used to measure the criticality of components. As presented in Figure 4, the criticality of a component for a given configuration is evaluated through one or more metrics. The result of the metrics is again joined by using Multi-Metrics, which provides the overall component measurement. The selection and/or definition of metrics, applied for a specific use case, is further explained in Section 6.

Figure 4 Component level Multi-Metrics (MM), with M indicating a Metrics analysis.
The SPDSystem evaluation is performed individually for each SPD component. The last step is to make a commitment and select the most convenient configuration for a given scenario. To check the SPDSystem compliance, a visual representation is used. The main advantage is the simplification of the comparison between the SPD level of each configuration and the established SPDGoal. Thus, every element of SPD level is substituted by a green, yellow or red circle. The colour is selected according to the numeric difference between SPD level and SPDGoal, following the following criteria:
- | SPDGoal–SPD level| = < 10, green
 .
. - | SPDGoal–SPD level| = > 10, < 20, yellow
 .
. - | SPDGoal–SPD level| = > 20, red
 .
.
As result, the selection of the most convenient configuration will establish the SPDSystem level.
5.2 Weight of the Elements
As shown in Figure 3, a system is composed of components and sub-systems. Additionally, the evaluation of component criticality can be performed by one or multiple metrics, as shown in Figure 4.
The importance of each component, metric or sub-system is not equal for the system operation, as is different for SPDSystem evaluation. As such, all the elements involved in the system evaluation have a weight. The weight describes the importance of a configuration for a sub-system, e.g. authentication or remote access, and is further described in Section 7.
As well as SPD levels, the weight is described by a value in a range between 0 and 100, i.e. the higher the number, the higher the importance of an element. The usage of the same range for SPD and element importance helps to assign the corresponding value. However, in order to increase the weight effect in the Multi-Metrics, the initial weight value is escalated quadratically. Our sensitivity analysis showed that a linear weighting results in an averaging effect for the SPD value of sub-systems and systems, rather than pin-pointing criticalities. The Multi-Metrics approach is further explained in Section 7.
5.3 Use Case Based Goal
The last step of the methodology is to compare the SPD level of each configuration with the SPDGoal established for each use case. Thus, one of the first requirements is to set a SPDGoal for each use case. If the SPD level of the closest system configuration to SPDGoal is still far from the objective, the result will show the need for a new configuration or a redesign of the system.
Table 1 SPDGoal of each use case
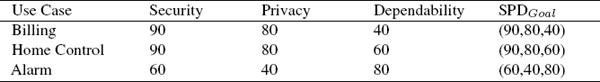
Table 1 shows the established SPDGoal values for the three use cases analysed in this work. As it is shown, Billing and Home Control are focused first on security leaving dependability as the less important one. This is mainly due to the fact that in both cases is necessary to avoid any kind of man in the middle attack. Furthermore, the response time of the system does not have to be immediate, thus, decreasing the dependability level. However, in case of Alarm, dependability is the principal target, then security and finally privacy. A fire alarm needs a fast delivery of the alarm with a high reliability, while protecting the privacy of the communication is of less importance.
In this section, the methodology for evaluating and selecting the best SPD level according to the SPDGoal has been presented. Furthermore, we introduced how different elements are weighted and defined the SPDGoal for three specific use cases. The main advantage of the methodology consists of the simplicity of evaluating and selecting the most appropriate configuration for a given use case. The Multi-Metrics approach reduces the complexity of the evaluation process while the visual representation of SPD simplifies the selection process.
6 Sub-System and Metrics
This section describes the three sub-systems which compose the presented system and the selection and definition of SPD metrics. Six metrics are used to evaluate the SPDSystem level of the Smart Grid presented in Section 4.
6.1 Sub-Systems Description
The Smart Grid system presented in this paper is composed of multiple sub-systems and components. This section describes three of them, (i) the Automatic Meter Reader (AMR), (ii) the Mesh radio link and (iii) the Mobile link sub-systems. These sub-systems are used by the three use cases described in the previous section.
As shown in Figure 1, the AMR uses the Mesh radio link to communicate with the signal concentrator. The concentrator uses the Mobile link to send and receive data from the Control Centre. Thus, all three sub-systems communicate with each other. Given the fact that different sub-systems are interrelated, the whole system could be evaluated together. However, the analysis of the overall SPDSystem would became complex thus, each subsystem is evaluated individually. The division of the system into sub-systems and each sub-system into several components, allows the easy identification and evaluation of the metrics.
The AMR is an Embedded System (ES) installed in every house, and is tailored to measure, sense and in the future control the power consumption, fire sensors and some other home parameters. While current AMR are monitoring, they will be extended allowing end-users to control the home through the operator’s infrastructure.
The Mesh radio link is the communication channel used by the AMR and the concentrator to communicate with each other. Since the installation foresee one concentrator per a group of houses, the communication between each AMR and the concentrator can be done directly or by multiple hops. In case of direct communication the transmit power for the direct communication from each house to the concentrator will be higher as compared to a mesh set-up, increasing the chance of interference. In a non-synchronised wireless network, communications from each AMR to the concentrator may also increase the probability of signal collisions. In a mesh configuration, data can be transmitted by using multiple hops. In this case the probability of reaching the concentrator are bigger, since data can follow multiple routes.
The communication between the concentrator and the Control Centre is performed by the Mobile link sub-system. Being controlled by the service provider, the mobile communication system can choose between sending the data over SMS or GPRS.
6.2 Sub-Systems Metrics
The SPD level of the components that make up a sub-system can be measured by multiple metrics. Definition and selection of the necessary metrics requires expertise in the field, and should be performed by a system engineer. One of the ideas behind this work resides in the creation and maintenance of a common metric database. The main benefit consists of reusing the metrics used to measure the same or equivalent component SPD level, or even use existing SPD values for sub-systems/components with a given configuration. To the best of our knowledge, there is no metric database available, giving us the task of defining relevant metrics.
The definition of a metric starts by analysing every component and identifying all parameters which could be used for its characterization. Those parameters have to be evaluated from all SPD perspectives in order to end up with a criticality level for each of them. Next step is to evaluate the repercussion of the possible values of each parameter on the component SPD level. The output will be the weight, which could vary from one system to another and thus, needs to be defined or at least evaluated for every new system evaluation.
In case of the presented three sub-systems each of them is evaluated by two or three metrics, having a total of six metrics. The evaluation of the AMI sub-system, is performed by (i) Remote Access, (ii) Authentication, and (iii) Encryption metrics.
The Remote Access metric evaluates the SPD level of the remote connectivity functionality of the system. As shown in Table 2, this metric establishes different criticality values for whenever the functionality is activated or not.
Authentication metric, Table 3, establishes the criticality level of having authentication activated in order to access the AMI. It considers both, remote as well as local access to the AMI.
The third metric used to measure the SPD level of the AMI is Encryption. This metric is used in all three sub-systems to evaluate if the transmitted data is encrypted or not. As shown in Table 4, it considers two different status, data encryption activated or not.
Table 2 Remote access metric
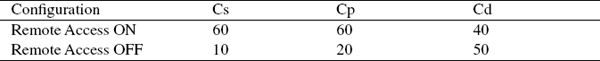
Table 3 Authentication metric
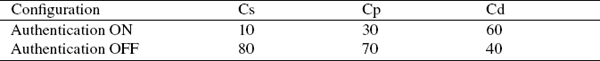
Table 4 Encryption metric
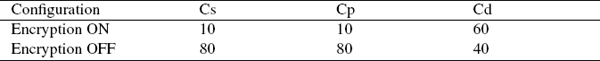
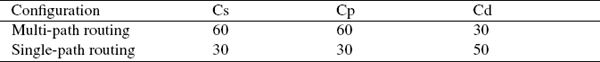
Table 5 Mesh metric
The evaluation of the Mesh radio link sub-system is performed by (i) Mesh, (ii) Message Rate, and (iii) Encryption metrics.
The traffic routing in a Mesh link can be performed by sending the data directly or not. In case of direct data delivery a single hop is used, which is more secure and privacy aware since data is not going through others but, requires more transmission power and the dependability is not as high. Alternatively, multiple hops traffic routing is used whenever transmission time is not as urgent and there is a need to avoid collisions. Furthermore, the necessary transmission power is lower than single hop and is more dependable since multiple paths can be used to deliver data. Table 5 shows the criticality values for Mesh metric.
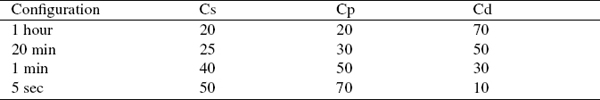
Message Rate metric measures the criticality level according to the frequency the messages are sent, see Table 6. In this way, more messages per unit of time increases security and privacy criticality and reduces the dependability criticality.
Table 6 Message rate metric
As well as in AMI sub-system, Encryption metric is used in Mesh radio link sub-system to evaluate if the transmitted data is encrypted or not. Same criticality values are used, shown in Table 4.
Table 7 Mobile channel metric
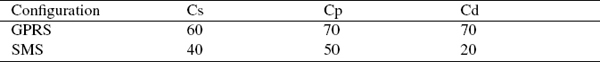
The evaluation of the Mobile link sub-system is performed by (i) Mobile Channel and (ii) Encryption metrics.
Since the mobile link is under the service provider control, the system can choose over which communication type will send data. Thus, the Mobile Channel metric establishes the criticality level of sending data over SMS or GPRS, as described in Table 7.
As previously explained, the Encryption metric is also used to evaluate the criticality of the Mobile link sub-system. The difference in its evaluation for each sub-system will be established by the weight.
This section introduces the three sub-systems which compose the evaluated system together with the metrics used for components criticality evaluation. Furthermore, the six metrics and their criticality values are presented. The result of evaluating the three sub-systems is further explained in the following section.
7 Multi-Metrics Approach and Operation
This chapter describes the Multi-Metrics (MM) approach and shows its applicability by analysing three different smart grid use cases.
Multi-Metrics is the core process of the overall methodology. It is a simple method which evaluates the repercussion of each metric, component or subsystem, based on its importance in the system.
During the SPD evaluation of an entire system, Multi-Metrics is used in repeated occasions to evaluate the SPD level step by step and end up with the overall SPDSystem. Furthermore, the usage of the same operator along the whole SPDSystem evaluation simplifies the methodology by making it more understandable for people not being experts in the field. The output of Multi-Metrics is a single number which shows the criticality level of the components and sub-systems, and is easily translated into an SPD level.
The Multi-Metrics approach is based on two parameters: the actual criticality xi and the weight Wi. The criticality C is accomplished by the Root Mean Square Weighted Data (RMSWD) formula shown in Equation 1.
There are three possible criticality level outcomes, being (i) component criticality, after evaluating the suitable metrics, (ii) sub-system criticality, from the evaluation of components or (iii) system criticality, after performing the Multi-Metrics operation on sub-systems. The actual criticality xi is the result of (i) the metric for a component evaluation, (ii) the component evaluation, obtained by a previous RMSWD, for a sub-system evaluation, or (iii) the sub-system evaluation, obtained by a previous RMSWD, for a System evaluation. All these values are for a given configuration in a specific use case.
The weight wi is provided by the expert in the field, and provides the significance level of each (i) metric within a component, (ii) component within a sub-system or (iii) sub-system within the system evaluation. As already mentioned in Section 5, the weight value is in the range of 0 to 100. Thus, it follows the same approach as the criticality level, making the entire process under the same logic. However, a sensitivity analysis has shown that a linear significance level of the weight is not appropriate to end up with representative SPD levels. Hence, the weight used in the RMSWD calculation of Equation 1 is Wi, being calculated from wi through Equation 2 as
The resulting value will be in the range of 10-4 and 1, maximizing the impact of high weight values towards the lowest ones.
7.1 Multi-Metrics for Smart Grid Evaluation
This section performs the evaluation of the sub-systems and components and thus demonstrates the applicability of the methodology.
Table 8 Sub-systems and components weights
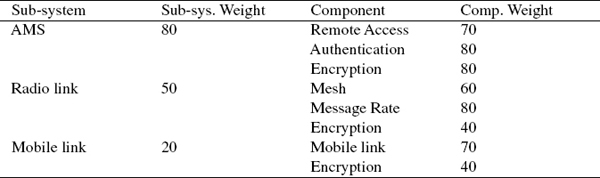
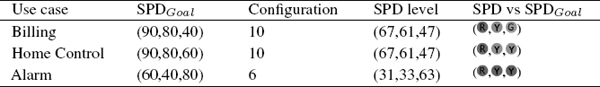
Table 9 Selected configuration SPD level for each use case
The Smart Grid analysed in this work is composed by three different subsystems. As shown in Table 8, each sub-system receives a specific weight for its evaluation. Furthermore, each sub-system is composed by multiple components and in the same way, each component has a specific weight. Later, those assigned values are transformed before they are used by the RMSWD formula.
The Smart Grid evaluated in this work can run under 11 possible configurations. Those configurations set how different sub-systems and, more specifically each component, behave under some given conditions. In order to choose, for each use case, the most suitable configuration, all configurations are evaluated and compared with the established use case SPDGoal.
As shown in Table 9, from 11 possible configurations the closest to the SPDGoal is selected for each use case. In case of the Billing and Home Control use cases, the selected configuration is conf. 10. Both use cases are focused on security and privacy, letting dependability be of minor importance. Thus, the selected configuration, even if in both cases the security level is in red, is the most closest to security and privacy goals.
The Alarm use case is focused on dependability. Thus, the selected configuration is the one with the highest dependability value, even if it the difference is bigger than ten units. Hence, it appears in yellow.
This chapter explained the Multi-Metrics approach and showed its applicability using three Smart Grid use cases as example. As it has been shown, in order to end up with a specific configuration which best satisfies the SPDGoal of each use case, it is necessary to set which SPD element is the major one and consider the rest as complementaries. The final result, being the SPDSystem, is a triplet with the measured security, privacy and dependability values obtained from the application of a given system configuration.
8 Evaluation
This section evaluates the applicability of Multi-Metrics approach and the presented methodology.
The presented methodology considers all SPD aspects during the analysis of the most suitable configuration for each use case. The obtained results show under which SPD conditions the system will run for a given use case and configuration. During the design phase, the presented methodology provides a clear view of which configurations are suitable to run the system in the expected conditions or which other measures are needed to improve the SPDSystem level. The results clarify if it is necessary to modify the design of some system aspects, and to satisfy the established goals.
The outcome of the system analysis, presented in the previous Section, showed the closest configuration options for the established SPDGoals. In all use cases the most highest SPD element is the one which dominates the selection of the configuration. Hence, in case of Billing and Home Control, the security element is the decisive one, while dependability is the decisive element for the Alarm case.
As it is shown, for Billing and Home Control the obtained security result is in red, indicating that the current configuration is not suitable for satisfying the security goals or that the security goal of S = 90 is unrealistic for the envisaged use case. The analysis presented configuration 10 as the one with the maximum security value of S = 67. A detailed sensitivity analysis shows that a specific configuration focussing just on security measures could provide a maximum value of S = 84. This value can satisfy the security requirements for both use cases. Furthermore, the same configuration would produce a privacy level of P = 77, and a dependability level of D = 42. These results will provide a perfect match in case of Billing  use case and a good result in case of the Home Control
  use case.
Following the same example, the results obtained for the Alarm use case show dependability and privacy in yellow and security in red. However, for this use case, even if a configuration totally focused on dependability would be created, the maximum value would be D = 64. Hence, in order to increase the dependability, the system needs to be redesigned by adding some other dependability focussed components, without decreasing the security and privacy values.
In case of an existing system, the same analysis will provide a clear picture about the SPDSystem level in operation. This analysis will identify which configuration options or system parts are not behaving as expected, thus help to identify the critical sub-systems. The early correction of misbehaving configuration options could prevent further consequences.
The applicability of the presented methodology is determined by the subjective weighting and criticality assignment. There is a need for a standardization through industrial interest board in order to establish the metrics, their criticality levels and their weight in a system. Without a common understanding, it is less likely that applying the methodology to a different system will yield comparable SPD levels.
However, our analysis shows that the Multi-Metrics methodology can be used to compare the SPD aspects for a given system under different configurations both during the design process or for an already existing system.
The methodology adoption from the system developers side can bring several advantages such as already evaluated metrics, components and sub-systems for different use cases. This would dramatically simplify the evaluation process and would drive its adoption from the whole industry.
9 Conclusion
This paper presents a methodology for assessing security, privacy and dependability (SPD) of embedded systems. Embedded Systems evolved from isolated to highly interconnected devices, becoming the key elements of the Internet of Things. Our approach combines the assessment of SPD, thus allows the optimisation towards a balanced solution.
In order to address the challenge of a balanced solution, the Multi-Metrics methodology presented in this paper considers all SPD aspects together. The methodology, developed through the European collaboration SHIELD, is applied for the smart grid network as deployed in the South of Norway. Three use cases, billing, home control, and alarm, are analysed in detail.
The main advantages of the methodology are the simplicity, Multi-Metrics is the core process used along all the steps, and scalability, it starts with component evaluation to jump over sub-systems and ends up with the entire system evaluation. The result is an overall SPDSystem level, which makes it easy to understand under which configuration the system will perform as envisaged by the SPDGoal. This SPDGoal is defined for each of the three use cases, and the comparison with the SPDSystem shows that the system configuration can not always satisfy the envisaged goal. The paper analyses a total of 11 configurations, and concentrates on the radio communication from the meter to the control centre. As an example, assuming that billing has a security goal of 90, our analysis shows that even the configuration with the highest security settings would only reach a system security of S = 67.
A detailed sensitivity analysis provided an alternative configuration being able to achieve (S, P, D) = (84, 77, 42), satisfying the need of the billing and alarm use case. The analysis pointed out further that a single configuration is not sufficient to satisfy the given goals for all three use cases.
However, the methodology identifies solutions that are capable of satisfying security, privacy and dependability in a combined matter, and introduces measurable security for embedded systems.
Acknowledgements
The authors would like to thank their colleagues from the ARTEMIS project nSHIELD for the basics of the methodology, and the ongoing discussions on applicability. The work became part of the national ASSET initiative for security in the Internet of Things, and is financed in part by the JU ECSEL and the Research Council of Norway.
References
[1] Sarfraz Alam, Mohammad M. R. Chowdhury, and Josef Noll. Interoperability of Security-Enabled Internet of Things. Wireless Personal Communications, 61(3):567–586, 2011.
[2] Alexandre Bartel, Jacques Klein, Yves Le Traon, and Martin Monperrus. Automatically securing permission-based software by reducing the attack surface: an application to android. In Proceedings of the 27th IEEE/ACM International Conference on Automated Software Engineering, pages 274–277. ACM, 2012.
[3] Nasim Beigi Mohammadi, Jelena Mišić, Vojislav B Mišić, and Hamzeh Khazaei. A framework for intrusion detection system in advanced metering infrastructure. Security and Communication Networks, 7(1):195–205, 2014.
[4] Ann Cavoukian, Jules Polonetsky, and Christopher Wolf. Smartprivacy for the smart grid: embedding privacy into the design of electricity conservation. Identity in the Information Society, 3(2):275–294, 2010.
[5] Min Chen, Shiwen Mao, and Yunhao Liu. Big data: A survey. Mobile Networks and Applications, 19(2):171–209, 2014.
[6] Iñaki Garitano, Seraj Fayyad, and Josef Noll. Multi-Metrics Approach for Security, Privacy and Dependability in Embedded Systems. Wireless Personal Communications, accepted for publication, 2015.
[7] V.C. Gungor, Bin Lu, and G.P. Hancke. Opportunities and challenges of wireless sensor networks in smart grid. Industrial Electronics, IEEE Transactions on, 57(10):3557–3564, Oct 2010.
[8] V.C. Gungor, D. Sahin, T. Kocak, S. Ergut, C. Buccella, C. Cecati, and G.P. Hancke. A survey on smart grid potential applications and communication requirements. Industrial Informatics, IEEE Transactions on, 9(1):28–42, Feb 2013.
[9] Michael Howard. Fending off future attacks by reducing attack surface. http://msdn.microsoft.com/en-us/library/ms972812.aspx. [Online] Accessed: 2014-09-27.
[10] Michael Howard, Jon Pincus, and Jeannette M Wing. Measuring relative attack surfaces. In D. T. Lee, S. P. Shieh, and J. D. Tygar, editors, Computer Security in the 21st Century, pages 109–137. Springer US, 2005.
[11] G. Kalogridis, C. Efthymiou, S.Z. Denic, T.A. Lewis, and R. Cepeda. Privacy for smart meters: Towards undetectable appliance load signatures. In Smart Grid Communications (SmartGridComm), 2010 First IEEE International Conference on, pages 232–237, Oct 2010.
[12] Stamatis Karnouskos, Orestis Terzidis, and Panagiotis Karnouskos. An advanced metering infrastructure for future energy networks. In New Technologies, Mobility and Security, pages 597–606. Springer, 2007.
[13] Anil Kurmus, Alessandro Sorniotti, and Rüdiger Kapitza. Attack surface reduction for commodity os kernels: trimmed garden plants may attract less bugs. In Proceedings of the Fourth European Workshop on System Security, page 6. ACM, 2011.
[14] M.G. Lauby. Reliability considerations for application of smart grid technologies. In Power and Energy Society General Meeting, 2010 IEEE, pages 1–4, July 2010.
[15] C. Laughman, Kwangduk Lee, R. Cox, S. Shaw, S. Leeb, L. Norford, and P. Armstrong. Power signature analysis. Power and Energy Magazine, IEEE, 1(2):56–63, Mar 2003.
[16] Husheng Li and Weiyi Zhang. Qos routing in smart grid. In Global Telecommunications Conference (GLOBECOM 2010), 2010 IEEE, pages 1–6, Dec 2010.
[17] Zhuo Lu, Xiang Lu, Wenye Wang, and C. Wang. Review and evaluation of security threats on the communication networks in the smart grid. In MILITARY COMMUNICATIONS CONFERENCE, 2010 – MILCOM 2010, pages 1830–1835, Oct 2010.
[18] Pratyusa Manadhata, Jeannette Wing, Mark Flynn, and Miles McQueen. Measuring the attack surfaces of two ftp daemons. In Proceedings of the 2nd ACM workshop on Quality of protection, pages 3–10. ACM, 2006.
[19] Pratyusa Manadhata and Jeannette M. Wing. Measuring a system’s attack surface. Technical report, DTIC Document, 2004.
[20] Pratyusa K. Manadhata, Kymie M. Tan, Roy A. Maxion, and Jeannette M. Wing. An approach to measuring a system’s attack surface. Technical report, DTIC Document, 2007.
[21] Pratyusa K. Manadhata and Jeannette M. Wing. An attack surface metric. Technical report, DTIC Document, 2005.
[22] Pratyusa K Manadhata and Jeannette M Wing. An attack surface metric. Software Engineering, IEEE Transactions on, 37(3):371–386, 2011.
[23] Pratyusa K. Manadhata and Jeannette M. Wing. A formal model for a system’s attack surface. In Moving Target Defense, volume 54, chapter Creating Asymmetric Uncertainty for Cyber Threats, pages 1–28. Springer New York, 2011.
[24] Yilin Mo, T. H. -H. Kim, K. Brancik, D. Dickinson, Heejo Lee, A. Perrig, and B. Sinopoli. Cyber-physical security of a smart grid infrastructure. Proceedings of the IEEE, 100(1):195–209, Jan 2012.
[25] nSHIELD. New embedded Systems arcHItecturE for multi-Layer Dependable solutions. http://www.newshield.eu. [Online] Accessed: 2014-09-30.
[26] Elias Leake Quinn. Privacy and the new energy infrastructure. Available at SSRN 1370731, 2009.
[27] Nico Saputro and Kemal Akkaya. On preserving user privacy in smart grid advanced metering infrastructure applications. Security and Communication Networks, 7(1):206–220, 2014.
[28] Jeffrey Stuckman and James Purtilo. Comparing and applying attack surface metrics. In Proceedings of the 4th international workshop on Security measurements and metrics, pages 3–6. ACM, 2012.
[29] Jakub Szefer, Eric Keller, Ruby B Lee, and Jennifer Rexford. Eliminating the hypervisor attack surface for a more secure cloud. In Proceedings of the 18th ACM conference on Computer and communications security, pages 401–412. ACM, 2011.
[30] Jeffrey Voas, Anup Ghosh, Gary McGraw, FACF Charron, and Keith W Miller. Defning an adaptive software security metric from a dynamic software failure tolerance measure. In Computer Assurance, 1996. COMPASS’96, Systems Integrity. Software Safety. Process Security. Proceedings of the Eleventh Annual Conference on, pages 250–263. IEEE, 1996.
[31] Jeffrey Voas and Keith W Miller. Predicting software’s minimum-time-to-hazard and mean-time-to-hazard for rare input events. In Software Reliability Engineering, 1995. Proceedings., Sixth International Symposium on, pages 229–238. IEEE, 1995.
[32] Wenye Wang and Zhuo Lu. Cyber security in the smart grid: Survey and challenges. Computer Networks, 57(5):1344–1371, 2013.
[33] I.A. Whyte. Distribution network powerline carrier communication system, March 2 1976. US Patent 3,942,170.
Biographies

J. Noll is professor at the University of Oslo in the area of Wireless Network and Security. His work concentrates on personalised and context-aware service provisioning, and measurable security for the Internet of Things (IoT). He is also Head of Research in Movation, Norway’s open innovation company. He is founding member of the Center for Wireless Innovation, the collaboration of 7 Universities/University colleges in Norway. He is involved in several international projects, including nSHIELD for measurable security in IoT systems, Citi-Sense-MOB for mobile air quality measurements, GravidPluss for mobile diabetes advise, and Ka-band propagation for polar regions. In the area of Internet of Things he was project leader of the Artemis pSHIELD project. Previously he was Senior Advisor at Telenor R & I in the Products and Markets group, and project leader of Eurescom’s ‘Broadband services in the Intelligent Home’ and use-case leader in the EU FP6 ‘Adaptive Services rid (ASG)’ projects, and has initiated a.o. the EU’s 6th FP ePerSpace and several Eurescom projects. In 2008 he received the IARIA fellow award. He is editorial board member of four International Journals, as well as reviewer and evaluator for several national and European projects and programs.

I. Garitano is currently working as a postdoctoral fellow at UNIK-University Graduate Centre, Norway. He received the Ph.D. degree from the Department of Electronics and Computer Science, University of Mondragon in 2014 in the area of industrial control systems security. Prior to that he received the M.Sc. degree in Telecommunication Engineering from University of Mondragon. His current research interests include measurable Security, Privacy and Dependability (SPD), Intrusion Detection Systems (IDS) and Internet of Things (IoT). He participated, and currently is involved, in research projects funded by the Norwegian Research Council, the Basque Government, the Spanish Government and the European Union.

S. Fayyad, PhD researcher at Movation AS and the University of Oslo/UNIK, he received his M.Sc. degree in computer engineering in the area of «reliable systems» from the University Duisburg-Essen, Germany. His research interests include IT security with concentration on measurable security for sensors in the Internet of People, Things and Services (IoPTS). He is involved in several international projects, including nSHIELD for measurable security in IoT systems, Citi-Sense-MOB for mobile air quality measurements.

E. Åsberg is currently Head of Development and Product Architect at eSmart Systems. He received his degree in Software Design from Østfold University College. He started his career at Institute for Energy Technology as a systems developer, continuing at Hand-El Scandinavia working with Customer Information Systems and at Nasdaq OMX working with Risk Management Systems. At Navita Systems (later Brady Plc.) he continued as team lead for software development on their risk management system for mitigating risk in the financial energy and commodity markets. At eSmart Systems he is responsible for system development and overall system architecture. He is heavily involved in system specification working closely with the customers. eSmart base their architecture on Azure, Microsoft’s cloud solution, and Erik has extensive knowledge of the services available on the platform and works closely with Microsoft to optimize eSmart’s cloud based solutions.

Dr. H. Abie is currently a senior research scientist at the Norwegian Computing Center. He received his B.Sc., M.Sc. and Ph.D. from the University of Oslo. He has previously been a scientific associate and fellow at CERN, researcher at ABB Corporate Research, Norway, software development engineer at Nera-AS, Norway, Alcatel Telecom Norway AS, Oslo, Norway, and senior engineer and research scientist at Telenor R & D, Norway. He has a solid and extensive background in the design and development of real-time systems, and the design, modelling and development of security for critical systems. He participates as a reviewer and member of the technical program committee in international conferences and workshops and reviews scientific papers in books and international journals. He co-organizes international workshops in conjunction with highly reputed international conferences, and serves as a project proposal reviewer for research and higher academic institutions. His past and present research interests encompass adaptive security, privacy and trust in distributed and communications systems, architecture and methodology, formal methods and tools, hard real-time systems, and mobile, ubiquitous, Internet of Things (IoT), and ambient intelligent computing, and adaptive and evolving algorithms.
Journal of Cyber Security, Vol. 3, 371–398.
doi: 10.13052/jcsm2245-1439.342
© 2015 River Publishers. All rights reserved.