Evaluating and Improving a Content Delivery Network (CDN) Workflow using Stochastic Modelling
Nupur Goyal1,*, Tanuja Joshi2 and Mangey Ram3
1Department of Mathematics, Graphic Era Deemed to be University, Dehradun, Uttarakhand-248002, India
2Department of Computer Science & Engineering, Graphic Era Deemed to be University, Dehradun, Uttarakhand-248002, India
3Department of Mathematics; Computer Science & Engineering, Graphic Era Deemed to be University, Dehradun, Uttarakhand-248002, India
E-mail: nupurgoyalgeu@gmail.com; tanuja.joshi0108@gmail.com; drmrswami@gmail.com
*Corresponding Author
Received 06 January 2021; Accepted 15 March 2021; Publication 14 June 2021
Abstract
Content Delivery Networks (CDN) are the backbone of Internet. A lot of research has been done to make CDNs more reliable. Despite that, the world has suffered from CDN inefficiencies quite a few times, not just due to external hacking attempts but due to internal failures as well. In this research work the authors have analyzed the performance of a content delivery network through various reliability measures. Considering a basic CDN workflow they have calculated the reliability and availability of the proposed multi-state system using Markov process and Laplace transformation. Software/Hardware failures in any network component can affect the reliability of the whole system. Therefore, the authors have analyzed the obtained results to find major causes of failures in the system, which when avoided, can lead to a faster and more efficient distribution network.
Keywords: Content delivery networks, reliability, software/hardware failures, Markov processes.
1 Introduction
Almost every company now uses CDNs for serving their content and managing requests over the web. Their performance is measured using factors such as latency and RUM (Real-User Monitoring) uptime. In an era, where almost all of the web is dependent on CDNs, it is crucial to be able to assess the reliability of these systems to analyze key factors in its performance so that they work with absolute efficiency [13, 16–18].
To handle huge internet traffic, CDNs use load balancer to intelligently divert traffic to different edge servers according to nearest geographical locations to ensure decreased latency and ensure equal distribution of requests across all servers [12]. CDNs also maintain multiple copies of static data across edge servers to ensure high rate of accessibility. There are a multiple routers/network hardware/software involved in-between to enable smooth functioning of the above process. Although good CDNs are known to be fairly reliable, even the bigshots in CDN industry have faced outage blunders due to internal failures [14]. In July, 2019, Cloud flare, known as the world’s largest CDN service provider, suffered an internal failure causing an internet outage for about an hour, rendering websites around the globe unusable. A lot of research has been done in the recent past to address this problem and devise effective measures for improved reliability of these systems [11].
Gupta et al. [1] devised a load balancing algorithm that took into consideration real time faults occurring in the servers as a parameter along with system load, response time and queue length to generate a reliability aware load balancing algorithm for CDNs. In peer-to-peer (P2P) based CDNs such as CoDeeN [2] proxy nodes share health status amongst themselves while intelligently monitoring that an unreliable and compromised node can be excluded as a candidate to handle a request, hence increasing the overall reliability of the system. Jiang et al. [3] proposed nCDN, a data centric routing technique NDN (Named Data Networking) clubbed with CDN where the request routing and content delivery is handled by NDN. Due to its cache and data- oriented security and dynamic nature in adjusting forwarding paths accurately during congestion, nCDN performs better than traditional CDN, specially during heavy load. Yin et al. [4] deployed a hybrid CDN-P2P System called LiveSky which uses a tree type hierarchy to handle failure at edge servers by forwarding the unfulfilled request higher up in the hierarchy until a suitable node is found. This efficient architecture coupled with adaptive P2P design to increase scalability results in a more reliable system and enhances user experience. The process of intelligently distributing different content over various edge servers can also contribute to increased reliability of the system. Chen et al. [5] used the Particle Swarm Optimization algorithm to find a suitable replica server for a specific content based on factors such as memory, CPU, connection, storage availability and bandwidth usage.
The authors [6–10] have worked on various systems to analyze their performances using Markov regenerative processes under reliability approach.
In this research work, we have taken into consideration major failure states in a CDN and considered the event of a client’s request to the fulfilment/failure of his request by the server, to be a Markov process and proposed the following model.
2 Assumptions
A robust distribution network is supposed to deliver on all incoming requests with minimum possible delays. The authors have thus considered a newly installed, functioning system and the following assumptions have been made regarding it.
(i) In the initial state, the network/system is in good state.
(ii) The network covers three states- good, degraded, failed.
(iii) At any instant, only one change is allowed in the transition states.
(iv) The network can have partial failure or complete failure.
(v) A repaired component in the network, works as good as new.
3 System Description
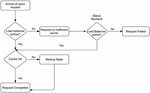
The flow of control within the network is as follows – Firstly, a client’s request arrives at the load controller via the internet. In case of proper functioning of the load balancer, the request is transferred to a suitable edge server by making use of an appropriate load balancing algorithm. In case of any hardware/software failure of the load balancer the request is forwarded to an unsuitable edge server not functioning properly. At this point of time if the load balancer is active again and detects the problem, the request is re-routed to a new fully functioning edge server capable of completing the request [15]. But, if the load balancer is yet to fail again, a state of complete failure is reached (as show in Figure 2) where the users’ request fails and no content is served to him.
Whereas, on the arrival of request if the load balancer is functioning efficiently, the request is successfully transferred to a geographically apt edge server that has frequently served the same request (cache hit) and the client’s request is successfully completed with the content being fetched to him in a matter of milliseconds.
Here, another condition arises. Even though the load balancer may not be experiencing any failures, sometimes if a particular request is made for the first time or from a new location, the appropriate edge server may not have the requested data cached in advance, resulting in a cache miss and hence causing some delay. Nevertheless, the server is capable of completing the request. Hence after a minute delay the edge server caches the requested data by fetching it from the main server and completes the client’s request. Whole process of this networking is demonstrated by the flow chart as given in Figure 7.
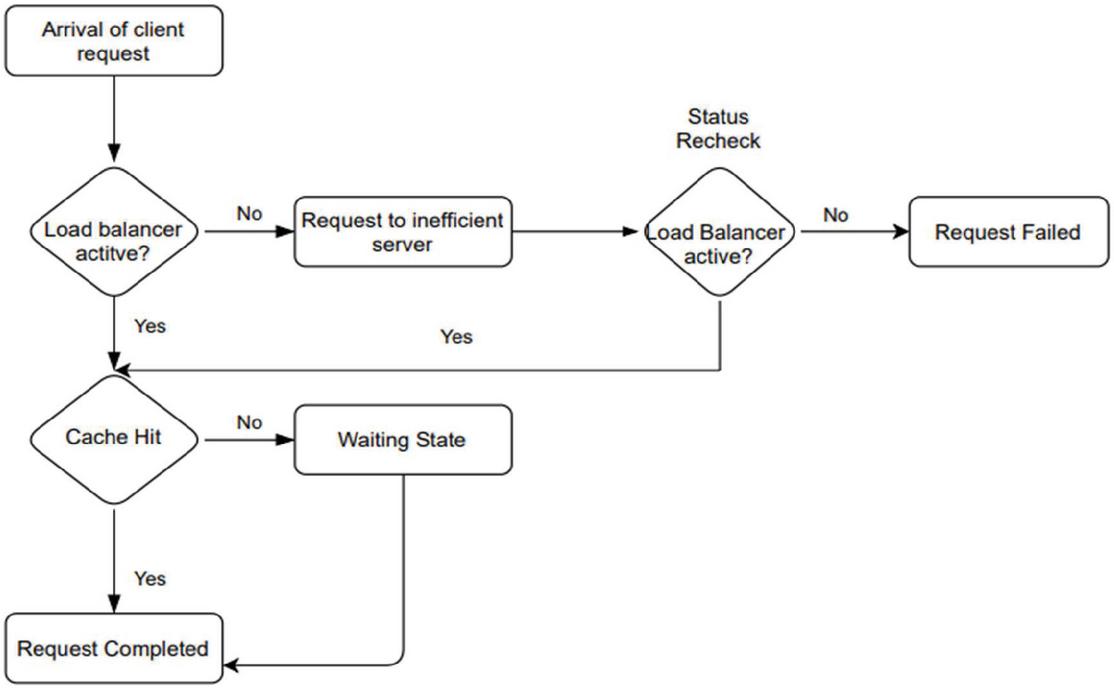
Figure 1 Workflow.
4 Notation
Notation used in this work are described in Table 1.
Table 1 Notation
| Time Scale | |
| s | Laplace variable |
| P(t) | Initial state probability |
| P(t) | The probability of stage S where |
| P(x, t) | The probability density function of failed state S |
| Common cause failure in network/infrastructure | |
| c | Rate of cache miss at edge server |
| l | Rate of load balancer failure |
| r | Rate of redundant requests |
| w | Waiting time to fetch data from main server |
| (x) | Repair rate |
5 State Description
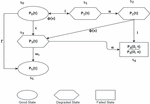
States used in the state transition diagram (Figure 2) are described as –
S Client’s request arrival
S Request accepted but load balancer failure
S Request forwarded to inoperative server due to network/infrastructure failure
S Request forwarded to operative edge server but not the most efficient one
S Request failed/ No content loaded
S Request successful/Content fetched to client
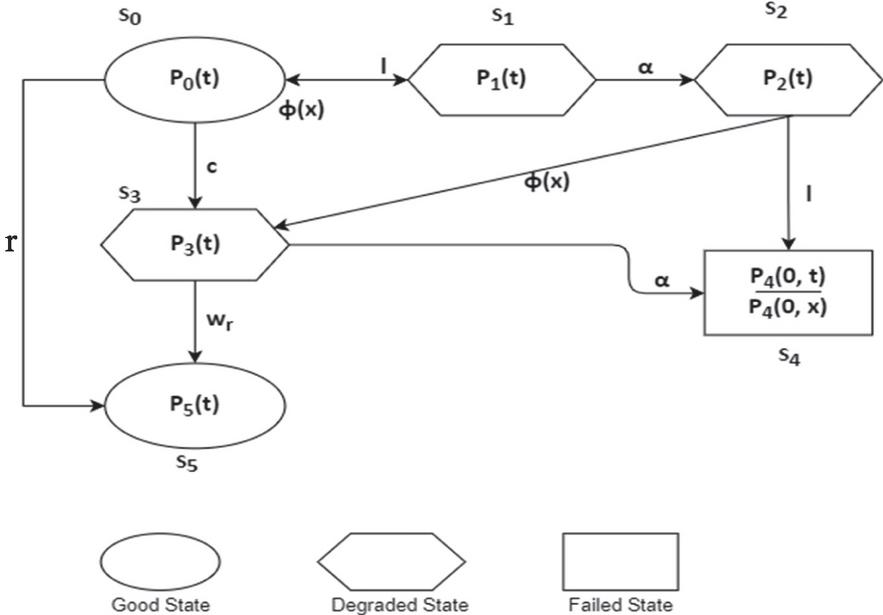
Figure 2 State transition diagram.
6 Formulation of the Model
By the probability of consideration and continuity of arguments, one can obtain the following set of differential equations possesses the present mathematical model
| (1) | |
| (2) | |
| (3) | |
| (4) | |
| (5) | |
| (6) |
Boundary Condition
| (7) |
Initial condition
| (8) |
6.1 Solution of the Model
Taking the Laplace transformation of Equations (1) to (7), using Equation (8) –
| (9) | |
| (10) | |
| (11) | |
| (12) | |
| (13) | |
| (14) |
Boundary Condition
| (15) |
State transition probabilities are
Network upstate and downstate probabilities-
| (16) | ||
| (17) |
7 Particular Cases and Numerical Computation
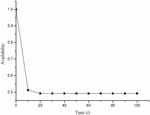
7.1 Reliability Analysis
System is how much reliable, can be calculated by taking the inverse Laplace transformation of Equation (16) and setting the value of various parameters as , , , , , [20, 21], one can obtain reliability of the system in terms of time t as
| (18) |
Now, varying the time t from 0 to 15 in Equation (18), one acquires the reliability of designed system as shown in Table 2 and corresponding Figure 3 respectively.
Table 2 Reliability of the system
| Time () | Reliability Rl(t) |
| 0 | 1.00000 |
| 10 | 0.31926 |
| 20 | 0.31820 |
| 30 | 0.31818 |
| 40 | 0.31818 |
| 50 | 0.31818 |
| 60 | 0.31818 |
| 70 | 0.31818 |
| 80 | 0.31818 |
| 90 | 0.31818 |
| 100 | 0.31818 |
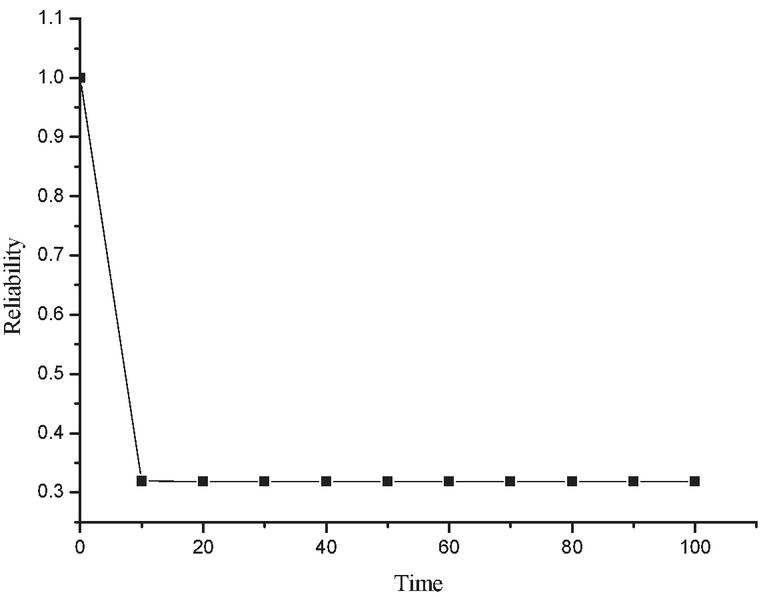
Figure 3 Reliability vs time.
7.2 Availability Analysis
Consider the repair facility is available. Setting the value of various parameters as , , , , , [20–22] and taking the inverse Laplace transformation of Equation (16), one can obtain availability of the system in terms of time t as
| (19) |
Now varying the time t from 0 to 15 in Equation (19), one obtains the availability of designed system as shown in Table 3 and corresponding Figure 4 respectively.
Table 3 Availability of the system
| Time () | Reliability Rl(t) |
| 0 | 1.00000 |
| 10 | 0.51248 |
| 20 | 0.49277 |
| 30 | 0.49252 |
| 40 | 0.49252 |
| 50 | 0.49252 |
| 60 | 0.49252 |
| 70 | 0.49252 |
| 80 | 0.49252 |
| 90 | 0.49252 |
| 100 | 0.49252 |
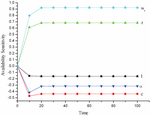
7.3 Sensitivity Analysis
Sensitivity analysis is the process of assessing how different sources of input contribute to the uncertainty in a particular output. Sensitivity of an output parameter, by any input factor, is defined as its partial derivative with respect to that input factor. In such manner, one can assess the sensitivity of availability and reliability of the system.
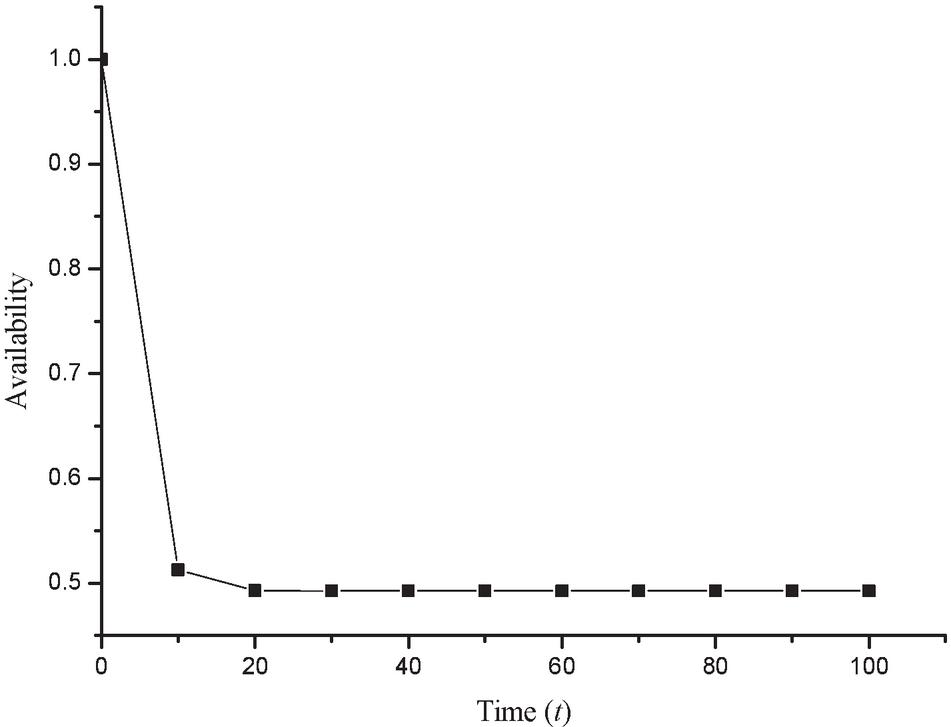
Figure 4 Availability vs time.
Table 4 Availability sensitivity as function of time
| Availability Sensitivity | |||||
| Time (t) | |||||
| 0 | 0.00000 | 0.00000 | 0.00000 | 0.00000 | 0.00000 |
| 10 | –0.15500 | –0.47116 | 0.61090 | –0.41391 | 0.79696 |
| 20 | –0.16081 | –0.43959 | 0.68172 | –0.31878 | 0.92062 |
| 30 | –0.16094 | –0.43866 | 0.68312 | –0.31577 | 0.92365 |
| 40 | –0.16094 | –0.43865 | 0.68314 | –0.31572 | 0.92370 |
| 50 | –0.16094 | –0.43865 | 0.68314 | –0.31572 | 0.92370 |
| 60 | –0.16094 | –0.43865 | 0.68314 | –0.31572 | 0.92370 |
| 70 | –0.16094 | –0.43865 | 0.68314 | –0.31572 | 0.92370 |
| 80 | –0.16094 | –0.43865 | 0.68314 | –0.31572 | 0.92370 |
| 90 | –0.16094 | –0.43865 | 0.68314 | –0.31572 | 0.92370 |
| 100 | –0.16094 | –0.43865 | 0.68314 | –0.31572 | 0.92370 |
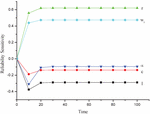
7.3.1 Availability sensitivity
The sensitivity of availability of CDN network is shown in Table 4 and Figure 5.
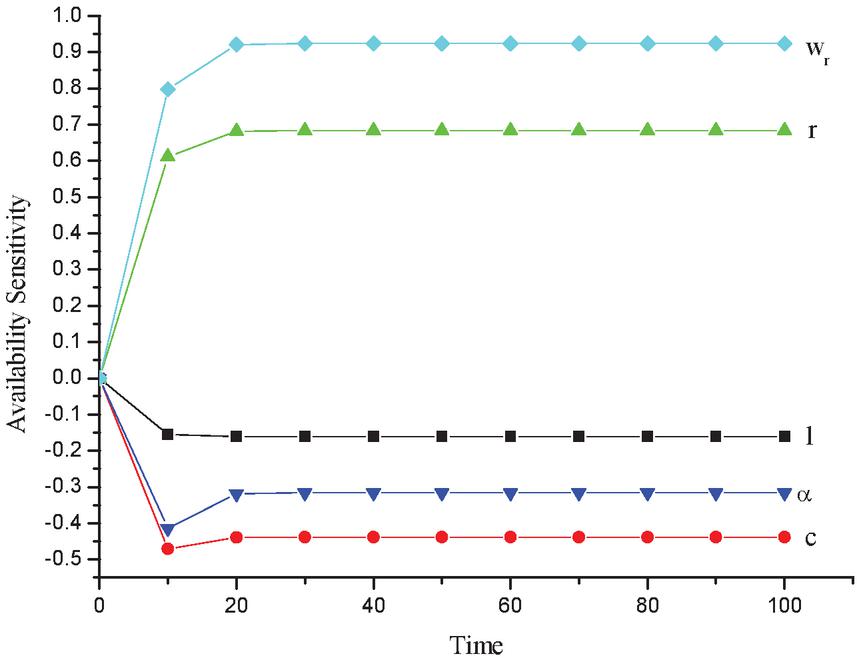
Figure 5 Availability sensitivity vs time.
Here, the negative results of availability sensitivity are useful of detecting the faults or failures in the CDN. It would definitely determine the faults. However, a positive result is not necessarily ruled out the faults or failures in CDN. The results of availability sensitivity with respect cache miss, load balancer and common cause failure gives the best fit.
7.3.2 Reliability sensitivity
The reliability sensitivity of CDN is computed using Equation (16) and revealed in Table 5 and Figure 6.
Table 5 Reliability sensitivity as function of time
| Reliability Sensitivity | |||||
| Time (t) | |||||
| 0 | 0.00000 | 0.00000 | 0.00000 | 0.00000 | 0.00000 |
| 10 | –0.37625 | –0.18807 | 0.55845 | –0.30844 | 0.43873 |
| 20 | –0.29396 | –0.13915 | 0.61833 | –0.10735 | 0.47292 |
| 30 | –0.28938 | –0.13777 | 0.61980 | –0.09512 | 0.47348 |
| 40 | –0.28926 | –0.13774 | 0.61983 | –0.09471 | 0.47348 |
| 50 | –0.28926 | –0.13774 | 0.61983 | –0.09470 | 0.47348 |
| 60 | –0.28926 | –0.13774 | 0.61983 | –0.09470 | 0.47348 |
| 70 | –0.28926 | –0.13774 | 0.61983 | –0.09470 | 0.47348 |
| 80 | –0.28926 | –0.13774 | 0.61983 | –0.09470 | 0.47348 |
| 90 | –0.28926 | –0.13774 | 0.61983 | –0.09470 | 0.47348 |
| 100 | –0.28926 | –0.13774 | 0.61983 | –0.09470 | 0.47348 |
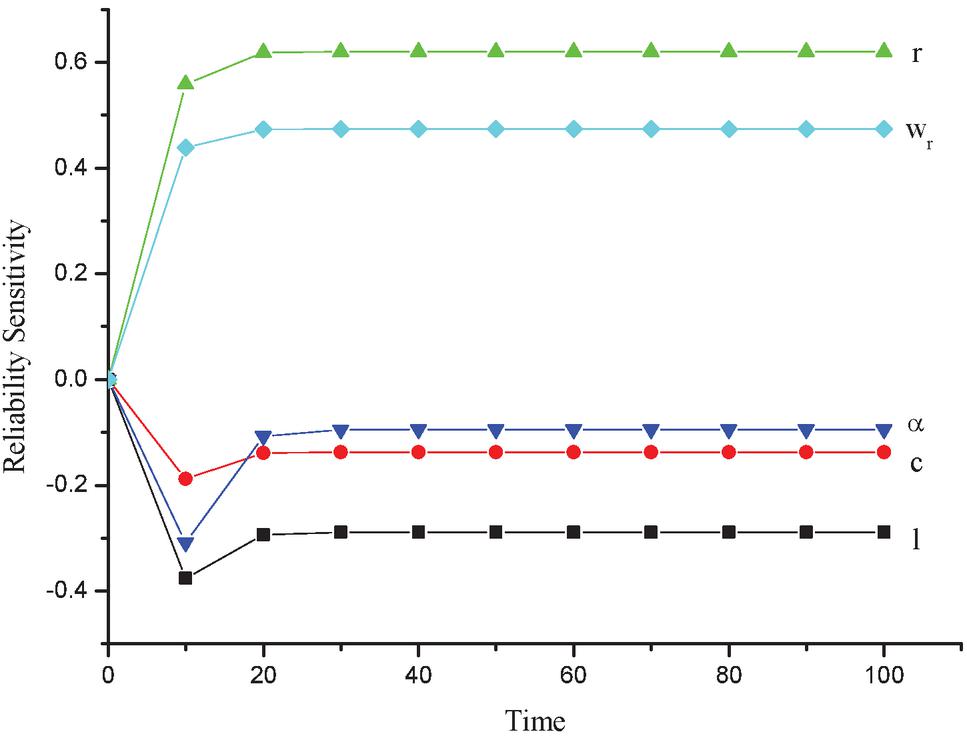
Figure 6 Reliability sensitivity vs time.
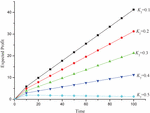
7.4 Expected Cost
Expected profit has a great importance to maintain system reliability [19]. Let the service facility be always available, the expected profit during the interval is given as:
| (20) |
Let us consider the value of and the value of varies as 0.1, 0.2, 0.3, 0.4 and 0.5 respectively, one obtains Table 6 and Figure 7, which epitomizes the graph of expected profit with respect to time.
Table 6 Expected profit as function of time
| Expected Profit (t) | |||||
| Time (t) | |||||
| 0 | 0.00000 | 0.00000 | 0.00000 | 0.00000 | 0.00000 |
| 10 | 5.89595 | 4.89595 | 3.89595 | 2.89595 | 1.89595 |
| 20 | 9.86707 | 7.86707 | 5.86707 | 3.86707 | 1.86707 |
| 30 | 13.79281 | 10.79281 | 7.79281 | 4.79281 | 1.79281 |
| 40 | 17.71803 | 13.71803 | 9.71803 | 5.71803 | 1.71803 |
| 50 | 21.64324 | 16.64324 | 11.64324 | 6.64324 | 1.64324 |
| 60 | 25.56846 | 19.56846 | 13.56846 | 7.56846 | 1.56846 |
| 70 | 29.49367 | 22.49367 | 15.49367 | 8.49367 | 1.49367 |
| 80 | 33.41888 | 25.41888 | 17.41888 | 9.41888 | 1.41888 |
| 90 | 37.34410 | 28.34410 | 19.34410 | 10.34410 | 1.34410 |
| 100 | 41.26931 | 31.26931 | 21.26931 | 11.26931 | 1.26931 |
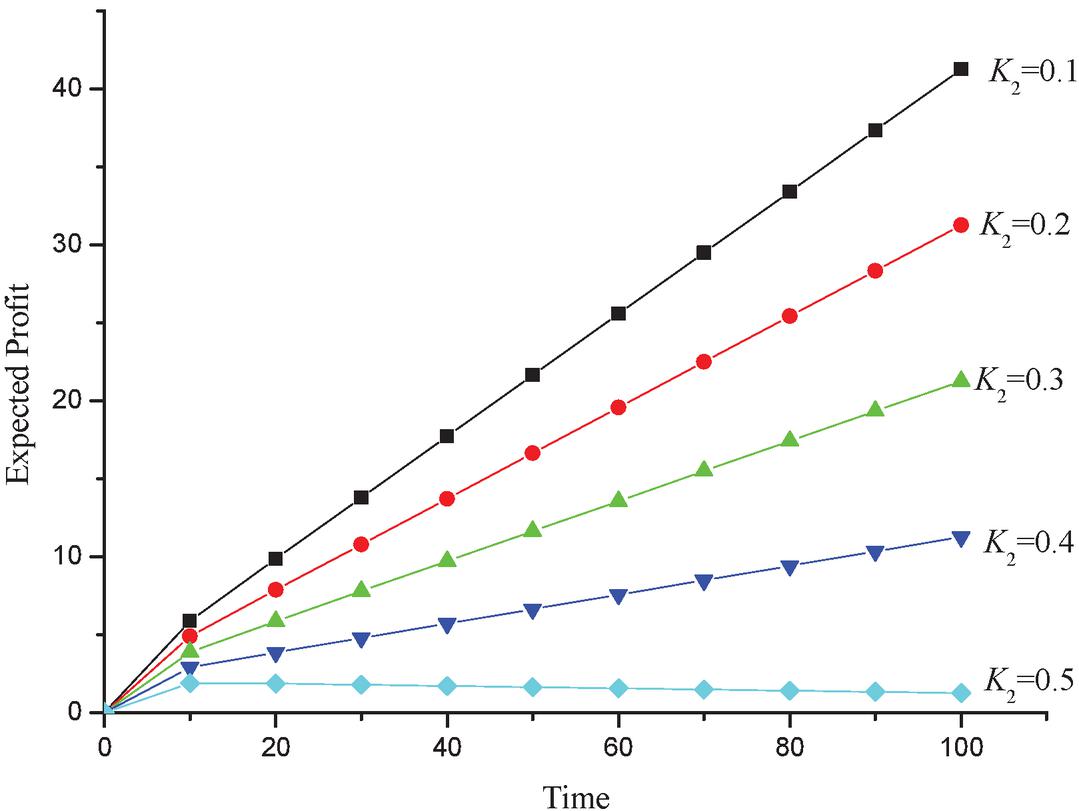
Figure 7 Expected profit vs time.
From the obtained results, we can conclude that the expected profit from the system will increase over time and decrease with increment in service cost. For instance, signifies a 20% service cost for the system and the expected profit during this time period will be lesser than the corresponding profits during the time when service cost was 10%. i.e., . Also, the rate of increment in profits will also decrease in case of higher service costs. Hence with overly-increasing service costs, expected profits from the system will fail to rise over time.
8 Result Discussion & Conclusion
On the basis of the obtained results, the following conclusions can be made:
• The graph of reliability vs time shows a sharp decrease in reliability once failure occurs and afterwards remains constant at low reliability over time.
• The graph of availability of system vs time also shows similar pattern resulting in a sharp availability decrease over time.
• We can conclude from the reliability sensitivity results that the network is most sensitive to load balancer and network failures. Focusing on making these subparts more reliable can increase the overall reliability of the network considerably.
• From the availability sensitivity results it is evident that cache miss plays a prominent role in causing delay and decreasing the network’s availability.
• The results of the expected profit of the system with respect to service cost and time is shown in Figure 7. It is clear that the profit from the system decreases with increase in service cost with time.
Thus, from this research one can conclude the reliability of any content delivery network and control various parameters to test the crucial factors affecting the system’s efficiency. Thereafter the system can be made more robust against these failures by introducing fallback mechanisms or more focus can be diverted on making crucial components more reliable and robust, thus increasing the overall reliability of the system. Such modelling is not only beneficial in testing networks post-deployment but also analyzing them in pre-deployment phase by emulating the functioning of the network by modelling it into multiple probable states and finding the most crucial components contributing to immediate failure in the network. Therefore, one can assert that similar networks in engineering applications can be assessed for their efficacy using this research pattern. Future work in this research can be focused around analyzing a n-node distribution network in similar fashion.
References
[1] P. Gupta, M. K. Goyal, and N. Gupta. Reliability aware load balancing algorithm for content delivery network. Emerging ICT for Bridging the Future-Proceedings of the 49th Annual Convention of the Computer Society of India (CSI), Volume 1. Springer, Cham, 2015.
[2] L. Wang, K. Park, R. Pang, V. S. Pai, & L. L. Peterson. Reliability and Security in the CoDeeN Content Distribution Network. In USENIX Annual Technical Conference, General Track, pp. 171–184, 2004, June.
[3] X. Jiang, & J. Bi. NCDN: CDN enhanced with NDN. In 2014 IEEE Conference on Computer Communications Workshops (INFOCOM WKSHP S), pp. 440–445, 2014.
[4] H. Yin, X. Liu, T. Zhan, V. Sekar, F. Qiu, C. Lin, & B. Li. Design and deployment of a hybrid CDN-P2P system for live video streaming: experiences with LiveSky. In Proceedings of the 17th ACM international conference on Multimedia, pp. 25–34, 2009.
[5] J. B. Chen, and C. C. Chen. Using particle swarm optimization algorithm in multimedia CDN content placement. In 2012 Fifth International Symposium on Parallel Architectures, Algorithms and Programming, pp. 45–51. IEEE, 2012.
[6] A. Kumar & M. Ram. System reliability measures in the presence of common cause failures. International Journal of Industrial and Systems Engineering, 24(1), 44–61, 2016.
[7] N. Goyal, M. Ram, & A. K. Dua. An Approach to Investigating Reliability Indices for Tree Topology Network. Cybernetics and Systems, 47(7), 570–584, 2016.
[8] T. Joshi, K. Nagiya, and M. Ram. Performance evaluation of a wireless sensor actuator network under reliability approach. Mathematics in Engineering, Science & Aerospace (MESA) 11(1), 2020.
[9] N. Goyal, M. Ram & A. Mittal. Reliability measures analysis of a computer system incorporating two types of repair under copula approach. In Numerical methods for reliability and safety assessment, pp. 365–385, Springer, Cham, 2015.
[10] M. Ram & K. Nagiya, K. Performance evaluation of mobile communication system with reliability measures. International Journal of Quality & Reliability Management, 33(3), 2016.
[11] C. R. Kalmanek, I. Ge, S. Lee, C. Lund, D. Pei, J. Seidel,…& J. Ates. Darkstar: Using exploratory data mining to raise the bar on network reliability and performance. In 2009 7th International Workshop on Design of Reliable Communication Networks, pp. 1–10, 2009, October.
[12] T. N. Kim, S. Jeon, & Y. Kim. A CDN-P2P hybrid architecture with content/location awareness for live streaming service networks. In 2011 IEEE 15th International Symposium on Consumer Electronics (ISCE), pp. 438–441, 2011, June.
[13] M. M. Afergan, F. T. Leighton, & J. G. Parikh. U.S. Patent No. 8,332,484. Washington, DC: U.S. Patent and Trademark Office, 2012.
[14] N. Zhao, Y. Wang, N. Cao, & X. Gong. HTMTAD: A Model to Detect Anomalies of CDN Traffic Based on Improved HTM Network. In International Conference on Neural Information Processing, pp. 634–646, Springer, Cham, 2018.
[15] J. M. Wein, J. J. Kloninger, M. C. Nottingham, D. R. Karger & P. A. Lisiecki. U.S. Patent No. 8,122,102. Washington, DC: U.S. Patent and Trademark Office, 2012.
[16] R. de Souza Couto, S. Secci, M. E. M. Campista & L. H. M. K. Costa. Reliability and survivability analysis of data center network topologies. Journal of Network and Systems Management, 24(2), 346–392, 2016.
[17] G. A. Ray, & J. J. Dunsmore. Reliability of network topologies. In IEEE INFOCOM’88, Seventh Annual Joint Conference of the IEEE Computer and Communications Societies. Networks: Evolution or Revolution? pp. 842–850, 1988.
[18] S. Pierre & G. Legault. A genetic algorithm for designing distributed computer network topologies. IEEE Transactions on Systems, Man, and Cybernetics, Part B (Cybernetics), 28(2), 249–258, 1998.
[19] F. Houeto, S. Pierre, R. Beaubrun & Y. Lemieux. Reliability and cost evaluation of third-generation wireless access network topologies: a case study. IEEE Transactions on reliability, 51(2), 229–239, 2002.
[20] N. Goyal, M., Ram, S. Amoli & A. Suyal. Sensitivity analysis of a three-unit series system under k-out-of-n redundancy. International Journal of Quality & Reliability Management, 34(6), 2017.
[21] M. Ram & N. Goyal. Bi-directional system analysis under copula-coverage approach. Communications in Statistics-Simulation and Computation, 47(6), 1831–1844, 2018.
[22] P. Gaur, A. Tandon, N. Goyal, G. Chandwani & M. Ram. An Analysis of Hierarchical Software-Defined Network Control Plane: A Reliability Approach. International Journal of Reliability, Quality and Safety Engineering, 27(03), 2050010, 2020.
Biographies

Nupur Goyal received the Bachelor’s degree in Computer science in 2009 from Kurukshetra University, Kurukshetra, Haryana, India. She received the master’s degree in mathematics in 2011 from H.N.B. Garhwal University, Srinagar, Uttarakhand, India and Ph.D. degree from Graphic Era University, Dehradun, Uttarakhand, India in November 2016. Her research interests are in the area of reliability theory. She has been an Assistant Professor in the Mathematics Department of the Suraj Degree College, Mahendergarh, Haryana in 2016. She has been an Assistant Professor in the Mathematics Department of the Garg Degree College, Laksar, Haridwar from 2017 to October 2018. She has been an Assistant Professor and Head of the Department of Applied Science and Humanities Department, Roorkee Institute of Technology, Roorkee from October 2018 to January 2020. Currently, she is an Assistant Professor in the Mathematics Department of the Graphic Era Deemed to be University, Dehradun, India. She is a reviewer of various international journals including Springer, Emerald and IEEE. She has published 32 research papers in various reputed national and international journals including Springer, Emerald, Taylor & Francis, Inderscience and many other and also presented her research works at national and international conferences.

Tanuja Joshi has under-graduated in B.Tech. program at the Graphic Era University, Dehradun, India in Computer Science and Engineering. Currently, Tanuja Joshi is working with Infosys as a Specialist Programmer. She has a strong interest in the field of software engineering focusing on software process, requirements engineering and software quality.

Mangey Ram received the Ph.D. degree major in Mathematics and minor in Computer Science from G. B. Pant University of Agriculture and Technology, Pantnagar, India. He has been a Faculty Member for around twelve years and has taught several core courses in pure and applied mathematics at undergraduate, postgraduate, and doctorate levels. He is currently the Research Professor at Graphic Era (Deemed to be University), Dehradun, India. Before joining the Graphic Era, he was a Deputy Manager (Probationary Officer) with Syndicate Bank for a short period. He is Editor-in-Chief of International Journal of Mathematical, Engineering and Management Sciences, Journal of Reliability and Statistical Studies, Editor-in-Chief of six Book Series with Elsevier, CRC Press-A Taylor and Frances Group, Walter De Gruyter Publisher Germany, River Publishers and the Guest Editor & Member of the editorial board of various journals. He has published 225 plus research publications (journal articles/books/book chapters/conference articles) in IEEE, Taylor & Francis, Springer, Elsevier, Emerald, World Scientific and many other national and international journals and conferences. Also, he has published more than 50 plus books (authored/edited) with international publishers like Elsevier, Springer Nature, CRC Press-A Taylor and Frances Group, Walter De Gruyter Publisher Germany, River Publisher. His fields of research are reliability theory and applied mathematics. Dr. Ram is a Senior Member of the IEEE, Senior Life Member of Operational Research Society of India, Society for Reliability Engineering, Quality and Operations Management in India, Indian Society of Industrial and Applied Mathematics. He has been a member of the organizing committee of a number of international and national conferences, seminars, and workshops. He has been conferred with “Young Scientist Award” by the Uttarakhand State Council for Science and Technology, Dehradun, in 2009. He has been awarded the “Best Faculty Award” in 2011; “Research Excellence Award” in 2015; and recently “Outstanding Researcher Award” in 2018 for his significant contribution in academics and research at Graphic Era Deemed to be University, Dehradun, India.
Journal of Cyber Security and Mobility, Vol. 10_4, 679–698.
doi: 10.13052/jcsm2245-1439.1043
© 2021 River Publishers