Bio-Inspired PSO for Improving Neural Based Diabetes Prediction System
Mohammad Zubair Khan1,*, R. Mangayarkarasi2, C. Vanmathi2 and M. Angulakshmi2
1Department of Computer Science and Information, Taibah University, Medina, Saudi Arabia
2School of Information Technology and Engineering, VIT University, Vellore Campus, India
E-mail: zubair.762001@gmail.com; rmangayarkarasi@vit.ac.in; vanmathi.c@vit.ac.in; angulakshmi.m@vit.ac.in
*Corresponding Author
Received 21 November 2021; Accepted 30 November 2021; Publication 06 May 2022
Abstract
A high level of glucose in the blood over a long period creates diabetes disease. Undiagnosed diabetes may trigger other complications such as cardiovascular disease, nerve damage, renal failure, and so on. There are many factors age, blood pressure, food habits, lifestyle changes are some of the reasons for diabetes. With increasing cases of diabetes in the smart Internet world, there is a need for an automated prediction system to facilitate the patients, to get know, whether they are affected by the disease or not. There are many diabetes prediction software that is already in use, still, the accurateness of a diabetes prediction is not complete. This paper presents a robust framework (PSO-NNDP), employs a novel hybrid feature selector to improvise the neural-based diabetes prediction system. The novel hybrid feature selector presented in this paper comprises the merits of the correlation coefficient, F-score, and particle swarm optimization methods to influence the feature selection process. The reliability of the proposed framework has been experimented on the benchmarking dataset. By establishing the clear steps, for the replacement of missing values, removal of outliers, the proposed framework obtains 99.5% accuracy. Moreover, the experimented machine learning models also show a great improvement upon the usage of the proposed feature selector.
Keywords: Particle swarm optimization (PSO), neural-network, hybrid-feature-selection, machine learning, diabetes prediction.
1 Introduction
Diabetes is one of the recurrent illnesses that goals older people all over the world. The survey states in the next 26 years there is a desire of 693 million people may chance to affect by diabetes [1]. International Diabetes Federation in 2017, the testimony states that 425 million diabetics on the planet at that point, and it was likewise reasoned, the count will increment by 2045 to 625 million [2]. The gathering of endocrine sicknesses related to weakened glucose take-up creates because the outright or relative deficiency of the hormone ”Insulin” is due to Diabetes mellitus. The illness is described by a persistent sequence, just as an infringement of a wide range of digestion. Based on the surveys diabetes is characterized into four classes [3]: type 1 diabetes, type 2 diabetes, gestational diabetes mellitus, and explicit sorts of diabetes because of different causes. The most well-known sorts of sickness are the accompanying two: type 1 diabetes (T1D) and type 2 diabetes (T2D). The previous is brought about by the annihilation of the pancreatic beta cells, bringing about insulin insufficiency, while the last is the ineffectual transference of insulin into cells.
Enterprise Resource Planning (ERP) programming is playing a major role in the ANN model which executes the work processes with objects which are easy to use yet can’t be effortlessly actualized. To encourage the decision support system stage usage and execution, it is desirable to install ANN contents straightforwardly into the ERP system. Due to this reason, it is desirable to embrace the Python Language, which can be effortlessly implanted in various ERP systems. In the past writing the Long Short-Term Memory (LSTM) neural organization has been embraced for prescient diagnostics, guaranteeing great execution effects [4–6]. The entry from the work process execution to the python content is important to appropriately plan a neural organization installed into an ERP stage, conceivably empowering information handling automatisms. To test the LSTM neural organization, check the presentation of the updated network has been prepared the trial dataset of [7, 8], which is called as signifying a worthy dataset. To test the various data mining techniques test data [8, 9] has been incorporated. The authors in [10] have investigated distinctive machine learning algorithms for diabetes forecast, the K-means algorithm is applied for anticipating diabetes. About [9] a few authors applied engineered information to adjust an AI dataset model.
Though many researchers implement many diabetes prediction frameworks, choosing the correct set of independent or feature variables, and that too, in line with the health care experts’ knowledge is a challenging task. Thus, the proposed work ensures the derived set of pre-dominant features is in line with the experts’ choice and the same is verified through experimental results. The rest of the paper is organized as follows; Section 2 discusses various methodologies deployed for developing diabetes prediction frameworks. Section 3 discusses the comprehensive methodology of the proposed diabetes prediction framework. Section 4 discloses the obtained result. Section 5 concludes the paper.
2 Related Work
This section discusses the complex architecture used in designing the diabetes prediction framework. Machine learning and deep neural network classifiers utilize the execution estimate, for example, accuracy to decide the best deep neural network algorithm [11]. In [12] the authors proposed linking hybrid evolutionary methodology together with the convolutional neural network (CNN) and decided the channels and the number of layers which is based on the client needs. In paper [13] the authors build a deep neural network and utilize the information from lab tests, segment data, and wearable sensors to make the model. They have proposed the GA-ELM algorithm a hybrid algorithm, which ideally analyses sort 2-diabetes patients, and ordered the data collection by the exactness of 97.5% by utilizing six powerful features of the dataset [14]. The utilization of deep learning and machine learning algorithms for diabetes prediction by incorporating the recognized models for predicting diabetes.
Extricating information and designs for treating the disease gets to be more critical to implementing the advancements in the field of community medication and telemedicine. Restorative information incorporate manufactured neural network, genetic algorithms, fuzzy framework, rough set, and vector machine [15]. GA (Genetic Algorithm) has different descendants and investigated the arrangements differently. Genetic algorithms may be implemented in parallel [16]. Divide the information into groups by applying the K-means algorithm.
Besides, [17] the authors used the Pima Indian dataset to predict diabetes by applying the Recurrent Neural Network (RNN). The dataset contains 768 examples and eight credits. The qualities are requested by their most elevated significance as demonstrated in their investigation “Glucose, BMI, Age, Pregnancies, Diabetes Pedigree Function, Blood Pressure, Skin Thickness, and Insulin”. To approve the investigation, they have used 20% for the testing and the rest for training. Diabetes type 1 has a precision of 78% and for Type 2 it was 81%. A one-dimensional CNN algorithm was used to predict diabetes in this work [18]. The authors gathered a dataset for breath signals made out of eleven solid patients, five patients of Type 1, and nine patients of Type 2. For the approval cycle, the authors utilized Leave-One Out Cross-Validation. The enactment was assessed by applying the Receiver Operating Characteristics (ROC) curve which arrived at 0.96 [19]. Presents a diabetes prediction framework by combining the merits of BPSO (Binary Particle swarm optimization) for selecting the feature thereby Decision Tree-based classifier has been improved with 97.6% as its accuracy. While developing health care software, the methodology should ensure preciseness in prediction and that is the much-anticipated demand from the health care software. The further diagnosis steps purely rely on the predicted results. So, the main objective of the proposed diabetes framework is to ensure the best possible prediction.
3 Proposed PSO-NNDP Framework
The architecture of the proposed diabetics’ prediction is illustrated in Figure 1, where the preprocessing module is an integral part of the proposed scheme. Ensuring data quality assists classifiers to learn precisely. The dataset used to experiment with the proposed framework is downloaded from [7]. Dataset is compiled by the National Institute of Diabetes and Digestive and Kidney Diseases. The instances are collected under carefully designed criteria. As per the statistics, the Pima Indians from Arizona and Mexico have the most extensive reported prevalence of diabetes in the world. The samples are collected from the females and the minimum age is 21 years old of Pima Indian heritage. The experimented dataset has eight independent variables (IV) and one dependent variable (DV). Table 1 summarizes the description of independent as a well dependent variable. The dataset contains 768 total instances. Among the total 768 instances, 500 samples belong to non-diabetics class and the remaining 268 instances are belong to the diabetic class. The proposed framework used the PIMA dataset since it is well established. The collected samples against two output labels distribution are shown in Figure 1.

Figure 1 The architecture of PSO-NNDP.
3.1 Data Preprocessing
The proposed framework preprocessing is carried out with three (Outlier Removal, Replacing missing sample values, and Data-standardization) steps. In the first step of preprocessing outliers [20, 21] are removed using the box-plot tool. Figure 3 shows the statistical distribution of independent and dependent variables.
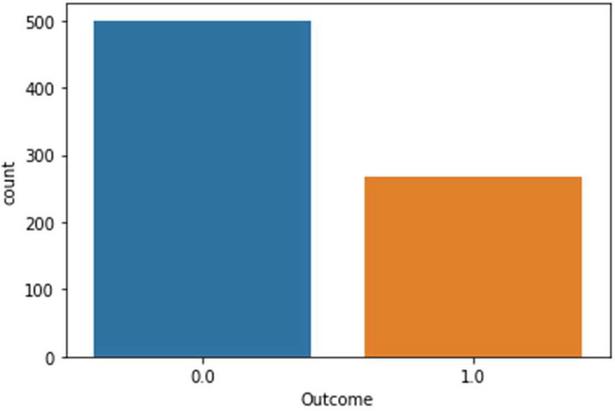
Figure 2 Samples distribution statistics against output classes.
Table 1 Feature columns in the experimented dataset
| Feature-Column | Attribute | Description |
| IV1 | Pregnancies | Number of times pregnant |
| IV2 | Glucose | Plasma glucose concentration |
| IV3 | Blood pressure | Diastolic blood pressure (mm Hg) |
| IV4 | Skin thickness | Triceps skinfold thickness (mm) |
| IV5 | Insulin | 2-Hour serum insulin (mu U/ml) |
| IV6 | BMI | Body mass index |
| IV7 | DiabetesPedigreeFunction | Diabetes pedigree function |
| IV8 | Age | Age of patient (in years) |
| DV | Outcome | Class variable. 1 for diabetic and |
| 0 for non-diabetic. |
The Maximum outlier lies in the range TQ3 1.5*IQR and the Minimum outlier lies in the range FQ1 1.5*IQR. The interpretation is any values that are greater than the value of ‘maximum outlier’ and which is less than the value of ‘minimum outlier’ are declared as an outlier and those data are removed from the instances. The mathematical interpretation of outlier rejection is mentioned in Equation (1)
| (1) |
The data about the outliers in the instances can be found in Figure 4. Some of the feature columns have null values. The null values can be dealt with either by removing those instances or those missing values can be computed using various imputation methods. The proposed framework replaces the missing values by computing the mean value of the independent variables rather than dropping them. The values of the independent variable in the PID are available in dissimilar scales, so proceed further, the values need to be standardized to have a mean value of zero and a standard deviation via Equation (2). Standardization helps to reduce the skewness in the data points, which is essential to train the Machine learning classifiers.
| (2) |
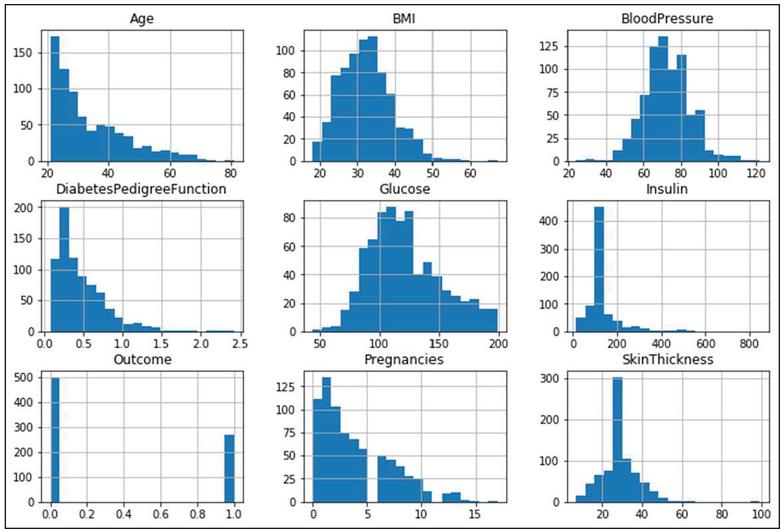
Figure 3 The statistical distribution of eight independent and one dependent variable.
3.2 Independent Variable Selection
Independent variable or Feature set selection is an important phase for designing any machine learning classifier. Prevalent feature set selection not only reduces unnecessary training time but also influences the classification process. In the first step of the preprocessing, analysis of feature column dependence has been done using the Correlation feature selection tool as represented in Equation (3). The actual n-dimensional data, , and .
| (3) |
The computed correlation coefficient values obtained for the applied independent and dependent variables are tabulated in Table 2. The values of Table 2, conveys that none of the feature columns is strongly related to each other. According to the correlation tool, the Independent variables IV2, IV6, IV8, IV1, IV7 are the topmost influential factors on the Dependent Variable (DV). After applying the imputation method to fill the null values, some of the independent variables (IV3, IV4, and IV5) impact on dependent variables has been improvised. Thus, all experimented independent variables became eligible for classifying the input pattern.
Table 2 Independent variables dependencies value for the experimented dataset
| IV1 | IV2 | IV3 | IV4 | IV5 | IV6 | IV7 | IV8 | DV | |
| IV1 | 1 | 0.13 | 0.14 | 0.08 | 0.07 | 0.02 | 0.03 | 0.54 | 0.22 |
| IV2 | 0.13 | 1 | 0.15 | 0.06 | 0.03 | 0.22 | 0.14 | 0.26 | 0.47 |
| IV3 | 0.14 | 0.15 | 1 | 0.21 | 0.09 | 0.28 | 0.04 | 0.24 | 0.07 |
| IV4 | 0.08 | 0.06 | 0.21 | 1 | 0.04 | 0.39 | 0.18 | 0.11 | 0.07 |
| IV5 | 0.07 | 0.33 | 0.09 | 0.44 | 1 | 0.2 | 0.19 | 0.04 | 0.13 |
| IV6 | 0.02 | 0.22 | 0.28 | 0.39 | 0.02 | 1 | 0.14 | 0.04 | 0.29 |
| IV7 | 0.03 | 0.14 | 0.04 | 0.18 | 0.19 | 0.14 | 1 | 0.03 | 0.17 |
| IV8 | 0.54 | 0.26 | 0.24 | 0.11 | 0.04 | 0.04 | 0.03 | 1 | 0.24 |
| DV | 0.22 | 0.47 | 0.07 | 0.07 | 0.1 | 0.29 | 0.17 | 0.24 | 1 |
The predictive model presented in [22] and [23] uses F-score for identifying the pre-dominant independent variables. The F score computation can be found in [20] and [21]. While sorting the contribution of the independent variables according to F-score computation, IV1, IV2, IV3, IV5, IV6, IV7, and IV8 are the major influencing variables in the experimented dataset. In [24–26] demonstrated the influence of particle swarm optimization for feature selection. Eberhart and Kennedy have developed a population-based PSO that is fruitful and recognized as an appreciated overall search method. An appropriate procedure to represent feature selection problems owing to succeeding details informal feature encoding, the ability of overall examination, being sensible computationally, parameters is less, and cooler application. The PSO is useful for feature choice owing to the above-mentioned details and hence it is used in the proposed framework in the binary domain (BPSO).
The main objective is to examine the principal components subsets and explore the major features via PSO. The particles signify applicant solutions in the search space and construct a population that is recognized as a swarm. The particle swarm is made by allocating ones (1) and zeros (0) arbitrarily. For each particle, the particle is selected for a value of 1 for the principal component and the particle is rejected for the value of 0. Therefore, each particle designates a dissimilar subsection of main mechanisms. Random initialization of the swarm particle is done and formerly it advanced in the examine space or main space to scrutinize the best feature subset by informing its location and velocity. The computation of the present location of particle I and its velocity can be possible using the Equations (4)–(6).
The particle ’s velocity and location are calculated by (4) and (5)
| (4) |
Where D is the principal search space dimension
| (5) |
After every iteration velocity and location are updated as in Equation (6)
| (6) |
where is the th repetition in the procedure and id means the th search dimension. W is the weight of inertia and D1 and D2 are constants acceleration. Rd1 and Rd2 are random values that are evenly scattered in the range of 0 and 1. and signify the elements of and in the th dimension. Thus, the best set of features is selected from continuously updating with the position and velocity values of each particle until the stopping criterion is reached. The final step in the feature selection process is applying the bio-inspired particle swarm optimization for finding important independent or feature variables from the feature space. Through PSO, the following features IV2, IV3, IV5, IV6, IV8 are selected based on their contribution towards the output label. In literature, various wrapper and filter-based methods are used for feature selection. The preferred feature selection tools correlation coefficient, F-score, and PSO method identified a subset of features upon its merit. This paper attempted in designing a novel hybrid feature selector by applying the intersection operation on the derived set of independent variables obtained through the excellence of correlation tool, F-score, and PSO (Particle Swarm Optimization). The predominant independent variable from the proposed feature selector is IV2, IV3, IV5, IV6 and IV8. The efficacy of the hybrid feature selector has been experimented on in the dataset, and it has been proved the performance of the neural-based diabetes classification system is significantly improvised. The upcoming section discusses the design steps for a neural-based classifier.
3.3 Classification Model
This section deals with the design steps involved in neural network-based as well as classical machine learning-based classifiers. After obtaining the pre-dominant independent features using the steps mentioned in the aforementioned section. The next step is to fit the neural network-based model on the pre-processed samples via optimizing various hyper parameters. The reason for choosing a neural-based diabetics prediction system is since the neural network architectures are inherently capable of interpreting the variation found in the data samples. Another efficient aspect of neural network models is, their learning methodology is the same as the human brain learning process. The constituent part of neural network architecture is the input, hidden, and output layer, where each layer consists of a varying amount of processing units called neurons. The input layer accepts the independent input features and passes them to the hidden layer where all the neurons receive input and learn the pattern and pass it on to subsequent layers. The following equation explains the transformation that took place between input layers to the output class layer. The proposed neural diabetics’ prediction system is a binary classification model and all the layers are chosen to be interconnected to improvise the classification process. The M-dimensional input vector of the optimized neural network model produces an N-dimensional output vector and it can be represented as : . The output of each neuron in every layer is computed using Equation (7).
| (7) |
Where the , x, , w, are represents a non-linear function that is essential for transformation, input feature vector, bias to the error, and weights. And the weight parameter value is computed based on the samples. While training the model the error between the computed with actual can be minimized through back-propagation (8). And weight value is recalculated using Equation (9)
| (8) | ||
| (9) |
Where is the learning rate, specifies the amount of weight to be updated while training the model. To optimize the performance of the classifier, it is very difficult to forecast the number of hidden layers and the number of neurons within it. However, it is proven that more number of the hidden layer will not improvise the prediction. The amounts of hidden layer, as well as several neurons, are completely based on the number of samples as well the presented variation in the instances.
4 Results and Discussion
The proposed PSO-NNDP was implemented using Python 3.6. The reliability of the presented work is tested with the help of the PIMA diabetes dataset. The neural network classifier with varying amounts of hidden layers is created using the keras [27] library with the tensor flow as its backend. The proposed model is built upon Keras, due to its support towards creating a fully connected back propagation neural network model. The goal of the feature selection phase of the proposed framework is to identify the dominant independent variable and thereby influence the predictive machine learning model. The resultant independent variables from the presented feature selection component are fed into the proposed neural classifier. The proposed neural-based model, ReLU (Rectified Linear Unit) activation function has been used in the hidden layer because the proposed model is a binary classifier. Another reason for choosing ReLU is, it is not affected by vanishing gradient issues, which is one of the inevitable issues, while back-propagating the error terms in a neural network. Also, it facilitates the model to learn the non-linear representations in instances. Moreover, it is not, computationally expensive, and faster at convergence. The output layer of the data is activated using the SoftMax function which turns the data values into probabilities that sum up to unity. In general, this criterion function accepts, K, real numbers of the vector. Then the normalization technique maps all the values in terms of K probability distribution. Input element Z of the vector Z and use standard exponentiation on them. Then, these values are normalized by dividing them by the sum of exponentials of every data set in the vector. The Equation (10) denotes the process in terms of expression.
| (10) |
The next step in designing the PSO-NNDP is to choose the best optimizer function to compile the designed model. The proposed experiment setup preferred to use Adam optimizer. Hence, the generated hyper-parameters do not require any tuning as they are irrelevant to the diagonal rescaling of gradients. After deciding the necessary activation function, the proposed model is fit with pre-processed features with six hidden layers varying amount of neurons with fifty numbers of epochs to produce the best possible prediction.
4.1 Discussion
This section discusses the performance of the proposed PSO-NNDP framework in terms of various quantitative performance metrics used by various researchers. The metrics, accuracy, sensitivity, specificity, and F1-score, have been used to assess the efficacy of the proposed system. Also, this section demonstrates the performance of various machine learning models for the proposed feature selection module. The machine learning models are designed using Python3.6 API by changing their hyper-parameters. Table 3 shows the best possible hyper parameters used to tune the machine learning models. The obtained results for various machine learning models are summarized in Table 4, in terms of accuracy, sensitivity, specificity, and F1-score. Tables 4 and 5 summarize the results of various machine learning models as well as the proposed framework in the present as well as in the absence of the hybrid feature selector. In this context, results displayed in Table 4 are obtained by the mentioned methods by considering all the independent variables in the experimented dataset. Moreover, the preprocessing phase is also not deployed, while testing the stated machine learning models. In contradiction to the steps used to obtain results displayed in Table 4, the preprocessing and the proposed hybrid feature selector are considered for prediction and the results are furnished in Table 5.
By observing the results summarized in Table 4, in the absence of the proposed hybrid classifier, the presented diabetes framework produces, 92.2% as its accuracy, 91.3% as its specificity, 92% as its sensitivity, and 91% as its F1-score. Next to the proposed methods, the XGBoost method produces better accuracy than the other models considered for analysis. In terms of accuracy metric, the Gaussian Naïve Bayes method produces 78.57% as its accuracy. While observing the machine learning model’s efficacy in terms of specificity, the produced value was between 58% and 68%. Against the sensitivity metric, the designed model obtains the value, which falls in the range of 53% to 65%. The value obtained for F1 score values through all the ML models is falling from 59% to 67%. Thus all the conventional machine learning model scored data against the performance metrics are in the range of 50% to 80%, whereas, the proposed NNDP (neural network diabetes prediction) score above 90% in terms of all the efficacy metrics. Compared to the ML models, the models built upon the customized neural network architecture can learn patterns quickly and the same has been reflected in the experimental results.
Table 3 Hyper parameters used in machine learning models
| ML Models | Best Hyperparameters |
| KNN | leaf_size, n_neighbors=30, metric-minkowski, algorithm=auto |
| DT | class_weight=None, criterion=gini, min_samples_split=2, |
| min_impurity_split=None, min_samples_leaf=1, presort=False, splitter=best | |
| RF | criterion=gini, min_samples_split’: 2,n_estimator=50 |
| GNB | var_smoothing=0.01 |
| SVC | Kernel=rbf, cache_size=200, verbose=False |
| XG Boost | min_child_weight=5, max_delta_step=2, subsample=1.2, |
| colsample_bytree=0.7, max_depth=3 | |
| LR | Penalty=l2, solver=lbfgs |
Table 4 Performance of various Machine learning models without the proposed method
| Methods | Accuracy | Specificity | Sensitivity | F1 Score |
| KNN | 76.62 | 62.22 | 59.57 | 60.87 |
| SVC | 69.48 | 64.30 | 65.50 | 67.4 |
| LR | 77.92 | 67.57 | 53.19 | 59.52 |
| DT | 75.97 | 60.42 | 61.70 | 61.05 |
| GNB | 78.57 | 65.91 | 61.70 | 63.74 |
| RF | 74.68 | 58.00 | 61.70 | 59.79 |
| XG Boost | 80.52 | 68.89 | 65.96 | 67.39 |
| Proposed PSO NNDP | 92.2 | 91.3 | 92.0 | 91.0 |
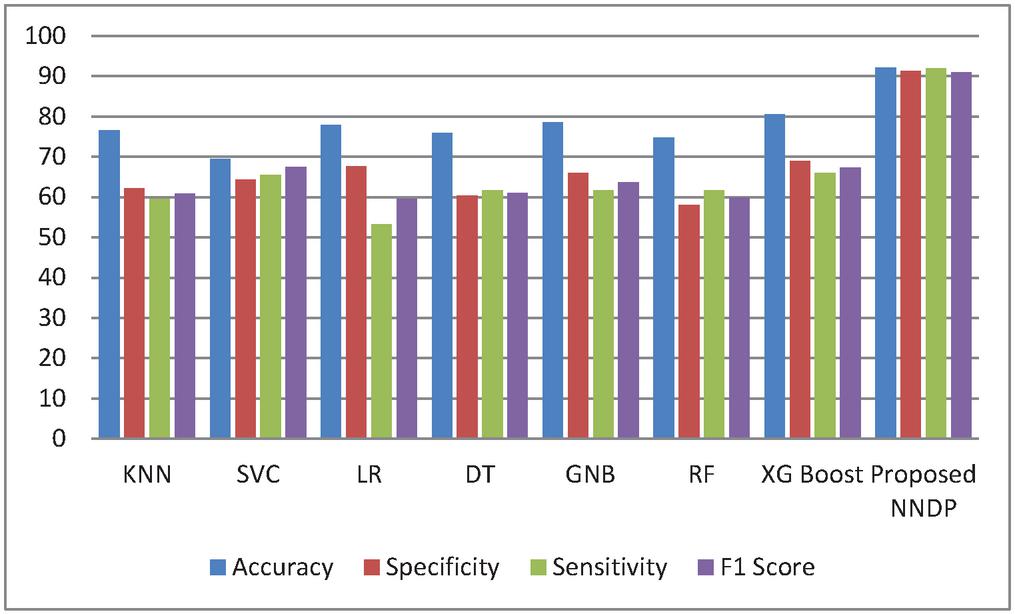
Figure 4 Performance Comparison without proposed feature selector.
Figure 4 shows the experimented results in the absence of the presented feature selector. In the next phase of experimented results, Table 5 summarizes the various machine models as well as the proposed framework output for the presented hybrid feature selector. The designed model performance in diabetes prediction is significantly improvised in terms of all metrics (accuracy, sensitivity, specificity, and F1-score). The model’s accuracy values fall from 80% to 99.5%. Due to the proposed work superior performance, it is considered as a highly competitive alternative solution for the state-of-the-art diabetes framework in trend. The proposed method obtains 99.5% as its model classification accuracy, 99.3% as its specificity, 98.5% as its sensitivity, and finally 99% as its F1-Score value. The methods KNN (K-nearest-neighbour), GNB (Gaussian naïve Base), SVC (Support Vector Classifier), LR (Logistic Regression), DT (Decision Tree), RF (Random Forest), XGBoost, methods precision in classification are also greatly enhanced upon the usage of presented hybrid feature selector. Figure 5 shows the improvement of the proposed work along with its counterpart techniques in the presence of a novel feature selector. RNN [28] is one of the complex architectures of ANN (artificial neural network). ANN considers the sequential data inputs one at a time by retaining the previous neuron information. Thus, the results of all the neurons in the previous time steps are fed as inputs to the candidate current state neurons. Due to this inherent remembering the previous patterns, RNN structure finds its usage in all domains. The application of RNN for diabetes prediction is presented in [28], and the classification accuracy is 79%. Thus, Tables 4 and 5 tabulates the performance of the diabetes prediction framework designed through ML and neural architectures in the presence as well as the absence of the novel hybrid feature selector. To benchmark the presented PSO-NNDP, the results are compared with the models built upon the complex architectures. Hence, the results of the presented model along with the results of the complex models are tabulated in Table 6.
Table 5 Performance of various Machine learning models with the proposed method
| Methods | Accuracy | Specificity | Sensitivity | F1 Score |
| KNN | 85.6 | 84.3 | 85.4 | 83.0 |
| SVC | 80.0 | 81.0 | 80 | 79.0 |
| LR | 82.0 | 79.8 | 80.3 | 78.4 |
| DT | 88 | 85.3 | 87.2 | 86.0 |
| GNB | 91.0 | 88.7 | 89.3 | 88.0 |
| RF | 94.0 | 92.2 | 93.0 | 92.0 |
| XG Boost | 85.6 | 83.4 | 82.5 | 82.4 |
| Proposed PSO NNDP | 99.5 | 99.3 | 98.5 | 99.0 |
Table 6 Performance of various deep learning methods along with the proposed method
| Deep Learning Methods | Accuracy |
| RNN [28] | 79 |
| LSTM [29] | 75 |
| LSTM-AR [29] | 84 |
| DLPD [30] | 99.4 |
| Proposed PSO NNDP | 99.5 |
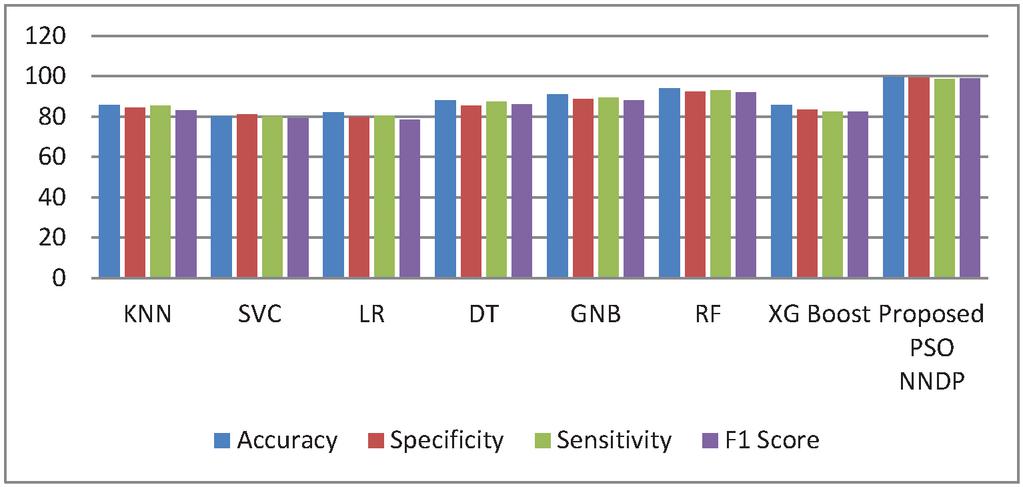
Figure 5 Performance comparison without feature selector.
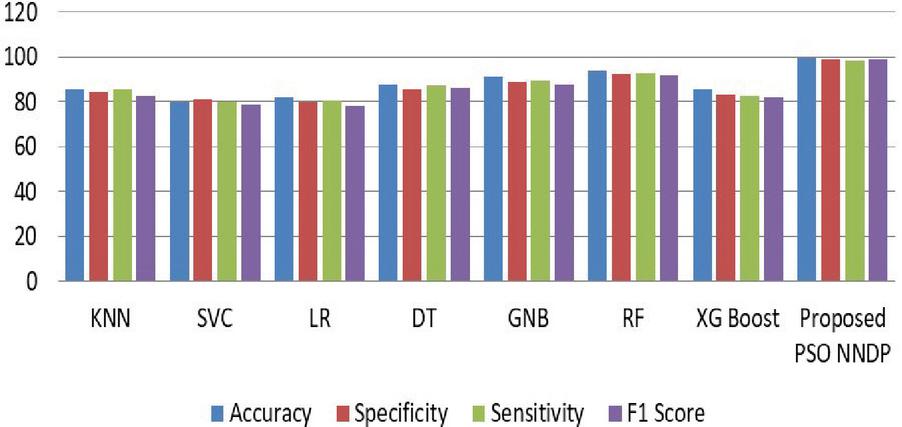
Figure 6 Performance comparisons with the proposed feature selector.
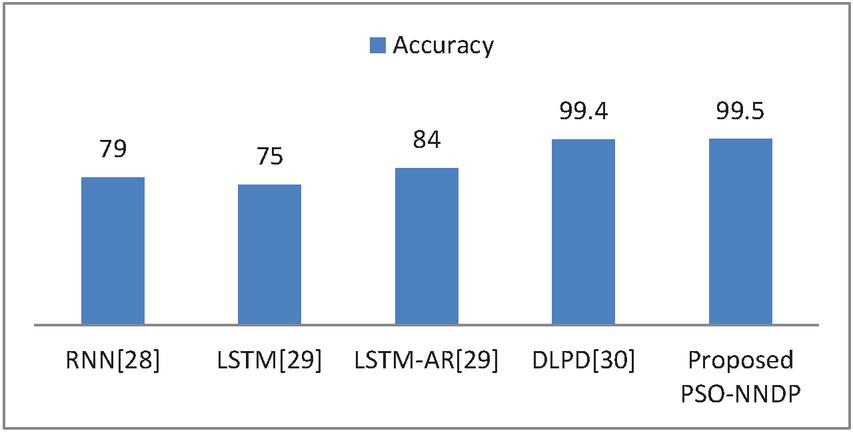
Figure 7 Efficacy comparisons with the existing complex models.
The method presented in [29] designs the diabetes prediction system using LSTM. A deep enhanced neural classifier Deep Learning for Predicting Diabetes (DLPD) [30] for diabetes prediction is presented and compared with other trend diabetes prediction frameworks. Thus, the tested output of the proposed PSO-NNDP is better in terms of benchmarking quantitative metrics compared with the state-of-the-art diabetes prediction frameworks mentioned in the table. And the efficacy comparison of the presented model with the complex models is displayed in Figure 7.
5 Conclusion
In this paper, a robust diabetes framework is implemented and the highlight of the proposed healthcare is employing the computing merits of three different methods to find the most influential feature columns from the PIMA dataset thereby improvisation of neural-based classifier has been ensured via changing several hyper parameters. The experimental result of the proposed method shows a substantial improvement upon the proposed hybrid feature selector. Another promising sector for improvising diabetes prediction is researching the other unnoticed influential factors in line with health-care-experts. The number of instances at greater number is really important to train the model to ensure the best possible results. In the future, the presented framework may be used for other chronic illnesses by improvising the feature selection.
References
[1] Cho N, Shaw J E, Karuranga S, Huang Y D, da Rocha Fernandes J D, Ohlrogge, A W and Malanda B, “IDF Diabetes Atlas: Global estimates of diabetes prevalence for 2017 and projections for 2045”, Diabetes research and clinical practice, 138, 271–281, 2018.
[2] Li G, Peng S, Wang C, Niu J and Yuan Y, “An energy-efficient data collection scheme using denoising autoencoder in wireless sensor networks”, Tsinghua Science and Technology, 24(1), 86–96, 2018.
[3] Care D, “To compare oral glucose tolerance test (OGTT) glucose, C-peptide, and insulin responses and insulin sensitivity in youth and adults with impaired glucose tolerance (IGT) or recently diagnosed type 2 diabetes”, Diabetes Care, 41, 1707, 2018.
[4] Saadatnejad S, Oveisi M, Hashemi M, “LSTM-based ECG classification for continuous monitoring on personal wearable devices”, IEEE J. Biomed. Health Inform, Vol. 24, No. 2, pp. 515–523, April 2019.
[5] Pham T, Tran T, Phung D and Venkatesh S, “Predicting healthcare trajectories from medical records: A deep learning approach”, Journal of biomedical informatics, 69, 218–229, 2017.
[6] Kaji D A, Zech J R, Kim J S, Cho S K, Dangayach N S, Costa A B and Oermann E K, “An attention based deep learning model of clinical events in the intensive care unit”, PloS one, 14(2), 0211057, 2019.
[7] Pima Indians Diabetes Database. Available online: https://gist.github.com/ktisha/c21e73a1bd1700294ef790c56c8aec1f (accessed on 27 August 2019).
[8] Predict the Onset of Diabetes Based on Diagnostic Measures. Available online: https://www.kaggle.com/uciml/pima-indians-diabetes-database (accessed on 21 June 2019).
[9] Luo M, Wang K, Cai Z, Liu A, Li Y and Cheang C F, “Using imbalanced triangle synthetic data for machine learning anomaly detection”, Comput., Mater. Continua, 58(1), 15–26, 2019.
[10] Al Helal M, Chowdhury A I, Islam A, Ahmed E, Mahmud M S and Hossain S, An optimization approach to improve classification performance in cancer and diabetes prediction. In 2019 International Conference on Electrical, Computer and Communication Engineering (ECCE) (pp. 1–5). IEEE, 2019.
[11] Kowsher M, Turaba M Y, Sajed T, “Prognosis and treatment prediction of type-2 diabetes using deep neural and machine learning classifiers” in International Conference on Computer and Information Technology (ICCIT), pp. 1–6, Dhaka, Bangladesh, December 2019.
[12] Soniya S, Singh L, “Application and need based architecture design of deep neural networks”, Int.J. Patterson Recogn. Artif. Intell, Vol. 34, No. 13, pp. 2052014, April 2020.
[13] Ramazi R, Perndorfer C, Soriano E, Laurenceau JP, Beheshti R, “Multi-modal Predictive Models of Diabetes Progression”, in Proceedings of the 10th ACM International Conference on Bioinformatics, Computational Biology and Health Informatics, pp. 253–258, New Yark, United States, September 2019.
[14] Alharbi A, Alghahtani M, “Using genetic algorithm and ELM neural networks for feature extraction and classification of type 2-diabetes melIitus”, Appl. Artif. Intelli, Vol. 33, No. 1, pp. 311–328, March 2019.
[15] Zhu L, Wu B and Cao C, “Introduction to medical data mining”, Journal of biomedical engineering, Vol. 20, No 3, pp. 559–62, September 2003.
[16] Durgesh K, Srivastava Lekha Bhambhu, “Data Classification Using Support Vector Machine”, Journal of Theoretical and Applied Information Technology, Vol. 12, No. 1, pp. 1—, February 2009.
[17] Balaji H, Iyengar, N, and R D Caytiles, “Optimal Predictive analytics of Pima Diabetics using Deep Learning”, Int. J. Database Theory Appl., 10(1), 47–62, 2017.
[18] Lekha S, and M. Suchetha, “Real-Time Non-Invasive Detection and Classification of Diabetes Using Modified Convolution Neural Network”, IEEE J. Biomed. Health Inform., 22(1), 1630–1636, 2018.
[19] Nemade D R, and R K, Gupta, “Diabetes Prediction using BPSO and Decision Tree Classifier”, In 2nd International Conference on Data, Engineering and Applications (IDEA) (pp. 1–5). IEEE, 2020.
[20] Gitmez M, Aydilek İ B, and A. Gümüşçü, “Statistical Box Graph Method and Determination of Outlier Values by Meta Heuristic Algorithms”, In 2019 1st International Informatics and Software Engineering Conference (UBMYK) (pp. 1–6). IEEE, 2019.
[21] Xie W, Chkrebtii O, and S. Kurtek, “Visualization and outlier detection for multivariate elastic curve data”, IEEE transactions on visualization and computer graphics, 26(11), 3353–3364, 2019.
[22] Song Q, Jiang H, and J. Liu, “Feature selection based on FDA and F-score for multi-class classification”, Expert Systems with Applications, 81, 22–27, 2017.
[23] Lukmanto R B, Nugroho A, and H. Akbar, “Early detection of diabetes mellitus using feature selection and fuzzy support vector machine”, Procedia Computer Science, 157, 46–54, 2019.
[24] Subbulakshmi C V, and S N. Deepa, “Medical dataset classification: a machine learning paradigm integrating particle swarm optimization with extreme learning machine classifier”, The Scientific World Journal, 2015.
[25] Brezoènik L, “Feature selection for classification using particle swarm optimization”, In IEEE EUROCON 2017-17th International Conference on Smart Technologies (pp. 966–971). IEEE, 2017.
[26] Koumi F, Aldasht M, and H. Tamimi, “Efficient feature selection using particle swarm optimization: A hybrid filters-wrapper approach”, In 2019 10th International Conference on Information and Communication Systems (ICICS) (pp. 122–127). IEEE, 2019.
[27] https://keras.io/
[28] Ashiquzzaman A, Tushar A K, Islam M R, Shon D, Im, K., Park, J. H, and J.Kim, “Reduction of overfitting in diabetes prediction using deep learning neural network”. In IT convergence and security pp. 35–43, Springer, Singapore, 2017.
[29] Massaro A, Maritati V, Giannone D, Convertini D, and A. Galiano, “LSTM DSS automatism and dataset optimization for diabetes prediction”, Applied Sciences, 9(17), 3532, 2019.
[30] Zhou H, Myrzashova R, and R. Zheng, “Diabetes prediction model based on an enhanced deep neural network”, EURASIP Journal on Wireless Communications and Networking, 2020.
Biographies

Mohammad Zubair Khan received the Master and the Ph.D. degree in computer science and information technology from the Faculty of Engineering, M. J. P. Rohilkhand University, Bareilly, India. He was the Head and an Associate Professor with the Department of Computer Science and Engineering, Invertis University, Bareilly. He has more than 15 years of teaching and research experience. He is currently an Associate Professor with the Department of Computer Science, Taibah University. He has published more than 70 journals and conference papers. His current research interests include data mining, big data, parallel and distributed computing, theory of computations, and computer networks. He has been a member of the Computer Society of India since 2004.

R. Mangayarkarasi received her Ph.D. Degree in Information Technology and Engineering from VIT University, M.E. Computer Science from Anna University. She is working as an Associate Professor in the School of Information Technology and Engineering at VIT University, Vellore Campus, India. She is having 19 years of teaching and research experience. Her research interest includes Computer Vision, Image Processing, Machine Learning, Deep Learning, and the Internet of Things.

C. Vanmathi received her Ph.D. degree in Information Technology and Engineering from VIT University, M.Tech (IT) from Sathyabama University, and B.E. Computer Science from Madras University. She is working as an Associate Professor in the School of Information Technology at VIT University, Vellore Campus, India. She is having 17 years of teaching and research experience. Her area of research includes Deep Learning, Computer Vision, Soft Computing, Cyber-Physical Systems, and the Internet of Things. She is a member of Computer Society of India and Soft Computing Research Society.

M. Angulakshmi received her Ph.D. degree in Information Technology and Engineering from VIT University, M.E (CSE) from Anna University, and B.E. Computer Science from Bharathithasan University. She is working as an Assistant Professor in the School of Information Technology at VIT University, Vellore Campus, India. She is having 14 years of teaching and research experience. Her area of research includes Image Processing, Machine Learning, and Deep Learning. She is a member of Computer society of India.
Journal of ICT Standardization, Vol. 10_2, 179–200.
doi: 10.13052/jicts2245-800X.1025
© 2022 River Publishers