Data Profiling and Machine Learning to Identify Influencers from Social Media Platforms
Bahaa Eddine Elbaghazaoui*, Mohamed Amnai and Youssef Fakhri
Laboratory of Computer Sciences, Faculty of Sciences Kenitra, IbnTofail University, Morocco
E-mail: bahaaeddine.elbaghazaoui@uit.ac.ma; mohamed.amnai@uit.ac.ma; fakhri@uit.ac.ma
*Corresponding Author
Received 25 December 2021; Accepted 08 February 2022; Publication 06 May 2022
Abstract
Because of the numerous applications domains in which social media networks can be used, the huge volume of data and information uploaded by them is gaining significant interest. Publishing allows consumers to express their thoughts on products and services. Some feedbacks could also influence other users on those things. Therefore, extracting and identifying influencers from social media networks, also profiling their product perceptions and preferences, is critical for marketers to use efficient viral marketing and recommendation strategies. Our major goal in this research is to find the best machine learning model for characterizing influencers on social media networks. However, to achieve this objective, our strategy revolves around applying the PageRank algorithm to profile influential nodes throughout the social media network graph. The results of our experiment showed that the correlation is always different when adding a new parameter to machine learning models, also to determine the suitable model for our needs. In any event, the experiment outcomes are critical and significant to profiling influencers from social media platforms.
Keywords: Data profiling, machine learning, user profiling, influencer, information diffusion, PageRank.
1 Introduction
Many websites and especially social media platforms are gaining traction because publishing posts allows users to communicate their thoughts, feelings, and preferences on a variety of topics and items in a concise manner [1]. The vast amounts availability of data shared by users on social media has piqued the interest of research organizations and commercial firms. In fact, staying on top of the causes behind a theme’s or product’s popularity, as well as the possibility of people’s opinions on user material, can aid in the creation of more successful promotional efforts. In reality, we can grasp the motivations behind the popularity of topics or products by using people’s opinions, which may also be a useful tool for designing more effective promotional campaigns.
Actually, various brands are now using social media content for content marketing and dissemination. It benefits all aspects of business and management, including social commerce [2], e-government [3], political marketing [4], and digital marketing [5]. Furthermore, the vast amount of data is altering the digital marketing landscape and providing significant hurdles. To convert brand marketing data into business insights, analytical modelling and management strategies are required.
Customers are recommended products by websites using social marketing strategies. In this situation, marketers must better identify individuals who have the power to influence the choices of other users before allowing product recommendation technologies to be used. Users’ engagement in the posted content can be used to determine how influential they are on social media [7]. As a result, profiling Influencers and their product perceptions on online social networks is an important study endeavor [6].
Our goal in this article is to use machine learning models to profile and identify influencers from online social media networks. However, our system first collects the necessary data and cleans up any ambiguities or errors in our database, after which we used the PageRank algorithm to profile influencers. Finally, we used machine learning models to train our system to identify influencers rapidly and in real-time, based on the data we had retrieved.
Many strategies for automatically identifying influencers in social networks have been proposed [18, 19]. However, the effectiveness of these strategies is highly dependent on the parameters that each user collects, such as the number of followers, followers, likes, and so on. We centered our strategy on identifying influencers based on the content of their posts. Then we’ll train our system to make our approach faster. Our system will aid in the execution of numerous applications, including detect “trending topics,” as well as new hot and popular issues reported on social media, detect new and interesting stocks based on a collection of expert papers, organize scientific texts according to a theme, also improve a product and identify the various features that can be criticized.
The following is the structure of this paper, which summarizes all preceding thoughts. We begin by outlining the relevant work and the main issues of our approach in the first section. The core notion of our solution is presented in the second half. We introduce our implementation in the third section. Finally, we came to a broad conclusion and made recommendations for future work.
2 Related Works
This section summarizes the most relevant previous research on identifying social network influencers. Kleinberg [20] and Cook [21] have thoroughly researched the basic definitions, algorithms, and methodologies of graph theory and network analysis. Many recent research [22, 23] have focused on the utilization of platform-specific features. These functions include the number of users who have followed, the number of users who have been followed, the verification status, the number of users who have been added to user lists, and so on.
On Twitter, influencing people is generally assessed by the number of retweets user tweets [23, 24]. The Twitter API does not reveal who reposts who. As a result, we are unable to determine who is disseminating information on Twitter. As a result, it appears that the best way is to leverage platform-specific features to identify the people who have the most impact on social media platforms.
Zengin Alp and Gunduz Oguducu [23] proposed the “Personalized PageRank” technique, which incorporates information from the Twitter network as well as user actions. The proposed method tries to identify specialists on a certain issue who are thought to be influencers on that area. Cataldi and Aufaure [25] proposed a method for analyzing the many paths that information takes on a network and estimating the influence between users by evaluating user relationships. They simulate the Twitter network on selected subjects using directed graphs, where directed edges represent forwarding activities between nodes (users). [26] Kwak et al. Different impact measures based on parameters are compared (such as the number of reposts, the number of followers). They also proposed a “retweet tree,” but did not include it in the impact calculation. Cha et al. [27] present a detailed comparison of three kinds of influence: degree, retweet, and mention.
Our strategy would be to use the PageRank algorithm to profile influencers from Twitter data. Due to machine learning algorithms, we will be able to forecast influencers and tweet spreading through this analysis.
3 Problem Formulation
To completely understand user behavior, many research have focused on gathering metadata from social media networks. Understanding user behavior may assist in improving the quality of various products and services [8], and then presenting their products in a way that meets the needs of the users. Using influencers is a simple technique to offer a product to a large group of people or to share information. In reality, one of the fastest expanding fields of marketing and a vital component of marketing research is influential marketing. It can be tough to identify the correct influencer at times. Many techniques to solving the challenge of extracting influencers from social networks have been developed recently [18]. The advised recommendations are based on influencer profile based on parameters (number of followers, following, likes, etc.) rather than the content of their writings. Therefore, our goal is to determine the best model for our problem based on the content of the user’s posts. In this study, we compare multiple machine learning models while also taking the content of the publication into consideration.
Influential marketing is an important field of marketing research [9] and one of the fastest growing sectors of marketing. Every day, significant people on social media express their thoughts on products, services, and businesses. These powerful persons are thought to be opinion leaders because they communicate with their large social network of followers [10]. Some of these influencers’ publications gained a lot of traction. We’ve noted that this is a trend or tendency, and that these trends allow us to shape public opinion and define a variety of societal standards. Predicting the likelihood of such an occurrence, on the other hand, may boost the impact of product advertising, shape positive or negative public opinion, or identify and prevent such manipulation [11].
Many algorithms have recently arisen and been developed for automating the process of finding and assessing social media influencers. However, the solution to the influence maximization (IM) problem has begun to evolve, and it is likewise based on the greedy algorithm. The greedy algorithm has mostly solved the challenge of identifying top-k influencers in social networks [13]. Dijkstra’s shortest path, Prim’s MST, and other issues are also acceptable for the greedy method, although it will fail in some NP Hard situations.
Our workflow approach is presented in this research [29] as indicated in Figure 1. The first stage (1) entails gathering the necessary social network data from a large number of people. We identified the profile that has a significant impact and influence on others in the second phase (2). Indeed, we described the problem in mathematical and graphical form in this section to make the solution easier (user as node and its influence as arc). Finally, identify the nodes that have an effect on their neighbors. In the third part (3), we applied some of the most well-known and powerful machine learning models to our data, then compared them to identify the best model for our needs.
Extract and profile data is the first step [28]. In reality, in our technique, the data collection procedure entails gathering and analyzing correct insights data from a social network. The promise of social media is that “natural” user activity will be recorded in real time. Validity and representativeness are frequently addressed issues [12].
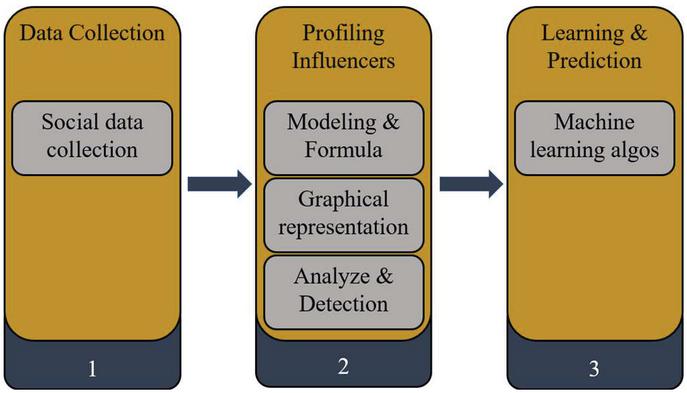
Figure 1 Workflow process approach.
By examining the data, we can identify influential users in the second part of our technique. Remember that in the influence maximization problem, we’re aiming to find the seed set of k individuals in the social network that will allow the most information on a certain topic or problem to spread to the remainder of the network. This problem is NP-hard, although it can be solved using a greedy approximation approach with a 63 percent approximation ratio [14]. This greedy method iteratively adds vertices to the seed set, attempting to maximize influence spread or have the biggest center value in each iteration.
The centrality of a vertex in a graph indicates its prominence in the network. Degree centrality, feature vector centrality, centrality between centers, and PageRank centrality are some of the most prevalent centralities. In this article, we apply a PageRank centrality-based strategy to find the seed set of influencers. The importance of the vertices connecting to the vertex is demonstrated by the PageRank centrality [15].
The first patent for PageRank was submitted on September 1, 1998, and it was the first algorithm Google utilized to determine the significance of web pages and rank them. In a nutshell, Google is built on Sergey Brin’s [16] notion of ranking content on the Internet based on the page’s link popularity. The higher the page’s ranking, the more links it has.
Influential nodes are those that have the greatest number of other users/nodes following them. Furthermore, if a node’s followers are prominent in their own right, the followed node becomes even more influential. For instance, if X has 20 followers and Y has 10, X is considered to be more important than Y. If Z has ten followers as well, Y and Z are both equally influential. However, if Z’s followers are more influential than X’s followers, Z becomes more powerful than X. (simply because it is followed by more influential people).
Calculate the influence of each node can be applied due to the PageRank algorithm. The program tries to find each node’s score many times. When the score does not change between rounds, the algorithm should stop working (converge). PageRank is calculated using the next mathematical formula.
| (1) |
• : is vertex x.
• damping: is a damping factor, generally 0.85.
• Total: total numbers of nodes in the graph.
• : is one of the n neighboring vertices of .
• Count : is the count of neighbors of Vertex .
• n: number of nodes in the graph.
• PageRank: is the PageRank value by vertex.
Each node in the graph starts with a score of 1/n, where n is the number of nodes. A node with no output vertex will have its weight distributed evenly among all nodes in the graph (just like the virtual drawing edge from this node to all network nodes). The node score is some weighted average of the scores of its immediate neighbors, as shown in Figure 2.
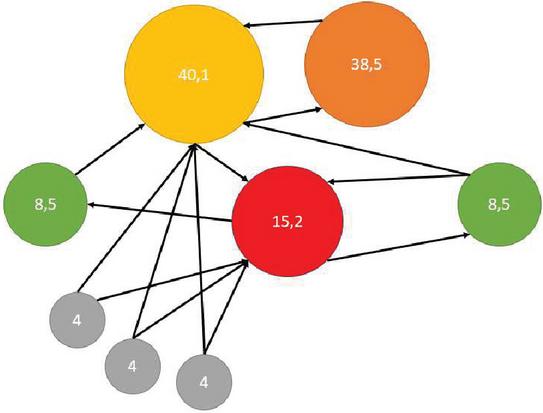
Figure 2 PageRank algorithm.
To put it another way, the PageRank algorithm works like following Algorithm 1:
Algorithm 1 PageRank algorithm
1: Graph, damping = 0.85, max_iteration
2: PageRank (list of PageRank numbers)
3: A = Array
4: Nodes = Graph.nodes[]
5: for node in Nodes do
6: A[node] = 1/Nodes
7: end for
8: for node in Nodes do
9: PageRank [node] = 1 damping
10: for neighbor connect to node do
11: O = number of outgoing edges of neighbor
12: PageRank [node] = PageRank[node] damping * A[neighbor] / O
13: for neighbor in N do
14: A[neighbor] = PageRank[neighbor]
15: end for
16: end for
17: end for
We used machine learning techniques to identify the most influential nodes in the network, investigate multiple machine learning models to choose the best appropriate model for the network, and understand how to apply information cascade technology in the last step of our process [17]. However, we have taught our machine learning algorithms to speed up influencer profiling from social media networks throughout this phase. We have used this method in two different ways. The first was to create a matrix containing solely the users’ parameters, which we then separated into two halves, one for training and the other for testing. After that, we arrived at the best learning model for our situation. In the second, we followed the same approach as before, but we also considered the substance of users’ tweets.
4 Implementation & Experiment
Following the workflow that we gave in our contribution as a guide. The initial stage in our scenario is to gather data from a set of connected users. Our data processing and extraction efforts are focused on Twitter for the following three reasons:
• Twitter is a public social media platform. When compared to other social media platforms, Twitter’s data access is quite simple to handle.
• The textual components of Twitter’s social network image to text range receive more attention. In terms of vision, eyesight is important, but it pales in comparison to other alternatives.
• The retweet system is unique to Twitter, and it allows you to follow a posting’s progress.
Our program need access to the Twitter application programming interface to get started. We utilized the Anaconda ecosystem to run Tweepy, a Python module that allows us to collect data from Twitter. Using Tweepy allowed us to extract data by using the Twitter API.
As shown in Figure 3, the Twitter API produces an object that represents a tweet in the form of “JSON,” which will be used as a dictionary and includes a high number of attributes (keys). Indeed, we can look for the keys in the dictionary of the tweet object using a query. We can see that some of these keys are also dictionaries; for example, the “user” property has a lot of keys.
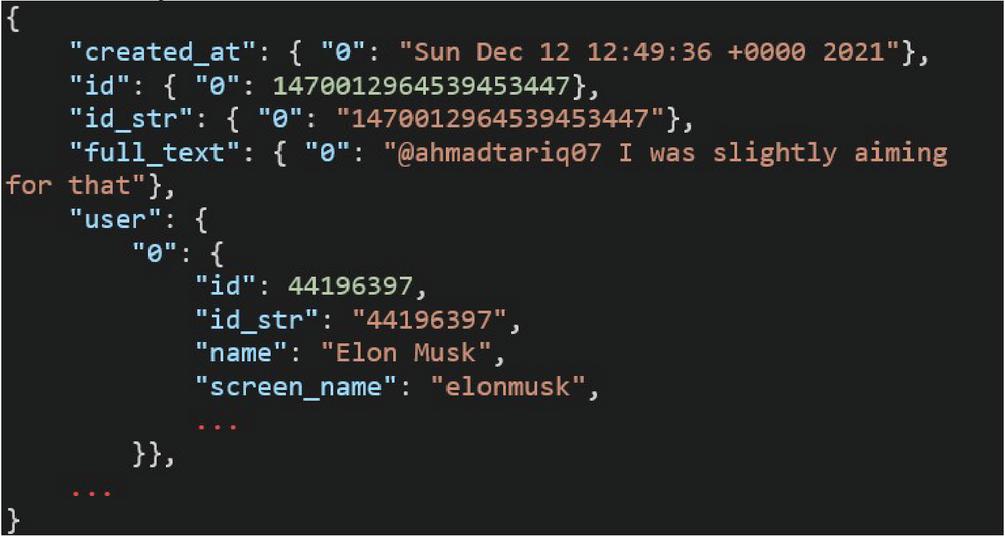
Figure 3 Tweet object.
Following the data extraction from Twitter. Now we must find these influencers among hundreds of thousands of users by transitioning from a chaotic to an ordered matrix that can be manipulated and navigated using mathematical formulas, and then applying a computer tool to this set of data, which will go through several stages before arriving at a better form, the graphical form.
We get a matrix with a coefficient of 0 or 1 based on the user data (0: not follow & 1: follow). We also get an adjacency list, or a list of each vertex’s neighbors. Because it is a directed graph in our example, the head is a user X, and the queue Y is the X’s follower. In another manner, Y is a component of the X’s adjacency list.
A social graph was created as a result of these linkages between persons. We created a graph G with a collection of nodes and a list of arcs between these nodes using Python’s “NetworkX” package, which served as a solid foundation for our social graph. As a result, we can observe in Figure 4 that there are 178819 nodes and 218091 arcs.
So far, we’ve pulled all of the users and their relationships from our database. To correctly categorize users based on their impact on others. The PageRank algorithm must be used. However, after running PageRank on our social network, we use a PageRank centrality indicator to identify each node.
After that, users are sorted by their pagerank indicator. We end up with a preliminary outcome for our goal of detecting influencers, which we refer to as potential influencers. Indeed, because our searches will now only be indexed by the account id or its username (screen name), we filter these nodes and eliminate the numerical indicators. This group of possible influencers does not exist in real life. as a list of all users, sorted by their PageRank score.
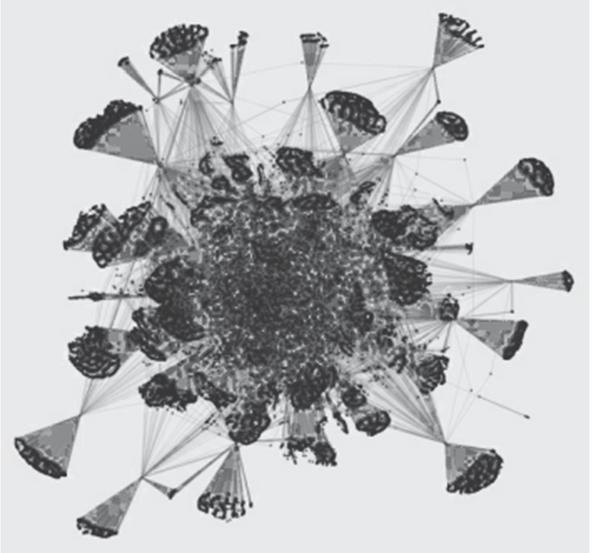
Figure 4 Social graph extracted.
Users who do not have at least 13 retweets are considered inactive (the number we used to determine a tweet in trend). In our example, we deleted any tweets that were not retweeted 20 times, had a small number of links, or were from a private account from the list of influencers. However, in order to obtain more definite results, a numerical indicator “r” has been incorporated, which is defined as follows in following equation:
| (2) |
• : the number of retweets of a tweet.
• T: the number of followers of this user.
• Score: PageRank value
Following these steps, we arrive at a group of 78 users who we can rate as influencers, these users represent a small percentage of the total number of users, based on the ratings, we sort these indicators to rank our influencers from most to least influential.
Table 1 Profiling influencers due to PageRank
| Rank | Username | PageRank Score |
| 1 | om | 1.26e5 |
| 2 | Outlook | 1.84e5 |
| 3 | SchadenJake | 2.14e5 |
| 4 | HuffPostTech | 2.31e5 |
| … | ||
| 76 | kareneladd | 0.05450 |
| 77 | SketchyBongo | 0.09625 |
| 78 | dlberes | 0.26158 |
Following our research, we discovered that all 78 accounts have been verified by the Twitter committee and are ranked by the number of followers they have.
We must now go to the machine learning stage. In this example, we came to a conclusion by putting 8 fields in boxes to represent them numerically within a matrix of integers. Indeed, the first seven boxes will be used in our model learning methods, with the last box being the outcome of determining the data’s association. Then we notice that this dataset has been partitioned 60 percent for training items and 40 percent for test elements. The following are the fields:
• Id: a unique identifier for each user.
• Number of Followers: this tweet’s creator’s total number of followers.
• Friends count: The number of other users who follow the creator of this tweet.
• Verified: If the account is validated, we put a 1; otherwise, we put a 0.
• Tweet length: the whole length of the tweet excluding the links.
• Entities: If the tweet has a link, set it to 1; otherwise, set it to 0.
• Likes: the total number of “likes” a tweet has received.
• Retweet count: depending on the spread, the trend arbiter is set to 0 or 1.
Our initial step in the analysis and procedure is to look through user data, which includes simply the creator’s identity and the form of the tweet, regardless of the substance of the tweet. The method we’ve seen is to feed multiple models, compare them, and check if the results are consistent.
So, we are based on five machine learning models which are as follows:
• Logistic regression
• Decision tree
• Neural Networks
• Random Forest
• Linear regression
To eliminate bias in our results, we handled all of these algorithms the same way and used the same data set.
There are two types of models in this category. Linear Regression and Logistic Regression are two types of regression models. Their precision would be determined by variance, while the other three (Decision Tree, Random Forest, and Neural Networks) are determined by a predictive nature with discrete results. A comparison between the obtained result and the real existent result would be used to determine precision.
The following Table 2 summarizes the outcomes of the models that were tested (without tweet content).
Table 2 Machine learning models are compared without tweet content
| Model | Precision (%) | Variance |
| Decision tree | 92.66 | 0.29 |
| Random Forest | 93.15 | 0.23 |
| Neural Networks | 75.27 | 0.23 |
| Linear regression | — | 0.11 |
| Logistic regression | 92.23 | 0.25 |
Following the implementation of these models, we evaluated their performance in order to determine which one was the best fit for our dataset, which we did using error metrics (MAE: Mean Absolute Error, RMSE: Root Mean Squared Error & MSE: Mean Squared Error). We obtained the findings shown in Table 3 using these measurements.
Table 3 Performance metrics without tweet content
| Model | MAE | RMSE | MSE |
| Decision tree | 0.0815 | 0.0815 | 0.2855 |
| Random Forest | 0.0776 | 0.0776 | 0.2786 |
| Neural Networks | 0.1689 | 0.1689 | 0.4110 |
| Linear regression | 0.2277 | 0.1197 | 0.3461 |
| Logistic regression | 0.1032 | 0.1032 | 0.3213 |
Note that all models, with the exception of linear regression, have a precision of between 92 and 94 percent, indicating a strong link between the user and the tendency of a tweet without looking at its content. The variances are all acceptable and relatively close to one another, indicating limited dispersion and, as a result, a prediction with little noise. In order to do this work, we believe that the random forest is the best option for our database.
The substance of each tweet must be considered in the second step of our treatment. However, we begin by deleting all noise from the text (links, emoticons, special characters, and so on), and we limit the allowed characters to the 26 letters of the alphabet by removing numerical forms and links (Http/Https).
After that, we “Tokenized” each text by converting it into Tokens. For example, the statement “the earth is round” will be partitioned one by one in regard to the words, resulting in the form (“the”, “earth”, “is”, “round”), with each member of this list being a Token of this sentence.
This is insufficient because the terms “the” and “is” do not reflect the subject of our statement, but we chose a basic way to add free complexity to our model. Indeed, all the empty words “STOPWORDS” must be removed, resulting in the following sentence: (“earth”, “round”).
As a result, each tweet content is converted into a list of tokens. We may use this method to classify and extract the theme or cluster of each tweet using this method. Indeed, using the Latent Dirichlet Allocation (LDA) method, we can retrieve the most often used phrases in a topic that a human being must constantly identify.
We added the topic and trend to our database by using the id of each tweet. In addition, we use the new data to train the same previous models, yielding the results shown in the Table 4 below:
Table 4 Comparison between machine learning models with tweet content
| Model | Precision (%) |
| Decision tree | 76.25 |
| Random Forest | 84.52 |
| Neural Networks | 84.34 |
| Linear regression | 72.56 |
| Logistic regression | 69.98 |
We notice that:
• The neural network is more efficient at this task than the previous one, which surprises us.
• We see that each subject has at least one invading term, indicating that topic extraction is not very accurate. Since the current word situation, we found the word “COVID” in majority of the issues.
• The percentage of tweets in our database that are trending is 20%.
By emphasizing these aspects, we can determine that the content influences the trend of a tweet, albeit in a less significant way than the user’s profile.
The limits imposed by the Twitter API limit us to have better results notably for content analysis, and the machine limitation is another issue. The forecast that a tweet is trending and a spot where the volume of data arrives first. We needed more than 120 GB of RAM just to save the binary matrix.
5 Conclusion
The basic goal of this project is to combine four essential big data jobs. Data collection and storage, analysis and graphic depiction, learning and prediction, and finally textual data manipulation are all covered. However, we analysed influencers from a social media network (Twitter) during this project, and then used machine learning to compare different models to find the optimal model for our objectives. Finally, with a precision of 93.15 percent, we believe the random forest is the best choice for our database, regardless of the content of the tweets. However, when we look at the content of each tweet, we can see that the top models are the random forest and neural network, both of which have an accuracy of 84 percent.
We intend to add more data to our models in future projects (like images, voice messages, etc). Also, categorize users into groups; this will allow us to provide more flexible recommendations for each user.
References
[1] A. Ahmad. “Social Network Sites and Its Popularity”. International Journal of Research and Reviews in Computer Science; Kohat Vol. 2, N. 2, (Apr 2011): 522–526.
[2] Chen, A., Lu, Y., and Gupta, S. “Enhancing the Decision Quality through Learning from the Social Commerce Components”. Journal of Global Information Management (JGIM), 25(1), 66–91. 2017.
[3] Vakeel, K. A. and Panigrahi, P. K. “Social Media Usage in E-Government: Mediating Role of Government Participation”. Journal of Global Information Management, 26(1), 1–19. 2018.
[4] Grover, P., Kar, A. K., Dwivedi, Y. K., and Janssen, M. “Polarization and acculturation in US Election 2016 outcomesCan twitter analytics predict changes in voting preferences”. Technological Forecasting and Social Change. 2018.
[5] Parsons, A. L., and Lepkowska-White, E. “Social Media Marketing Management: A Conceptual Framework”. Journal of Internet Commerce, 1–15. 2018.
[6] E Oro, C Pizzuti, M Ruffolo. “A Methodology for Identifying Influencers and their Products Perception on Twitter”. National Research Council of Italy (CNR), Institute for High Performance Computing and Networking (ICAR), Via Pietro Bucci, 4–11C, 87036 Rende (CS), Italy. 2018.
[7] D. M. Romero, W. Galuba, S. Asur, and B. A. Huberman, “Influence and passivity in social media”. Machine learning and knowledge discovery in databases. Springer, 2011, p. 1833.
[8] M. Giannakis, R. Dubey, S. Yan, K. Spanaki and T. Papadopoulos, “Social media and sensemaking patterns in new product development: demystifying the customer sentiment”. Annals of Operations Research, https://doi.org/10.1007/s10479-020-03775-6, (2020).
[9] Boerman, S. “The effects of the standardized Instagram disclosure for micro- and meso-influencers”. Computers in Human Behavior, 103, 199207. 2020.
[10] De Veirman, M., Cauberghe, V., and Hudders, L. “Marketing through Instagram influencers: The impact of number of followers and product divergence on brand attitude”. International Journal of Advertising, 36(5), 798828. 2017.
[11] A Goswami, A Kumar. “A survey of event detection techniques in online social networks”. Social Network Analysis and Mining, Springer 2016.
[12] Diaz, F., Gamon, M., Hofman, J. M., Kiciman, E., and Rothschild, D. “Online and social media data as an imperfect continuous panel survey”. PLoS One, 11(1), http://dx.doi.org/10.1371/journal.pone.0145406. 2016.
[13] B Manaskasemsak, N Dejkajonwuth, A Rungsawang. “Community Centrality-Based Greedy Approach for Identifying Top-K Influencers in Social Networks”. ICCASA, 2015 – Springer.
[14] D. Kempe, J. M. Kleinberg, and E. Tardos, “Maximizing the spread of influence through a social network”. Theory of Computing, vol. 11, p. 105147, 2015.
[15] R. Zafarani, M. A. Abbasi, and H. Liu. “Social media mining: an introduction”. Cambridge University Press, 2014.
[16] L Page, S Brin, R Motwani, and T Winograd. “The PageRank citation ranking: Bringing order to the web”. Technical Report. Stanford InfoLab. 1999.
[17] R Makhija, S Ali, RJ Krishna. “Detecting Influencers in Social Networks Through Machine Learning Techniques”. International Conference on Advanced Machine Learning Technologies and Applications. Springer, Singapore. 2020.
[18] P Harrigan, TM Daly, K Coussement, JA Lee, G. N. Soutar, and U. Ever. “Identifying influencers on social media”. International Journal of Information Management. ELSEVIER. 2021.
[19] T Huynh, H Nguyen, I Zelinka, D Dinh, XH Pham. “Detecting the Influencer on Social Networks Using Passion Point and Measures of Information Propagation”. Sustainability, 2020.
[20] D. Easley and J. Kleinberg. “Networks, Crowds, and Markets: Reasoning About a Highly Connected World”. Cambridge University Press, 2010.
[21] D. J. Cook and L. B. Holder. “Mining Graph Data”. John Wiley & Sons, 2006.
[22] J. V. Cossu, V. Labatut, and N. Dugue. “A review of features for the discrimination of twitter users: application to the prediction of offline influence”. Social Network Analysis and Mining, 2016 – Springer.
[23] Z. Zengin Alp and S. Gunduz Oguducu. “Identifying topical influencers on twitter based on user behavior and network topology”. Knowledge-Based Systems, 2018 – Elsevier.
[24] A. Pal and S. Counts. “Identifying topical authorities in microblogs”. Proc. fourth ACM Int. Conf. Web search data Min. 2011.
[25] M. Cataldi and M. A. Aufaure. “The 10 million follower fallacy: audience size does not prove domain-influence on Twitter”. Knowledge and Information Systems. 2015 – Springer.
[26] H. Kwak, C. Lee, H. Park, and S. Moon. “What is Twitter, a social network or a news media?”. Proceedings of the 19th International Conference on World Wide Web. 2010.
[27] M. Cha, H. Haddai, F. Benevenuto, and K. P. Gummadi. “Measuring User Influence in Twitter: The Million Follower Fallacy”. in International AAAI Conference on Weblogs and Social Media. 2010.
[28] Bahaa Eddine Elbaghazaoui, Amnai Mohamed, and Abdellatif Semmouri. “Data Profiling over Big Data Area: A Survey of Big Data Profiling: State-of-the-Art, Use Cases and Challenges”. In book: Intelligent Systems in Big Data, Semantic Web and Machine Learning. Springer. 2021.
[29] Bahaa Eddine Elbaghazaoui, Amnai Mohamed & Youssef Fakhri. “Optimized influencers profiling from social media based on Machine Learning”. Proceedings of ICI2C’21, Book: Advances in Information, Communication and Cybersecurity. Series: Lecture Notes in Networks and Systems 2367–3370. Springer. 2022.
Biographies

Bahaa Eddine Elbaghazaoui started their course with a scientific baccalaureate option mathematical science. In 2013, after directly integrating the national school of applied sciences in Khouribga, he passed the preparatory classes that integrate into the school, then he hooked the computer engineering sector and obtained a diploma as a software engineer in 2019. Bahaa Eddine is currently a third-year doctoral student in 2022, he doing his research in the Laboratory of Computer Science in Kenitra, Morocco.

Mohamed Amnai received his bachelor’s degree in 2000, in IEEA (Computers, Electronics, Electrical and Automation) from Molay Ismail’s University, the Errachidia city. Then, the author obtained his master’s degree in 2007, from Ibn Tofail University, the Kenitra city. In 2011, he received his Ph.D. in Telecommunication and computer science, from Ibn Tofail University in Kenitra city, Morocco. Since March 2014, he has been an Assistant at the National School of Applied Sciences Khouribga, Settat University, Morocco. He joined the Faculty of Sciences of Kénitra, Department of Computer Science and Mathematics, Ibn Tofail University, Morocco, as an Associate Professor in 2018. The author is also an associate member of the Research Laboratory in Computer Science and Telecommunications (LaRIT), Team Networks and Telecommunications Faculty of Science, Kenitra, Morocco. He is also an associate member of laboratory IPOSI National School of Applied Sciences, Sultan Moulay Slimane University, Khouribga, Morocco.

Youssef Fakhri received his Bachelor’s Degree (B.S) in Electronic Physics in 2001 and his Master’s Degree (DESA) in Computer and Telecommunication from the Faculty of Sciences, University Mohammed V, Rabat, Morocco, in 2003, where he developed his Master’s Project at the ICI Company, Morocco. He received a Ph.D. in 2007 from the University Mohammed V – Agdal, Rabat, Morocco, in collaboration with the Polytechnic University of Catalonia (UPC), Spain. He joined the Faculty of Sciences of Kénitra, Department of Computer Science and Mathematics, Ibn Tofail University, Morocco, as an Associate Professor on Mars in 2009. He is the Laboratory head at LaRIT, Associate Researcher at the Laboratory for Research in Computing and Telecommunications (LaRIT) in the Faculty of Sciences of Rabat, and Member of Pole of Competences STIC Morocco.
Journal of ICT Standardization, Vol. 10_2, 201–218.
doi: 10.13052/jicts2245-800X.1026
© 2022 River Publishers