Basic Activity Recognition from Wearable Sensors Using a Lightweight Deep Neural Network
Zakaria Benhaili*, Youness Abouqora, Youssef Balouki and Lahcen Moumoun
Hassan First University of Settat, Faculty of Sciences and Techniques, Mathematics, Computer Science and Engineering Sciences Laboratory (MISI), 26000 Settat, Morocco
E-mail: z.benhaili@uhp.ac.ma; y.abouqora@uhp.ac.ma; balouki.youssef@gmail.com; lahcen.moumoun@uhp.ac.ma
*Corresponding Author
Received 29 December 2021; Accepted 28 January 2022; Publication 06 May 2022
Abstract
The field of human activity recognition has undergone a great development, making its presence felt in various sectors such as healthcare and supervision. The identification of fundamental behaviours that occur regularly in our everyday lives can be extremely useful in the development of systems that aid the elderly, as well as opening the door to the detection of more complicated activities in a Smart home environment. Recently, the use of deep learning techniques allowed the extraction of features from sensor’s readings automatically, in a hierarchical way through non-linear transformations. In this study, we propose a deep learning model that can work with raw data without any pre-processing. Several human activities can be recognized by our stacked LSTM network. We demonstrate that our outcomes are comparable to or better than those obtained by traditional feature engineering approaches. Furthermore, our model is lightweight and can be applied on edge devices. Based on our expertise with two datasets, we obtained an accuracy of 97.15% on the UCI HAR dataset and 99% on WISDM dataset.
Keywords: Human activity recognition, LSTM, deep learning, sensors.
1 Introduction
Human activity recognition is grounded on the gathering of data from different sensing devices. We distinguish between two types: vision based HAR which requires cameras, and sensor based HAR which is based on sensors like accelerometers, gyroscopes, GPS, and others. These sensors are embedded in smartphones and other smart objects.
The efforts made in the last years in the electronics industry have allowed to reduce the size of sensors and to produce others with smaller sizes. This has motivated the development of several context aware applications in various fields such as healthcare [1], supervision [2], security [3], and other daily life applications especially the domain of internet of things [4].
Vision based HAR suffers from problems related to privacy, restrictions related to mobility and power consumption, and difficulties to obtain good images in some climatic conditions. These complications directly impact the accuracy of recognition and push researchers to adopt sensor based HAR which is more accurate, flexible, and simple.
Sensors take advantage of being ubiquitous. They can now be embedded into wearable devices like phones, watches, and bracelets, as well as non-wearable items like automobiles, doors, and furniture, thanks to the growth of smart gadgets and the Internet of Things. Sensors are broadly present in our environment, logging people’s motions in a non-intrusive and continual manner.
Today, everybody has a smart device that contains at least one sensor, these devices are an excellent tool for collecting data, and monitoring human activities, and currently there is a shift especially towards smartphones to realize this recognition.
For a good recognition, traditional Machine Learning algorithms necessitate domain knowledge to pre-process data and to select features. Recent achievements of deep learning in computer vision, speech recognition, and natural language processing attracted the researchers to investigate its effectiveness in the recognition of human activities. In fact, Deep learning can extract features from sensor’s raw data automatically, and thus substituting its manual selection and engineering. This capacity of learning permits to save time and to design more general models.
The key contributions of this paper:
We propose a deep neural network architecture capable of extracting features from sensor’s data directly. Our method can recognize a wide range of basic activities that occur frequently in our daily lives. The optimal parameters in the model were finally selected after analysing its impact on performance. We propose also other architectures to compare our model, namely LSTM-inception, which we adapted for times series, and last we investigated the impact of Softmax, SVM and CRF classification’s when it is placed in the last layer. We put our approach to the test on two commonly used datasets, our model clearly improves prior findings, as evidenced by the results.
We constructed our article as follows: The second section examines related works in the field of human activity recognition. In part four, we provide our HAR model. The experimental setup is presented in section five. The results are presented and examined in section six. Finally, and last, we give our conclusion.
2 Related Works
Deep learning models have a greater learning ability, according to current reviewed research in HAR. Convolutional neural networks have been employed as a feature extractor, either alone or in combination with recurrent neural networks and its variants.
Oluwalade et al. [5], have investigated the difference in data generated by two types of devices that embed the same type of sensors (a watch and a phone). They used four models: Long short-term memory (LSTM), Bidirectional Long short-term memory (LSTM), Convolutional Neural Network (CNN), and Convolutional LSTM (ConvLSTM) to classify fifteen hand and non-hand-oriented activities. They also used GRU to forecast the last 30 seconds of data generated from the watch accelerometer. They obtained an average classification accuracy of more than 91%. In [6] The authors used the signals captured by a gyroscope and an accelerometer, which were processed, then they extracted more than 561 features in the time and frequency domain, and they used Kernel Principal component analysis to reduce the number of dimensions, they proposed deep belief network to recognize 12 activities. In result they had a better score compared to SVM and ANN approaches.
In [7] Agarwal et al. proposed a LSTM-CNN Architecture for Human Activity Recognition learning model for HAR. The model requires little computational power, and it was developed by combining a shallow RNN and LSTM algorithm, it can achieve an accuracy of 95.78% on the WISDM dataset. In [8] the authors proposed a training methodology based on several stages, by performing several transformations on the time series, to facilitate the exploration of the feature space. After this comes a deep CNN network that performs an extraction of the features of each space. The result is combined to obtain a better performance on three databases UCI HAR, USC HAR and SKODA. In [9] The authors proposed a CNN-LSTM network capable of classifying the activities of HAPT open dataset with an accuracy of 85.87%. First, they made a transformation of the times series data to an image like two-dimensional array. Then they deployed three Convolutional neural network layers for the extraction of the motion features, and finally the LSTM layer comes to establish a relation between the actions and the sequences. In [10] The authors proposed a network called PEN PERCEPTIVE extraction network, which is divided into two parts : the first one is a CNN, and the second one is an LSTM-based feature extraction. The whole allowed to make a robust feature extraction which was reflected on the results obtained for two databases UCI HAR and WISDM. In [11] The authors also chose to exploit the signals generated by an accelerometer and a gyroscope to classify the six activities of the UCI dataset, they built four networks based on LSTM, they found that the combination between CNN-LSTM provided the best score and allowed a better extraction of features. In healthcare domain [12] the authors proposed EnsemConvNet, constituted of three classification networks built all around 1D Convolutional network, CNN-NET, Encode-NET, CNN-LSTM, the classification result is decided using the techniques of classifier combination. In [13] with the help of a new technique of dimentiality reduction the authors were able to reduce the number of features of the UCI HAR dataset to 66 features, this technique is called FFDRT and it allowed them to have an accuracy of 98.72%.
Authors in [14] followed the same logic, they combined four convolutional layers, two recurrent LSTM layers and an ELM classifier to take advantage of its generalization and learning speed capabilities for activity recognition. authors used in [15] smartphones to collect data they adapted a classic CNN architecture called LeNET [16], after training on six elemental activities the generated model is transferred back to the android phone.
3 Background
3.1 Recurrent Neural Network
RNNs is a type of neural networks that were initially created in the 1980’s, for the purpose of anticipating what’s coming straightaway in an extremely exact way. This ability is what they made them the most suitable for sequential data like time series prediction, speech and audio recognition, financial data, weather forecasting and much more. RNN possesses cyclic connections that allows it to learn the temporal dynamics of sequential inputs. Each node in the hidden layer has a function that input the current hidden layer state and generate the output based on its current input and the previous hidden state according to the following equations:
| (1) | ||
| (2) |
, , and are the weight for the hidden-to-hidden recurrent connection, input-to-hidden connection, and hidden-to-output connection, respectively. And are bias terms for the hidden and output states, respectively. Each node also has an activation function F connected with it [17]. This is an element-wise non-linearity function that is commonly selected from a variety of existing functions, such as the sigmoid, hyperbolic tangent or rectified linear unit (ReLU) [17].
3.2 Long Short-term Memory
The vanishing and exploding gradient are serious problems that delay the gradient to back propagate through long range time intervals and that makes the training of regular RNNs a very challenging Task. LSTM is designed to solve the problems of RNN. This method is based on changing the structure of hidden units from “sigmoid” or “tanh” to memory cells, with gates controlling their inputs and outputs [18]. These gates regulate the flow of information to hidden neurons and preserve extracted features from earlier time steps [19].
3.3 Support Vector Machine
Or SVM is a machine learning algorithm known for its powerful extraction capabilities, making it a useful tool in a variety of applications such as cancer detection, facial recognition, and fraud detection.
SVM works mainly by creating a hyperplane that can effectively separate two kinds of data [20], it aims to maximize the distance between them. Mathematically this plan can be expressed as:
| (3) |
The offset between the hyperplane and the origin plane is represented by . Where designates the normal to that hyperplane.
We can convert the initial objective function into a dual min max optimization task by applying the Lagragien coefficient.
| (4) |
L is the Lagragien function and are its coefficient, p is a penalty factor. And the index takes values from 0 to p.
4 Proposed Methodology
4.1 Architectures
We discuss in this section our Stacked LSTM network [21] versus other architectures that we proposed to investigate the performance on motion detection. We mention that UCI HAR database was used for evaluation.
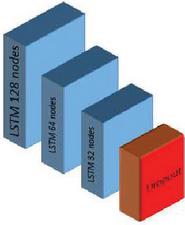
Figure 1 Deep Stacked LSTM network.
Table 1 The parameters of our network
| Parameters | Value |
| lstm layer_1 | 128 |
| lstm layer 2 | 64 |
| lstm layer 3 | 32 |
| dropout | 90% |
| flatten | – |
| dense layer_3 | output numbers=6 (Softmax) |
The First architecture: Stacked LSTM has been frequently used in the literature for time series prediction, for its capability of identifying and extracting temporal relationships between signal readings. Our first LSTM network, in which we used three consecutive layers of LSTM to represent more complicated patterns, adding depth to the network and increasing its extraction capacity. After that, we added a dropout layer with a different number of nodes for each layer. Using a mix of 128,64 and 32 nodes, we were able to achieve good accuracy with a small number of parameters. Table 2 below shows the various designs that were studied. We kept adjusting our network and analyzed several parameters such as the number of Dropout. During our experience we observed that increasing the number of layers degrades the performance, while shallow architectures that use one- or two-layers lead to weak accuracies. All the LSTM layers are followed by a dropout after the third layer and before the final dense layer to reduce overfitting.
To arrive to the network presented in Table 1 we performed an investigation on the most impacting hyper-parameters. Therefore, we built several variants of our network to verify the impact of the architecture and the number of nodes on the total performance.
Table 2 Details and parameters of the tested structures
| Structure | Accuracy % | Parameters | Time/Epoch |
| A: lstm(32)-lstm(32)-lstm(32) | 94.19 | 46,598 | 2 s |
| B: lstm(64)-lstm(64)-lstm(64) | 95.82 | 134,150 | 2 s |
| C: lstm(128)-lstm(128)-lstm(128) | 95.14 | 432,134 | 3 s |
| D: lstm(128)-lstm(64)-lstm(32) | 96.098 | 157,062 | 2 s |
We indicate the number of nodes in between brackets. It can be seen in Table 2 that structure D, provided the best performance while maintaining deepness and a limited number of parameters without slowing down computation speed. In what follows, we adopted this structure and we continued to tune the hyper-parameters. To limit the influence of overfitting, we examined multiple values of dropout ranging from 0.2 to 0.9 and evaluated the accuracy for each one. We found that large values of dropout improve the performance, and 0.9 enhance the accuracy.
Figure 2 presents the accuracy of each dropout value. Batch size. Using small values of batch size as 32 gave us a good accuracy compared with large values like 128 and 192, which tend to speed up the calculation, but on the other hand limits the number of updates to reach the convergence [22]. Table 3 shows that the best score is obtained when the batch size is set to 32. Effect of the Optimizer. Table 4 shows that, when compared to the Adadelta, Nadam, and SGD optimizers, Adam optimizer produced the best results with the fastest calculation using its default values (Learning rate 0.001). Rmsprop also provided us with a good level of accuracy.
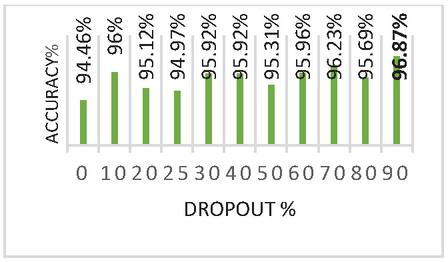
Figure 2 Impact of dropout.
Table 3 Impact of batch size on accuracy for UCI
| Batch Size | Accuracy | Time Per Epoch |
| 32 | 97.15% | 23 s |
| 64 | 96.10% | 12 s |
| 128 | 94.70% | 3 s |
| 192 | 96.064% | 4 s |
Table 4 Impact of the optimizer on accuracy UCI HAR
| Optimizer | Adadelta | Nadam | SGD | Adam | RMSProp |
| Accuracy % | 50,39 | 96,06 | 90,74 | 97,15 | 96,47 |
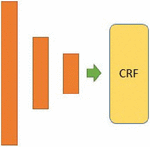
The second architecture called S-LSTM-CRF presented in Figure 3 is a modification of the first stacked LSTM architecture with the same number of nodes but with a difference in the final layer. In this network, instead of using Softmax to do the classification, we chose Conditional random field (CRF). This algorithm uses log-loss. we had an accuracy that does not exceed 92%, this result does not increase even if we change the value of hyper parameters.
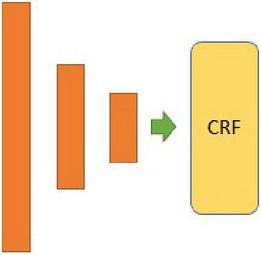
Figure 3 Three stacked LSTM with CRF in the last layer (S-LSTM+CRF).
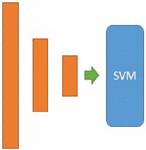
The third architecture S-LSTM-SVM, presented in Figure 4 uses the same LSTM model but this time CRF is replaced by SVM which uses Hinge loss.

Figure 4 Three stacked LSTM with SVM in the last layer.
The Fourth architecture SLSTM Inception, this network is based on an adaptation of inception network for time series data.

Figure 5 Inception module basic version.
The Inception Module is a structure that permits various types of filters to be combined in a single network. We adjusted this module for time series data by utilizing only the naïve version presented in Figure 5, changing the number of the convolution filters 1*1, 3*3, and 5*5, and using one-dimensional convolution and Maxpooling layers instead of 2 dimensional operations in each layer. Last the concatenation of all layers into a single output is done in next layer. The performances of all the proposed architectures tested on UCI HAR are evaluated in Table 5.

Figure 6 Deep Stacked LSTM Inception.
The combination between CNN and LSTM was presented in several works in the literature and it allowed to reach good results. The main idea is to design a network which is wide using the concatenated convolutions and deep by combining our first network stacked LSTM with four inception modules. This combination exposed in Figure 6 gives us the best accuracy which is 97.20%, it is superior to our first stacked LSTM, but the number of parameters is big. We remarked that increasing the number of inception modules increase the performance after training the model over 200 epochs, unfortunately this increases also exponentially the complexity.
Table 5 Comparison results
| Architecture | Accuracy |
| Basic Inception module | 93.92 % |
| Stacked LSTM Inception module | 97.20 % |
| Stacked LSTM | 97.15 % |
| Stacked LSTM Inception module CRF | 93% |
| Stacked LSTM CRF | 92% |
| Stacked LSTM SVM | 93.24% |
After analyzing the performance, the use of three LSTM layers is the best. This is also proven by the combination of these three layers with other networks. Below three LSTM layers the model significantly loses its extraction capacity, and above this value the model falls into overfitting. We notice that the use of more than three Inception modules with our stacked LSTM increases the accuracy but at the same time the complexity, which favors the use of the Stacked LSTM because of its lightness. The use of the Inception module alone also gives a good result. The second part of the experiment shows that the placement of the Softmax function at the last layer is preferable and gives better results than the use of CRF and SVM.
5 Experiment
5.1 Datasets
We considered two public benchmark datasets for HAR to evaluate the performance of our network. Here is a brief description of each:
UCI HAR [23] is a dataset collected by 30 users of different ages (from 19 to 48 years) wearing Samsung Galaxy SII smartphones on the waist and performing six activities as presented in Figure 7. The accelerometer and gyroscope sensors are used to collect data. The available dataset contains 10,299 samples which are already separated into a training set and a test set.
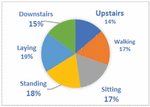
WISDM v1.1 [24], provided by the wireless sensor data mining (WISDM) Lab, is a dataset collected by using only one accelerometer of a smartphone in the front pants leg pocket. Sampled at 20Hz, the chosen activities were selected depending on their performance regularity in daily life. Walking, Jogging, Upstairs, Downstairs, Sitting, and Standing presented in Figure 8, were performed by 36 volunteer participants.
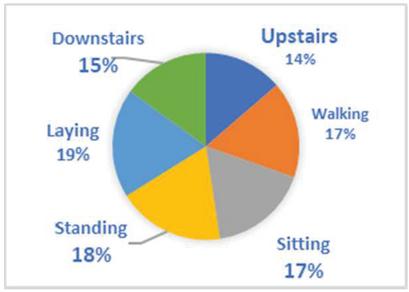
Figure 7 Distribution of UCI HAR activities.
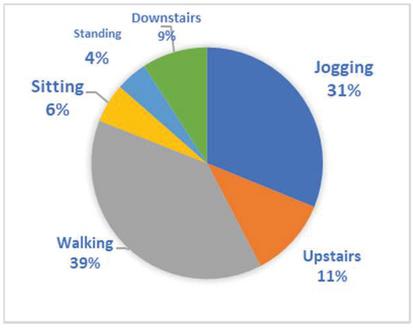
Figure 8 Distribution of WISDM activities.
5.2 Performance Measure
We utilized four widely used evaluation metrics to compare the model’s performance, they are Accuracy, Recall, Precision, F-Measure, defined as follows (TP: True Positive, TN: True Negative, FP: False Positive and FN: False Negative):
| (5) | ||
| (6) | ||
| (7) | ||
| (8) |
5.3 Training
UCI HAR dataset is devised to 70% for training and 30% for testing, as a result subject’s 2, 4, 9, 10, 12, 13, 18, 20, and 24 data left unseen by the model. This splitting will allow a fair comparison with previous works using the same evaluation technique. We used Adam optimization algorithm to minimize the cost function. Softmax layer exists in the final layer and the gradient back propagates from this layer to the LSTM layers of the input. The dropout is 90%. During training we tested different batch sizes. for over 200 epochs we selected the size of 32. The signals in this dataset have been pre-processed using a low pass filter with 50% overlap. The sliding window has a size of 2.56 sec.
To verify the generalization capability of our network, we tested it on WISDM dataset using raw data with no feature selection, we just applied a sliding window, with a width of 180 and a time step of 100.
6 Results and Discussion
To compare our results, we draw Table 6 which contains the test accuracy of various approaches. The score achieved surpasses other studies based on feature selection or feature engineering, or methods based on traditional machine learning classification algorithms.
Table 6 Comparison with other works on UCI HAR dataset
| Approach | [25] | [26] | Ours | [27] | [28] | [29] | [29] | [30] |
| Accuracy % | 91.76 | 93.18 | 97.15 | 95.49 | 93.6 | 95.75 | 94.79 | 92.16 |
Table 7 Comparison with other works on WISDM
| Approach | Catal et al [31] | Alsheikh et al [32] | Ours | Ravi et al [33] |
| Accuracy % | 94.3 | 98.2 | 99 | 98.6 |
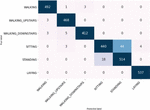
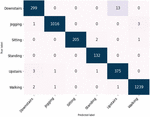
To analyze the behavior of the detection of each class, we draw the confusion matrix presented in Figure 9. It’s clear that doing the distinction between the sitting and standing classes was a bit of a challenge for the model. We can understand this misclassification if we remember the localization of the sensor on the waist. This position tends to make the gathered signals from those activities very similar. For WISDM dataset, we adopted two methods of evaluation, using a split of 70% training – 30% testing and using 5-fold cross validation. Although those two techniques are different, they have led to approximately the same accuracy score. We compare in Table 7 the results with the existing state of the art works. For the Per user classification Ignatov et al. [34] chose the first 26 subjects for their training set and then tested the results on the remaining ten users, achieving the score of 93.32%. We adopted the same splitting, and we get 99% accuracy again. Figure 10 shows there is a slight difficulty in the detection of upstairs and downstairs activities. To get a comprehensive vision of which activities our model can detect the most, we’ve included in Table 8 the classification results for each class.

Figure 9 Confusion matrix for UCI HAR dataset.

Figure 10 Confusion matrix for WISDM dataset.
Table 8 Per activity classification of our model
| WISDM v1 | UCI HAR | |||
| Precision | Recall | Precision | Recall | |
| downstairs | 0.98 | 0.96 | 0.99 | 0.98 |
| jogging | 1 | 1 | – | – |
| sitting | 1 | 0.99 | 0.96 | 0.90 |
| standing | 0.98 | 1 | 0.92 | 0.97 |
| upstairs | 0.96 | 0.99 | 0.98 | 0.99 |
| walking | 1 | 1 | 0.99 | 0.99 |
| laying | – | – | 0.99 | 1.00 |
| F1-score | 0.99 | 0.97 | ||
WISDM and UCI HAR have nearly identical activities, except for jogging and laying, which are distinct. We can divide them into two categories: static and dynamic. The former includes laying and standing, while the latter includes walking downstairs, jogging, walking upstairs, and walking. They also present the vast bulk of the data in WISDM and almost half of UCI HAR dataset. A recall of 1 for an activity C signifies that each item belonging to this class, was labelled as belonging to class C. As can be seen in Table 8, we had a good recall for all the classes in both datasets except sitting, where data was gathered using an accelerometer and a gyroscope and classification was a little more difficult, it is misclassified with standing. downstairs, on the other hand, has a lower recall of 0.96 than the others, indicating that recognizing the down direction with only one accelerometer is challenging. The remaining activities have all a good recall reaching 1. The presented results show that our model can detect those basic behaviors even when the position, number, and kind of sensors are changed.
7 Conclusion
In this work artificial intelligence and the IoT are exploited to design a lightweight network capable of recognizing human activities. Our approach is based on the use of stacked LSTM layers in an end-to-end fashion without any data pre-processing. It eliminated the need of feature engineering and provided a better performance than traditional methods based on feature design. We plan to investigate other datasets with more complex actions in the future, as well as an energy-efficient implementation of this model in smart devices.
References
[1] X. Zhou, W. Liang, K. I.-K. Wang, H. Wang, L. T. Yang, and Q. Jin, “Deep-Learning-Enhanced Human Activity Recognition for Internet of Healthcare Things,” IEEE Internet of Things Journal, vol. 7, no. 7, pp. 6429–6438, Jul. 2020, doi: 10.1109/JIOT.2020.2985082.
[2] K. K. Htike, O. O. Khalifa, H. A. Mohd Ramli, and M. A. M. Abushariah, “Human activity recognition for video surveillance using sequences of postures,” in The Third International Conference on e-Technologies and Networks for Development (ICeND2014), Apr. 2014, pp. 79–82. doi: 10.1109/ICeND.2014.6991357.
[3] S.-R. Ke, H. L. U. Thuc, Y.-J. Lee, J.-N. Hwang, J.-H. Yoo, and K.-H. Choi, “A Review on Video-Based Human Activity Recognition,” Computers, vol. 2, no. 2, Art. no. 2, Jun. 2013, doi: 10.3390/computers2020088.
[4] W. Lu, F. Fan, J. Chu, P. Jing, and S. Yuting, “Wearable Computing for Internet of Things: A Discriminant Approach for Human Activity Recognition,” IEEE Internet of Things Journal, vol. 6, no. 2, pp. 2749–2759, Apr. 2019, doi: 10.1109/JIOT.2018.2873594.
[5] B. Oluwalade, S. Neela, J. Wawira, T. Adejumo, and S. Purkayastha, “Human Activity Recognition using Deep Learning Models on Smartphones and Smartwatches Sensor Data,” arXiv:2103.03836 [cs, eess], Feb. 2021, [Online]. Available: http://arxiv.org/abs/2103.03836
[6] M. M. Hassan, Md. Z. Uddin, A. Mohamed, and A. Almogren, “A robust human activity recognition system using smartphone sensors and deep learning,” Future Generation Computer Systems, vol. 81, pp. 307–313, Apr. 2018, doi: 10.1016/j.future.2017.11.029.
[7] P. Agarwal and M. Alam, “A Lightweight Deep Learning Model for Human Activity Recognition on Edge Devices,” Procedia Computer Science, vol. 167, pp. 2364–2373, Jan. 2020, doi: 10.1016/j.procs.2020.03.289.
[8] T. Mahmud, A. Q. M. S. Sayyed, S. A. Fattah, and S.-Y. Kung, “A Novel Multi-Stage Training Approach for Human Activity Recognition from Multimodal Wearable Sensor Data Using Deep Neural Network,” IEEE Sensors J., vol. 21, no. 2, pp. 1715–1726, Jan. 2021, doi: 10.1109/JSEN.2020.3015781.
[9] H. Wang et al., “Wearable Sensor-Based Human Activity Recognition Using Hybrid Deep Learning Techniques,” Security and Communication Networks, vol. 2020, p. 2132138, juillet 2020, doi: 10.1155/2020/2132138.
[10] Z. Xiao, X. Xu, H. Xing, F. Song, X. Wang, and B. Zhao, “A federated learning system with enhanced feature extraction for human activity recognition,” Knowledge-Based Systems, vol. 229, p. 107338, Oct. 2021, doi: 10.1016/j.knosys.2021.107338.
[11] S. Mekruksavanich and A. Jitpattanakul, “LSTM Networks Using Smartphone Data for Sensor-Based Human Activity Recognition in Smart Homes,” Sensors, vol. 21, no. 5, Art. no. 5, Jan. 2021, doi: 10.3390/s21051636.
[12] D. Mukherjee, R. Mondal, P. Singh, R. Sarkar, and D. Bhattacharjee, “EnsemConvNet: a deep learning approach for human activity recognition using smartphone sensors for healthcare applications,” Multimedia Tools and Applications, 2020, doi: 10.1007/s11042-020-09537-7.
[13] B. A. Mohammed Hashim and R. Amutha, “Human activity recognition based on smartphone using fast feature dimensionality reduction technique,” J Ambient Intell Human Comput, vol. 12, no. 2, pp. 2365–2374, Feb. 2021, doi: 10.1007/s12652-020-02351-x.
[14] J. Sun, Y. Fu, S. Li, J. He, C. Xu, and L. Tan, “Sequential Human Activity Recognition Based on Deep Convolutional Network and Extreme Learning Machine Using Wearable Sensors,” Journal of Sensors, vol. 2018, p. e8580959, Sep. 2018, doi: 10.1155/2018/8580959.
[15] J. Cao, M. Lin, H. Wang, J. Fang, and Y. Xu, “Towards Activity Recognition through Multidimensional Mobile Data Fusion with a Smartphone and Deep Learning,” Mobile Information Systems, vol. 2021, p. 6615695, avril 2021, doi: 10.1155/2021/6615695.
[16] Y. Lecun, L. Bottou, Y. Bengio, and P. Haffner, “Gradient-based learning applied to document recognition,” Proceedings of the IEEE, vol. 86, no. 11, pp. 2278–2324, Nov. 1998, doi: 10.1109/5.726791.
[17] A. Murad and J.-Y. Pyun, “Deep Recurrent Neural Networks for Human Activity Recognition,” Sensors, vol. 17, no. 11, Art. no. 11, Nov. 2017, doi: 10.3390/s17112556.
[18] L. Cong, K. Tang, J. Wang, and Y. Zhang, “AlphaPortfolio for Investment and Economically Interpretable AI,” SSRN Journal, 2020, doi: 10.2139/ssrn.3554486.
[19] J. Gu et al., “Recent advances in convolutional neural networks,” Pattern Recognition, vol. 77, pp. 354–377, May 2018, doi: 10.1016/j.patcog.2017.10.013.
[20] N. Zeng, H. Qiu, Z. Wang, W. Liu, H. Zhang, and Y. Li, “A new switching-delayed-PSO-based optimized SVM algorithm for diagnosis of Alzheimer’s disease,” Neurocomputing, vol. 320, pp. 195–202, Dec. 2018, doi: 10.1016/j.neucom.2018.09.001.
[21] Zakaria Benhaili et al., “Human Activity Recognition Using Stacked Lstm,” The International Conference on Information, Communication & Cybersecurity ICI2C’21, ENSA Khouribga, Morocco, Nov. 10, 2021.
[22] Y. Bengio, “Practical Recommendations for Gradient-Based Training of Deep Architectures,” in Neural Networks: Tricks of the Trade: Second Edition, G. Montavon, G. B. Orr, and K.-R. Müller, Eds. Berlin, Heidelberg: Springer, 2012, pp. 437–478. doi: 10.1007/978-3-642-35289-8\_26.
[23] D. Anguita, A. Ghio, L. Oneto, X. Parra, and J. L. Reyes-Ortiz, “A Public Domain Dataset for Human Activity Recognition using Smartphones,” presented at the 21th European Symposium on Artificial Neural Networks, Computational Intelligence and Machine Learning, Bruges, Belgium, Apr. 2013.
[24] J. R. Kwapisz, G. M. Weiss, and S. A. Moore, “Activity recognition using cell phone accelerometers,” SIGKDD Explor. Newsl., vol. 12, no. 2, pp. 74–82, Mar. 2011, doi: 10.1145/1964897.1964918.
[25] C. A. Ronao and S. B. Cho, “Human activity recognition using smartphone sensors with two-stage continuous hidden markov models: 2014 10th International Conference on Natural Computation, ICNC 2014,” 2014 10th International Conference on Natural Computation, ICNC 2014, pp. 681–686, 2014, doi: 10.1109/ICNC.2014.6975918.
[26] C. A. Ronao and S.-B. Cho, “Recognizing human activities from smartphone sensors using hierarchical continuous hidden Markov models,” International Journal of Distributed Sensor Networks, vol. 13, no. 1, p. 1550147716683687, Jan. 2017, doi: 10.1177/1550147716683687.
[27] Y. Lin and J. Wu, “A Novel Multichannel Dilated Convolution Neural Network for Human Activity Recognition,” Mathematical Problems in Engineering, vol. 2020, p. e5426532, Jul. 2020, doi: 10.1155/2020/5426532.
[28] Y. Zhao, R. Yang, G. Chevalier, X. Xu, and Z. Zhang, “Deep Residual Bidir-LSTM for Human Activity Recognition Using Wearable Sensors,” Mathematical Problems in Engineering, vol. 2018, p. e7316954, Dec. 2018, doi: 10.1155/2018/7316954.
[29] C. A. Ronao and S.-B. Cho, “Human activity recognition with smartphone sensors using deep learning neural networks,” Expert Systems with Applications, vol. 59, pp. 235–244, Oct. 2016, doi: 10.1016/j.eswa.2016.04.032.
[30] Y. Li, D. Shi, B. Ding, and D. Liu, “Unsupervised Feature Learning for Human Activity Recognition Using Smartphone Sensors,” in Mining Intelligence and Knowledge Exploration, Cham, 2014, pp. 99–107.
[31] C. Catal, S. Tufekci, E. Pirmit, and G. Kocabag, “On the use of ensemble of classifiers for accelerometer-based activity recognition,” Applied Soft Computing, vol. 37, pp. 1018–1022, Dec. 2015, doi: 10.1016/j.asoc.2015.01.025.
[32] M. A. Alsheikh, A. Selim, D. Niyato, L. Doyle, S. Lin, and H.-P. Tan, “Deep Activity Recognition Models with Triaxial Accelerometers,” arXiv:1511.04664 [cs], Oct. 2016, [Online]. Available: http://arxiv.org/abs/1511.04664
[33] D. Ravi, C. Wong, B. Lo, and G.-Z. Yang, “A Deep Learning Approach to on-Node Sensor Data Analytics for Mobile or Wearable Devices,” IEEE J. Biomed. Health Inform., vol. 21, no. 1, pp. 56–64, Jan. 2017, doi: 10.1109/JBHI.2016.2633287.
[34] A. Ignatov, “Real-time human activity recognition from accelerometer data using Convolutional Neural Networks,” Applied Soft Computing, vol. 62, pp. 915–922, Jan. 2018, doi: 10.1016/j.asoc.2017.09.027.
Biographies

Zakaria Benhaili received the engineering degree from the National School of Applied Sciences at Sultan Moulay Slimane University, Khouribga, Morocco, in 2017, Currently a PhD student in Third year in Faculty of Sciences and Technologies at Hassan 1 st University. His main research area includes Internet of Things, deep learning and its applications in human activity recognition, pattern recognition, and smart homes.

Youness Abouqora received the engineering degree from the National School of Computer Science and Systems Analysis from Mohamed Fifth University, Rabat, Morocco, in 2009, and PhD student in fourth year at MCSES in Faculty of Sciences and Technologies at Hassan 1 st University. His current research interests include deep learning and its applications such as in computer vision, pattern recognition, robotics.

Youssef Balouki Laboratory of Mathematics, Computer and Engineering Sciences, Faculty of Sciences and Techniques, Hassan I University, Settat, Morocco. Youssef Balouki is currently a Professor of computer science with the Faculty of Science and Technologies, Hassan I University, Settat, Morocco. He has conducted many Ph.D. theses and has written a fifty of scientific articles in the domain of artificial intelligence, software engineering, model-driven development, data mining, and formal methods.
Lahcen Moumoun received the advanced graduate diploma in structural calculation from the National School of Electricity and Mechanics of Casablanca from Hassan Second University, Casablanca, Morocco, in 1995, and the Ph.D. degree in image processing from in Faculty of Sciences and Technologies at Hassan 1 st University, Morocco, in 2011. He has been a professor of computer science engineering with Hassan 1 st University, since 2014. He has authored or co-authored more than 100 refereed journal and conference papers, 10 book chapters, and three edited books with Elsevier and Springer. His research interests include pattern recognition, computer vision, big data and deep learning.
Journal of ICT Standardization, Vol. 10_2, 241–260.
doi: 10.13052/jicts2245-800X.1028
© 2022 River Publishers