Online Impulsive Buying Behavior Using Partial Least Squares Algorithm
Dam Tri Cuong
Industrial University of Ho Chi Minh City, Vietnam
E-mail: damtricuong@iuh.edu.vn
Received 25 September 2022; Accepted 15 May 2023; Publication 11 September 2023
Abstract
Impulsive purchasing is one of many fascinating subjects to investigate in e-commerce research. Online buying facilitates purchases and provides impulsive buyers with a venue to meet their demands. Impulse buying occurs when a client feels a sudden, overpowering need to make a purchase, which is a common practice among online shoppers. Therefore, the study’s purpose is to apply the partial least square (PLS) algorithm to investigate the factors driving online impulsive buying behavior (OIBB). Besides, in this research, the stimulus organism response (SOR) model was used as the research’s guiding theory; with the stimulus such as visual appeal and price attributes, the organism comprising perceived enjoyment and perceived usefulness, and response as OIBB. In addition, a non-probability sampling method was employed to collect data from 313 customers who shared their online impulsive purchase experiences through a Google Forms online survey. The collected data was analyzed using the PLS technique to assess the reliability, convergent validity, and discriminant validity of the variables, as well as test the proposed hypotheses. The findings reveal that visual appeal and price attributes were positive connections to perceived enjoyment and perceived usefulness. Likewise, perceived enjoyment and perceived usefulness also impacted positively OIBB. Additionally, the findings disclosed that visual appeal and price attributes also were associated positively with OIBB.
Keywords: Online impulsive buying behavior, visual appeal, price attributes, perceived enjoyment, perceived usefulness, SOR framework, PLS algorithm.
1 Introduction
We have seen a paradigmatic shift because of the success of e-commerce, where more and more individuals are switching from offline to online shopping [1]. This demonstrates clearly how crucial e-commerce is becoming to the retail sector. Impulsive purchasing is a fascinating area of study in e-commerce research. Online shopping makes purchasing easier and gives impulsive shoppers a place to fulfill their needs. Online shoppers frequently engage in impulse buying, which is when a customer has a sudden, persistent, and overwhelming need to make a purchase [2]. Besides, the Internet has evolved into a crucial component of people’s daily life, both at work and at home. The rapid development of information technology has impacted the consumer behavior landscape. The 24/7 accessibility of online shopping has led to a rise in impulsive purchases [3]. Similarly, consumers constantly preferred online shopping, especially on special occasions. They typically act impulsively when making selections regarding shopping online. One-click ordering, simple product access, extensive product information, and time savings are all elements that encourage online impulsive buying behavior (OIBB). Moreover, OIBB has become a worldwide phenomenon because of the explosive rise of e-commerce and the quick advancement of information technology [4]. According to the research of Liu et al. [5], 40% of all online purchases are impulse purchases. It is obvious that the online retail environment considerably boosts store earnings, so it is crucial to comprehend OIBB.
Furthermore, the academic study focuses on OIBB as a research issue in response to the growing number of consumers who prefer to make impulsive purchases from online shopping [6]. There are many studies on OIBB using the stimulus organism response (SOR) model. For example, Moreno et al. [7] implemented the SOR model to evaluate consumers’ OIBB in the Philippines. The stimulus contained e-content, e-design, e-reviews, and e-promotion, while the organism was perceived enjoyment and online trust, and the response was OIBB. Karim et al. [8] employed the SOR model to examine the elements that influence the OIBB in Malaysia. The stimuli consisted of website stimulus, marketing stimulus, and product variety, while the organism factor was perceived enjoyment, and the OIBB variable represented the response. Iftikhar and Iqbal [9] adopted the SOR paradigm to explore consumers’ OIBB in Pakistan; in which stimuli comprise factors (social influence, sales promotion, and impulse purchasing tendency), the organism with the factor (urge to purchase impulsively), and the response with the OIBB. Another study in Pakistan by Hashmi et al. [10] also applied the SOR model for factors affecting the OIBB with the stimulus being the website quality factor, the organism being the shopping values factor, and the response being the OIBB factor. The research of Yendola and Windasari [11] of clients’ OIBB in Indonesia. The stimulus was the product type and free shipping threshold type, while the organism was positive affect and hedonic motivation and the response was OIBB. However, the SOR model for consumers’ OIBB using the partial least square (PLS) algorithm is little investigated in the previous studies in Vietnam. Thus, this research fills this study gap by adopting the SOR model and examining the determinants affecting online impulsive buying behavior using the partial least square (PLS) algorithm. This study focuses on the stimulus with price attributes and visual appeal, while the organism as perceived enjoyment and perceived usefulness, and response as OIBB.
The structure of the paper is arranged in the following sequence: Section 1 outlines the research’s general scope and the gap in the current literature that the study aims to address. This is followed by a presentation of the theoretical background, research hypotheses development, and the proposed research model. The methodology utilized, which involves an online survey, is subsequently discussed. Following this, the paper presents the data analysis, results, and discussion. Lastly, the study’s conclusions and limitations are discussed.
2 Literature Review
2.1 Foundation Theory: Stimulus Organism Response Framework
The SOR model, created by Mehrabian and Russell [12], postulates that an external cue (stimulus) can have an impact on an individual’s (organism) internal state and lead to behavior (response) [13]. It is based on environmental psychology and shows how external environmental stimuli affect consumers’ internal perceptions and how those perceptions affect individuals’ final behavior. It has been the most often used theoretical framework for examining online impulsive purchases [2]. The stimulus can be acknowledged as internal and external stimuli [4]. The organism is described as an internal mechanism or state that mediates the connection between the stimulus and the person’s eventual response [12]. The response can be recognized as the outcome of consumer behavior. It is connected to customers’ reactions to OIBB stimuli and organisms [4].
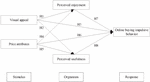
The focus of this research involves two factors, namely the visual appeal and price attributes, which are referred to as stimuli. Perceived enjoyment and perceived usefulness are categorized as the organism, and the OIBB of the SOR framework is considered the response.
2.2 Online Impulsive Buying Behavior (OIBB)
OIBB forms when a buyer needs to purchase online products, but does not thoroughly consider whether the product is necessary [14]. OIBB refers to online product purchases that are made spontaneously. OIBB encourages a buyer to purchase without sufficient knowledge of a product’s features [10]. According to Akram et al. [4], impulsive shopping refers to spontaneous, unplanned, irresistible, and sudden buying behavior. When shopping online, consumers frequently end up making impulsive purchases. Besides, customers’ emotions and inadequate cognitive control also drove OIBB. Consumers’ OIBB is stimulated by visual appeal, which affects consumers to make purchases without taking financial or other factors. Moreover, some studies have suggested that online buyers behave more impulsively than customers of traditional stores [6, 15].
2.3 Visual Appeal
Visual appeal is the term used to describe how a product’s package or label looks, and it includes elements like colors, forms, brands, images, letters, and layouts that work together to create a cohesive overall impression and deliver high-quality visual appeal [16]. Visual appeal refers to the display of textual styles and other visual components, for example, illustrations, and acting to upgrade the general show of a web [17]. Besides, websites are used for communication and information sharing, and visitors’ perceptions of them are influenced by their visual qualities. This means that online businesses need to pay attention to the aesthetic value of their websites [18]. Visual attractiveness is a critical factor in deciding the level of purchaser interest in the display subject enrichment and item information introduced by shopping sites [19]. Moreover, a lot of beautiful images can make viewers delighted by providing them with visual enjoyment. The user feels more pleasure when browsing if the recommended product is more likely to be feasible [20]. The visual appeal of an online store influences how perceived usefulness and excitement it is to the consumer as they browse it [2, 21]. In addition, the more the visual appeal is the higher the purchaser fulfillment, and the more probably happening of the event of OIBB [5]. Previous studies declared that visual appeal was an antecedent of perceived enjoyment and it will positively impact perceived enjoyment [2, 16]. Similarly, former research also demonstrated that visual appeal was a predictor of OIBB and impacted positively on OIBB [1, 22]. Based on that, we suggest the hypothesized:
H1: There is a positive correlation between visual appeal and perceived enjoyment.
H2: There is a positive correlation between visual appeal and perceived usefulness.
H3: There is a positive correlation between visual appeal and OIBB.
2.4 Price Attributes
Price relates to the sum of money paid for the goods and is a deciding element while buying, particularly for those with lower incomes or a tighter budget [23]. Price attributes aren’t just as far as item price, yet additionally incorporate conveyance costs and promotional costs, which are important in predicting OIBB [24]. Shoppers who buy online are more sensitive to product price since they can swift product price comparisons and do not expense. Customers can quickly compare price information from different online potential vendors, which encourages utilitarian shopping [6]. Besides, price-sensitive customers are typically logical and practical consumers who emphasize the benefits of utilitarian shopping [25]. In addition, perceived price advantage positively impacts the perceived usefulness of cross-purchasing [26]. Likewise, retailers can draw consumers’ OIBB with an eye-catching selection, discounts, and promotions, according to Lepkowska-White [27]. Moreover, the price attributes of online shopping have a positive impact on both hedonic and utilitarian product browsing [6]. Prior research debated that the price attributes were a predictor of perceived enjoyment and it affected positively perceived enjoyment [2]. Previous scientists recommended that price attributes are a predictor of perceived usefulness and affected OIBB [2, 28]. Likewise, price attributes are also a predictor of OIBB and significant effect on OIBB [29]. Based on that, we suggest the hypothesized that:
H4: There is an association positively between price attributes and perceived enjoyment.
H5: There is an association positively between price attributes and perceived usefulness.
H6: There is an association positively between price attributes and OIBB.
2.5 Perceived Enjoyment
Enjoyment alludes to a person’s emotional state in any shopping situation, and it is considered an important part of purchasing behavior. A perceived enjoyment can be portrayed as the joy that a customer might get from shopping exercises [30]. Perceived enjoyment refers to the consumer’s perception of fun, happiness, and delight when engaging in online purchasing [24]. Excitement, delight, relaxation, and inspiration are examples of positive consumer feelings [15]. The likelihood of a customer making an impulse purchase rises as their enjoyment of utilizing online platforms grows. Therefore, to encourage OIBB, it is essential to design e-commerce support systems with a tacit grasp of the essential elements impacting customer enjoyment [8]. As per Ingham et al. [31], consumers’ perceived enjoyment can be gotten through viewing the sites, and the experience will empower them to play out specific activities like internet buying exercises. Sometimes, viewers from various video blogs seek joy and are happy with the information displayed in video blogs. After that, they impact them on OIBB. Former studies confirmed that perceived enjoyment was an antecedent of OIBB and positively impacted OIBB [7, 8]. In light of the previously mentioned discussion, the accompanying hypothesis is suggested:
H7: There is an association positively between perceived enjoyment and OIBB.
2.6 Perceived Usefulness
Perceived usefulness is described as the degree to which an online shopper believes that using a certain website would improve their ability to shop efficiently [17]. Likewise, perceived usefulness is defined as the extent to which a person thinks that using a specific technology would improve his or her ability to accomplish their work [32]. Users, therefore, feel that there is a favorable use-performance relationship when a system has a high rating for perceived usefulness. Utilizable information can reduce users’ search expenses (i.e., time taken to search). In order to provide quality customer service, time must be used effectively, and customers should only be given the absolute minimum. It can reduce the time users spend looking up information on the website [33]. Besides, the perceived usefulness of a website’s product information is thought to be a critical factor in determining consumers’ OIBB [2, 4, 34]. Previous research confirmed that perceived usefulness positively influenced OIBB [4]. Based on the mentioned discussion, the accompanying hypothesis is proposed:
H8: There is an association positively between perceived usefulness and OIBB.
Based on the SOR theory as a theoretical background and hypothesis development above, we recommend the research model, as displayed in Figure 1:
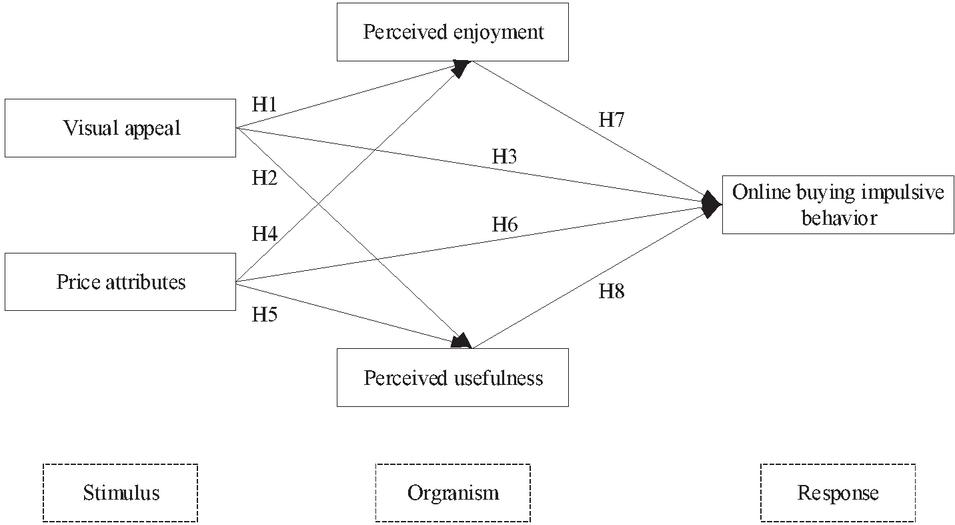
Figure 1 The research model.
3 Methodology
3.1 Analytical Method
In this study, the Partial Least Squares (PLS) algorithm is used. The PLS is a popular structural equation modeling (SEM) method that is variance-based in the social sciences. PLS is variance-based, making it appropriate for predictive applications and theory development. There are two steps to evaluate how well the goodness of the model fits the data [2].
First, a confirmatory factor analysis (CFA) was used to examine the measurement model’s discriminant and convergent validity. Testing internal consistency of indicators by Cronbach’s alpha () and composite reliability (CR). Testing convergent validity by average variance extracted (AVE). Testing discriminant validity by Fornell & Larcker index [35]. The formulas for calculating , CR, and AVE are [36]:
| (1) | Where – K is the number of indicators used in the construct. | |
| (2) | is the average nonredundant indicator correlation coefficient. | |
| (3) | – is the standardized outer loading of the indicator variable k of a certain construct tested with K indicators. |
Second, a structural model analysis was used to examine the meaning of the path coefficients and the research hypothesis. Testing structural model by testing bootstrapping to test structural model validity (hypotheses testing; the hypothesis is accepted when T-value 1.96 or p-value 0.05) and by R index. R is used to measure the overall influence of the structural model. R includes the values 0.19; 0.33 and 0.67 are the weak, moderate, and strong influences of the structural model, respectively [37].
Likewise, another scientist stated that a new statistical tool for the analysis process is the PLS algorithm [38]. Lohmoller [39] first presented the PLS algorithm as follows:
Table 1 PLS algorithm
| Stage 1 | Latent variable scores and weights are evaluated iteratively |
| Repeat steps 1 through 4 starting at step 4 until convergence is reached | |
| Step 1 | Internal weights |
| Step 2 | Internal estimate |
| Step 3 | External weights; resolve for w in |
| Step 4 | External estimate |
| Stage 2 | Path and loading coefficient estimation |
| Stage 3 | Location parameter estimation |
3.2 Data Gathering and Analysis
For the quantitative study in this analysis, a convenient sampling approach was used to collect data via a Google form. The minimum sample size for this analysis should be 100 responses or five times the number of items for the variables under consideration. The smallest sample size with 19 items under consideration is . After eliminating the responses that did not apply, we had a total of 313 valid responses. A sample of 313 responses was chosen to ensure the dependability of the sample. Table 2 displays the demographics of the sample.
Table 2 Demographics
| Features | Classification | Frequency | Percent |
| Gender | Male | 147 | 47.0 |
| Female | 166 | 53.0 | |
| Total | 313 | 100.0 | |
| Age | Under 18 | 40 | 12.8 |
| 18-25 | 120 | 38.3 | |
| Over 25 | 153 | 48.9 | |
| Total | 313 | 100.0 | |
| Job | Student | 44 | 14.1 |
| Office staff | 158 | 50.5 | |
| Freelance person | 68 | 21.7 | |
| Other | 43 | 13.7 | |
| Total | 313 | 100.0 |
In the valid sample, there are 166 female respondents (53%) and 47 male respondents (47%) as shown in Table 3. 40 respondents are under the age of 18 (12.8%), 120 respondents are between the ages of 18 and 25 (38.3%), and 153 respondents are over the age of 25 (48.9%). 44 respondents (or 14.1%) are students, 158 respondents (or 50.5%) are office workers, 68 respondents (or 21.7%) are freelance, and 43 respondents (or 13.7%) have other jobs.
3.3 Measures
In order to analyze the factors that influence OIBB using the PLS algorithm, we modified and revised the questions to fit the context of online shopping in Vietnam. The questionnaire consisted of several items, each rated on a five-point Likert scale ranging from “strongly disagree” to “strongly agree.” Table 3 displays the scale of the variables.
Table 3 The variables’ scale in the proposed model
| Variables and Items | Reference |
| Visual appeal – VA | [2, 40] |
| VA1. The website displays an attractive design. | |
| VA2. The website has visually pleasing. | |
| VA3. The website has appealing visuals. | |
| VA4. The home page is appealing, and I’d like to visit. | |
| Price attributes – PA | [2] |
| PA1. The website sells items for fair rates. | |
| PA2. On the website, discounts are quite affordable. | |
| PA3. The products on the website are reasonably priced. | |
| Perceived enjoyment – PE | [2, 21] |
| PE1. Shopping on sites is enjoyable. | |
| PE2. Shopping on sites is exciting. | |
| PE3. Shopping on sites is interesting. | |
| PE4. My access to the sites for shopping is fun. | |
| Perceived usefulness – PU | [4] |
| PU1. I can simply find the things I’m seeking by using online buying sites. | |
| PU2. I can gain a variety of product information by using online stores. | |
| PU3. Product information is clear and understandable on shopping websites. | |
| PU4. By using online stores, I can complete transactions rapidly. | |
| Online impulsive buying behavior – OIBB | [10] |
| OIBB1. My shopping was impulsive. | |
| OIBB2. My shopping was unplanned. | |
| OIBB3. Before visiting the website, I didn’t plan to make a purchase. | |
| OIBB4. I could not withstand purchasing on the website. |
4 Results and Analysis
Applying the partial least squares (PLS) algorithm to examine the measurement model and the structural model (hypothesis testing).
4.1 Measurement Model
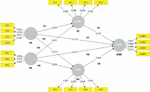
Table 4 shows the reliability and validity of the variables. As shown in Table 4, (from 0.807 to 0.893) & CR (from 0.874 to 0.927) of all variables surpassed the threshold values of 0.7. Thus, the measures in the proposed model are sufficiently the variables’ reliability. Besides, the outer loading of variables’ measurement indicators surpassed 0.7 (see Table 4, and Figure 2), and the AVE of all variables surpassed 0.5 (0.635–0.809); therefore, the suggested model is sufficiently convergent validity.
The relevant results are revealed in Table 5, where all square roots of AVEs (identified in bold) are larger than correlations between the variable, confirming the discriminant validity of the notions.
Table 4 Reliability and validity
| Variables | Outer Loading | CR | AVE | |
| VA | 0.743–0.844 | 0.807 | 0.874 | 0.635 |
| PA | 0.883–0.917 | 0.882 | 0.927 | 0.809 |
| PE | 0.839–0.898 | 0.889 | 0.923 | 0.750 |
| PU | 0.829–0.908 | 0.893 | 0.926 | 0.758 |
| OIBB | 0.813–0.884 | 0.873 | 0.913 | 0.724 |
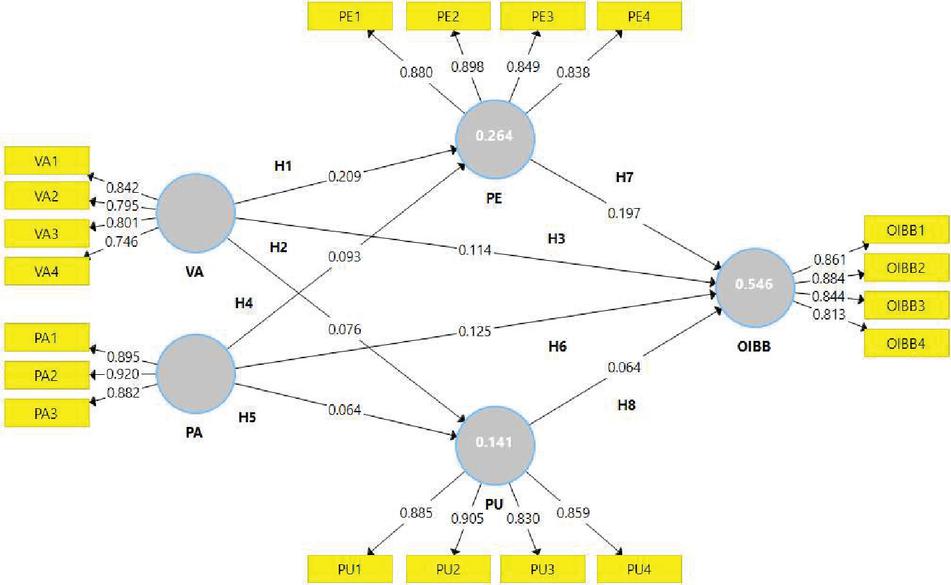
Figure 2 The results of the PLS algorithm.
Table 5 Discriminant validity
| OIBB | PE | PU | PA | VA | |
| OIBB | 0.851 | ||||
| PE | 0.609 | 0.866 | |||
| PU | 0.443 | 0.302 | 0.870 | ||
| PA | 0.477 | 0.339 | 0.286 | 0.899 | |
| VA | 0.519 | 0.47 | 0.302 | 0.186 | 0.797 |
4.2 Structural Model
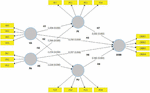
After reliability and validation checks, we used bootstrapping analysis with 2000 re-samples of the entire sampling to evaluate the model’s structural validity (hypotheses testing).
Table 6 Testing of the suggested hypothesis linking
| Hypothesis | T-value | Decision | |
| H1: VA PE | 0.398 | 5.276 | Confirmed |
| H2: VA PU | 0.259 | 3.843 | Confirmed |
| H3: VA OIBB | 0.258 | 4.501 | Confirmed |
| H4: PA PE | 0.266 | 4.792 | Confirmed |
| H5: PA PU | 0.238 | 3.917 | Confirmed |
| H6: PA OIBB | 0.257 | 4.596 | Confirmed |
| H7: PE OIBB | 0.350 | 5.156 | Confirmed |
| H8: PU OIBB | 0.185 | 3.735 | Confirmed |
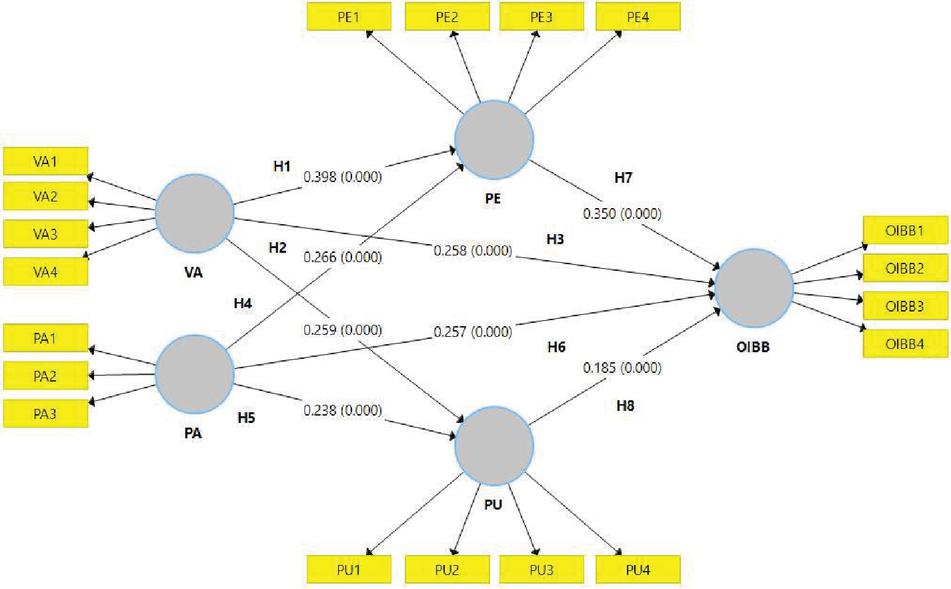
Figure 3 The result of bootstrapping (hypothesis testing).
In Table 6 and Figure 3, the findings of the structural path analysis are displayed. According to the structural model, visual appeal and perceived enjoyment are significantly considerably positively associated (, p 0.000). Visual appeal and perceived usefulness have a positive relationship (, p 0.000). Visual appeal and OIBB have a positive association (, p 0.000). Thus, the H1, H2, and H3 hypotheses are accepted. Likewise, there is a strong positive relationship between price attributes and perceived enjoyment (, p 0.000). There is a positive correlation between price attributes and perceived usefulness (, p 0.000). A positive correlation exists between price attributes and OIBB (, p 0.000). Therefore, in this research, the H4, H5, and H6 hypotheses are supported. Additionally, there is a considerable positive link between perceived enjoyment and OIBB (, p 0.000). There is a positive connection between perceived usefulness and OIBB (, p 0.000). As a result, the H7 and H8 hypotheses are confirmed.
Table 7 R result of variables
| Variables | R |
| OIBB | 0.546 |
| Perceived enjoyment | 0.264 |
| Perceived usefulness | 0.141 |
Table 7 shows that the overall model’s R square index is 0.546, less than 0.67, and is regarded as having a medium impact on the level of prediction of the structural model’s accuracy. This result also means that 54.6% of the variance in OIBB is explained by factors such as visual appeal, price attributes, perceived enjoyment, and perceived usefulness. Likewise, visual appeal and price attributes described variance in perceived enjoyment and perceived usefulness of 26.4% and 14.1%, respectively.
5 Discussion
The SOR model is widely used to analyze OIBB and this study employs the PLS technique with the SOR model as the theoretical framework to investigate the factors affecting OIBB. The study examines the relationship between OIBB and factors such as visual appeal, price attributes, perceived enjoyment, and perceived usefulness. The research contributes to add the understanding in the literature of how visual appeal and price attributes influence perceived enjoyment, perceived usefulness, and OIBB, as well as how perceived enjoyment and perceived usefulness affect OIBB. Furthermore, this study provides a comprehensive framework for this area through empirical analysis. The research findings were presented as follows:
The visual appeal had a notable and favorable impact on perceived enjoyment (H1: , T 5.276). It indicates that when consumers browse online shopping, the more visual appeal, the more consumers perceived enjoyment. Previous studies by Lee et al. [2], and Amanah and Harahap [16] also found that visual appeal has a significant role in perceived enjoyment. Likewise, a correlation exists between visual appeal and perceived usefulness (H2: , T 3.843), indicating that enhanced visual appeal can positively impact consumers’ perception of usefulness. This study aligns with previous research findings [2, 21]. Additionally, the visual appeal has a favorable influence on OIBB (H3: , T 4.501), implying that it can prompt consumers’ online impulse buying behavior. This outcome is supported by earlier research, such as the studies conducted by Zhao et al. [1] and Yang et al. [22]. Previous researchers [2, 16, 21, 22], as mentioned earlier, discussed how visual appeal positively influenced perceived enjoyment, perceived usefulness, and OIBB either individually or on two out of three factors. However, this current study found that visual appeal had a positive impact on all three factors (perceived enjoyment, perceived usefulness, and OIBB).
According to the results, it was revealed that the price attributes had a beneficial impact on perceived enjoyment of their online shopping experience (H4: , T 4.792). This suggests that when discounts are offered, the price factor can enhance customers’ perceived enjoyment when they browse products online. This result was confirmed by Lee et al. [2]. Besides, the price attributes were related positively to perceived usefulness (H5: , T 3.917), which means that price attributes such as discounts or reasonable prices lead to an increase in consumers’ perceived usefulness as it may help reduce clients’ time to browse products in online purchasing. This finding differs from the finding of Lee et al. [2]. Lee et al. [2]’s research discovered that the price factor did not have an impact on perceived usefulness. The reason behind this difference can be attributed to the variations in study settings. This research was carried out in Vietnam, while Lee et al.’s study [2] was conducted in Taiwan. In addition, the results verified that the price factor has a beneficial connection with OIBB (H6: , T 4.596). This means that as the discounts or reasonable prices increase, the consumers’ OIBB also gets better. This discovery corresponds with the earlier study outcome of Orangzab et al. [29]. Similarly, as discussed earlier, previous researchers [2, 29] argued that the price factor had a positive influence on perceived enjoyment, perceived usefulness, and OIBB individually or on two out of three factors. However, this current study revealed that the price factor had a positive impact on all three factors (perceived enjoyment, perceived usefulness, and OIBB).
The results also revealed that perceived enjoyment was related positively to OIBB (H7: , T 5.156). These findings also disclosed that perceived enjoyment was the most favorably impacted on OIBB. This discovery was reinforced by the work of Karim et al. [8]. This means that the more consumers’ perceived enjoyment when browsing the products, the more enhanced consumers’ OIBB. Similarly, perceived usefulness played a stimulus role positively in increasing OIBB (H8: , T 3.735). The results also found that perceived usefulness is related to OIBB, which was supported by Akram et al. [4]. This means the more consumers perceived usefulness the more they enhance OIBB.
6 Conclusions
The purpose of this study focused on applying the PLS technique with the SOR model as the theoretical framework to investigate the factors affecting OIBB. Through the literature review, the paper added a comprehensive conceptual model of how visual appeal and price attributes affect perceived enjoyment, perceived usefulness, and OIBB. Likewise, how perceived enjoyment and perceived usefulness impact OIBB. Besides, empirical research disclosed that determinants (visual appeal, price attributes, perceived enjoyment, and perceived usefulness) affecting positively OIBB; in which perceived enjoyment was the most favorably affected OIBB. Moreover, visual appeal and price attributes also affected positively perceived enjoyment and perceived usefulness.
Although this research has made noteworthy contributions to both literature and practice, there are certain limitations to it. Firstly, only 54.6% of the variance in OIBB could be explained by the factors of visual appeal, price attributes, perceived enjoyment, and perceived usefulness. Therefore, in order to improve the explanation of variance in OIBB, future research should include additional independent factors. Secondly, this study utilized the PLS algorithm to elucidate determinant factors in OIBB, suggesting that other approaches can be used by future studies to describe these factors.
References
[1] Zhao, Y., Li, Y., Wang, N., Zhou, R., and Luo, X. (Robert). (2021). A Meta-Analysis of Online Impulsive Buying and the Moderating Effect of Economic Development Level. Information Systems Frontiers. https://doi.org/10.1007/s10796-021-10170-4.
[2] Lee, C. H., Chen, C. W., Huang, S. F., Chang, Y. T., and Demirci, S. (2021). Exploring consumers’ impulse buying behavior on online apparel websites: An empirical investigation on consumer perceptions. International Journal of Electronic Commerce Studies, 12(1), 119–142. https://doi.org/10.7903/ijecs.1971.
[3] Legaspi, J. L., Galgana, I. L. O., and Hormachuelos, C. (2016). Impulsive Buying Behavior of Millennials on Online Shopping. In National Business and Management Conference (pp. 513–534).
[4] Akram, U., Hui, P., Khan, M. K., Saduzai, S. K., Akram, Z., and Bhati, M. H. (2017). The plight of humanity: Online impulse shopping in China. Human Systems Management, 36(1), 73–90. https://doi.org/10.3233/HSM-171768.
[5] Liu, Y., Li, H., and Hu, F. (2013). Website attributes in urging online impulse purchase: An empirical investigation on consumer perceptions. Decision Support Systems, 55(3), 829–837. https://doi.org/10.1016/j.dss.2013.04.001.
[6] Park, E. J., Kim, E. Y., Funches, V. M., and Foxx, W. (2012). Apparel product attributes, web browsing, and e-impulse buying on shopping websites. Journal of Business Research, 65(11), 1583–1589. https://doi.org/10.1016/j.jbusres.2011.02.043.
[7] Moreno, D. E., Fabre, E., and Pasco, M. (2022). Atmospheric Cues Roles: Customer’s Online Trust, Perceived Enjoyment, and Impulse Buying Behavior. Open Journal of Business and Management, 10, 223–244. https://doi.org/10.4236/ojbm.2022.101014.
[8] Karim, M. W., Chowdhury, M. A. M., Al Masud, M. A., and Arifuzzaman, M. (2021). Analysis of factors influencing impulse buying behavior towards e-tailing sites. Contemporary Management Research, 17(2), 97–126. https://doi.org/10.7903/CMR.20457.
[9] Iftikhar, M., and Iqbal, J. (2021). Investigating Online Impulse Buying Behavior In South Asian Context. Journal of Contemporary Issues in Business and Government, 27(02). https://doi.org/10.47750/cibg.2021.27.02.194.
[10] Hashmi, H., Attiq, S., and Rasheed, F. (2019). Factors Affecting Online Impulsive Buying Behavior: A Stimulus Organism Response Model Approach. Market Forces, 14(1), 19–42.
[11] Yendola, R. A., and Windasari, N. A. (2022). The Role of Threshold of Free Shipping Promotion and Product Type on Impulsive Buying Behaviour in E-Commerce Platform. The Winner, 23(2), 161–172. https://doi.org/10.21512/tw.v23i2.8140.
[12] Mehrabian, A., and Russell, J. A. (1974). An approach to environmental psychology. Cambridge: The MIT Press.
[13] Redine, A., Deshpande, S., Jebarajakirthy, C., and Surachartkumtonkun, J. (2023). Impulse buying: A systematic literature review and future research directions. International Journal of Consumer Studies, 47(1), 3–41. https://doi.org/10.1111/ijcs.12862.
[14] Chan, T., Cheung, C., and Lee, Z. (2017). The state of online impulse-buying research: A literature analysis. Information Management, 54(2), 204–217.
[15] Verhagen, T., and van Dolen, W. (2011). The influence of online store beliefs on consumer online impulse buying: A model and empirical application. Information and Management, 48(8), 320–327. https://doi.org/10.1016/j.im.2011.08.001.
[16] Amanah, D., and Harahap, D. A. (2020). Visual Appeal Model for Consumer Online Impulsive Purchases in Indonesia. International Journal of Scientific and Technology Research, 9(06), 388–397.
[17] Parboteeah, D. V., Valacich, J. S., and Wells, J. D. (2009). The influence of website characteristics on a consumer’s urge to buy impulsively. Information Systems Research, 20(1), 60–78. https://doi.org/10.1287/isre.1070.0157.
[18] D’Angelo, J., and Little, S. K. (1998). Successful Web Pages: What Are They and Do They Exist? Information Technology and Libraries, 17, 71–81.
[19] Zhang, H., Lu, Y., Wang, B., and Wu, S. (2015). The impacts of technological environments and co-creation experiences on customer participation. Information and Management, 52(4), 468–482. https://doi.org/10.1016/j.im.2015.01.008.
[20] Chen, Y., Li, D., and Zhao, Z. (2020). Research on Product Recommendation and Consumer Impulsive Purchase Under Social Commerce Platform – Based on S-0-R Model. Advances in Social Science, Education and Humanities Research, 427, 215–223. https://doi.org/10.2991/assehr.k.200331.048.
[21] Xiang, L., Zheng, X., Lee, M. K. O., and Zhao, D. (2016). Exploring consumers’ impulse buying behavior on social commerce platform: The role of parasocial interaction. International Journal of Information Management, 36(3), 333–347. https://doi.org/10.1016/j.ijinfomgt.2015.11.002.
[22] Yang, J., Cao, C., Ye, C., and Shi, Y. (2022). Effects of Interface Design and Live Atmosphere on Consumers’ Impulse-Buying Behaviour from the Perspective of Human-Computer Interaction. Sustainability, 14(12), 1–21. https://doi.org/10.3390/su14127110.
[23] Xu, Y., and Huang, J. S. (2014). Effects of price discounts and bonus packs on online impulse buying. Social Behavior and Personality, 42(8), 1293–1302. https://doi.org/10.2224/sbp.2014.42.8.1293.
[24] Le, T. Q., Wu, W. Y., Liao, Y. K., and Phung, T. T. T. (2022). The Extended S-O-R Model Investigating Consumer Impulse Buying Behavior in Online Shopping: A Meta-Analysis. Journal of Distribution Science, 20(2), 1–9. https://doi.org/10.15722/jds.20.02.202202.1.
[25] Lee, M. Y., Kim, Y. K., and Fairhurst, A. (2009). Shopping value in online auctions: Their antecedents and outcomes. Journal of Retailing and Consumer Services, 16(1), 75–82. https://doi.org/10.1016/j.jretconser.2008.11.003.
[26] Zhu, D. H., Wang, Y. W., and Chang, Y. P. (2018). The influence of online cross-recommendation on consumers’ instant cross-buying intention: The moderating role of decision-making difficulty. Internet Research, 28(3), 604–622. https://doi.org/10.1108/IntR-05-2017-0211.
[27] Lepkowska-White, E. (2004). Online Store Perceptions: How to Turn Browsers into Buyers? Journal of Marketing Theory and Practice, 12(3), 36–47. https://doi.org/10.1080/10696679.2004.11658523.
[28] Lee, C. H., and Chen, C. W. (2021). Impulse buying behaviors in live streaming commerce based on the stimulus-organism-response framework. Information, 12(6), 1–17. https://doi.org/10.3390/info12060241.
[29] Orangzab, Hussain, I., and Sajiid, M. (2021). Impact of Online Promotional Techniques on Online Impulse Buying Behavior: Strategies and Innovations for Consumer Products Through OCEAN Model. Bulletin of Business and Economics, 10(4), 1–12. Retrieved from https://bbejournal.com/index.php/BBE/article/view/81.
[30] Mohan, G., Sivakumaran, B., and Sharma, P. (2013). Impact of store environment on impulse buying behavior. European Journal of Marketing, 47(10), 1711–1732. https://doi.org/10.1108/EJM-03-2011-0110.
[31] Ingham, J., Cadieux, J., and Mekki Berrada, A. (2015). E-Shopping acceptance: A qualitative and meta-analytic review. Information and Management, 52(1), 44–60. https://doi.org/10.1016/j.im.2014.10.002.
[32] Davis, F. D. (1989). Perceived Usefulness, Perceived Ease of Use, and User Acceptance of Information Technology. MIS Quarterly, 13(3), 319–340. https://doi.org/10.5962/bhl.title.33621.
[33] Chen, T. Y., Yeh, T. L., and Lo, W. C. (2017). Impacts on Online Impulse Purchase through Perceived Cognition. Journal of International Consumer Marketing, 29(5), 319–330. https://doi.org/10.1080/08961530.2017.1367208.
[34] Zheng, X., Men, J., Yang, F., and Gong, X. (2019). Understanding impulse buying in mobile commerce: An investigation into hedonic and utilitarian browsing. International Journal of Information Management, 48(February), 151–160. https://doi.org/10.1016/j.ijinfomgt.2019.02.010.
[35] Fornell, C., and Larcker, D. F. (1981). Evaluating Structural Equation Models with Unobservable Variables and Measurement Error. Journal of Marketing Research, 18(1), 39–50.
[36] Sarstedt, M., Ringle, C. M., and Joseph F. Hair. (2017). Partial least squares structural equation modeling (PLS-SEM). Handbook of Market Research. Springer International Publishing. https://doi.org/10.1108/EBR-10-2013-0128.
[37] Chin, W. W. (1998). The partial least squares approach to structural equation modeling. In G. A. Macoulides (Ed.), Modern Methods for Business Research (pp. 295–336). Mahwah, NJ: Lawrence Erlbaum Associates.
[38] Henseler, J., Hubona, G., and Ray, P. A. (2016). Using PLS path modeling in new technology research: Updated guidelines. Industrial Management and Data Systems, 116(1), 2–20. https://doi.org/10.1108/IMDS-09-2015-0382.
[39] Lohmoller, J.-B. (1989). Latent Variable Path Modeling with Partial Least Squares. Berlin,: Springer-Verlag Berlin Heidelberg. https://doi.org/10.1007/978-3-642-52512-4.
[40] Loiacono, E. T., Watson, R. T., and Goodhue, D. L. (2007). WebQual: An instrument for consumer evaluation of web sites. International Journal of Electronic Commerce, 11(3), 51–87. https://doi.org/10.2753/JEC1086-4415110302.
Biography

Dam Tri Cuong received his Ph.D. degree in management from University of Economics Ho Chi Minh City in 2017. He is currently working as a head of strategic management division at Industrial University of Ho Chi Minh City. His research areas include data analysis, optimal model analysis, consumer behavior, and brand management analysis.
Journal of ICT Standardization, Vol. 11_3, 217–236.
doi: 10.13052/jicts2245-800X.1131
© 2023 River Publishers