Comparison of Different Machine Learning Algorithms in the Mental Health Assessment of College Students
Yongsen Cai*, Danling Lin and Qing Lu
School of Safety & Management, Zhejiang College of Security Technology, Wenzhou, 325200, China
E-mail: yscaiys@outlook.com
*Corresponding Author
Received 15 September 2024; Accepted 20 November 2024
Abstract
This paper assesses college students’ mental health based on the symptom checklist 90 (SCL-90). In view of the assessment data processing and analysis, the performance of different machine learning algorithms, including random forest (RF), LightGBM3, extreme gradient boosting (XGBoost), in the classification of college students’ mental health samples was compared. Moreover, the effect of different hyperparameter optimization methods (grid search, Bayesian optimization, and particle swarm optimization) was compared. The experiment on the SCL-90 assessment dataset found that the optimization effect of grid search was poor, and the highest F1 value and area under the curve (AUC) of the RF algorithm were 0.8914 and 0.9384, respectively, the highest F1 and AUC values of the XGBoost algorithm were 0.9166 and 0.9551, respectively. The LightGBM algorithm optimized by particle swarm optimization showed the best performance in the classification of mental health samples, with an F1 value of 0.9790 and an AUC of 0.9945. It also achieved optimal results when compared to machine learning algorithms such as naive Bayes and the support vector machines. The results prove the reliability and accuracy of the particle swarm optimization-improved LightGBM algorithm in the analysis of college students’ mental health assessment data. The algorithm can be applied in practice to provide an effective tool for the analysis of the mental health assessment data of college students.
Keywords: Machine learning, college student, mental health assessment, LightGBM.
1 Introduction
Mental health is extremely important in every stage of life [1]. The mental health of college students can affect the quality of education in school [2], which has very important practical values for the research of college students’ mental health assessment. Under the influence of progress and social changes, the frequency of poor mental health among college students is increasing [3]. While living a gradually independent life, college students are also facing pressure from study, employment, and interpersonal communication [4]. When facing difficulties and challenges, they lack the ability to bear poor mental health and solve problems. Therefore, anxiety, depression, and other psychological emotions are more and more common among college students. All universities and colleges pay more and more attention to mental health education [5] and carry out mental health surveys from time to time in order to detect students with mental health problems as early as possible and intervene. As machine learning develops, many methods have been applied in mental health research [6]. Purwandari et al. [7] predicted students’ Internet addiction and mental health based on their Internet browsing history and found that the prediction accuracy of gradient boosting and support vector machines was higher than random forest (RF). Laijawala et al. [8] collected data from datasets available on the Internet and realized the application of algorithms such as RF, naive Bayes, and decision tree in mental health prediction. Chao et al. [9] classified the mental health state of college students as normal, negative, and positive based on electroencephalography signals and then realized classification based on a convolutional neural network. The experiment found that the method achieved an accuracy of 97.54% and an F1 value of 98.35%. Ali et al. [10] classified six kinds of mental health problems based on data from Facebook status updates and compared the effects of different classifiers. The experiment found that RF had a good effect. Chen et al. [11] found through a simple linear regression that parents’ solid self and stress levels are correlated with the severity of children’s mental health symptoms, further emphasizing the importance of promoting individual treatment or psychological education for parents. Nanda et al. [12] investigated 600 students from an Indian university and used k-means clustering to divide them into a high mental stress group and a low mental stress group, providing a new method for exploring students’ levels of mental stress. Shobhika et al. [13] used methods such as decision trees and random forests to predict mental health disorders such as stress and anxiety and found that the support vector machine (SVM) algorithm exhibited the highest accuracy among all algorithms. Currently, the research on applying machine learning methods to the assessment of college students’ mental health mainly focuses on individual methods and seldom involves comparative studies of different machine learning algorithms. Therefore, aiming at the mental health assessment of college students, this article compared the effects of different machine learning algorithms based on the data of symptom checklist 90 (SCL-90) to further understand the usability of various machine learning methods in mental health assessment research and provide a more effective and reliable analysis method for the timely counsel and intervention of students with abnormal mental health.
2 Mental Health Assessment of College Students
2.1 Analysis of College Students’ Mental Health
When college students have an optimistic and positive mindset, the courage to face problems and challenges with a proactive attitude, and the ability to solve problems, they can adapt quickly even in changing environments, and keep a positive and healthy state of mind in all aspects of their activities; they have good mental health. The mental health problems of college students can be affected by many aspects.
(1) Family: Family is a very important part of personal development. Parents’ divorce and parents working away from home may affect college students’ mental health [14], resulting in sensitivity, isolation, and other emotions.
(2) School: Compared with previous school life, college life has more freedom, but also poses more challenges. In addition to academic anxiety, there is more pressure in interpersonal communication. In addition, the pressure of future employment is also a very important part [15].
(3) Personal: Under the rapid change of environment, college students’ self-cognition may also change. In addition, college students are also faced with emotional problems. When confronted with intricate and challenging emotional issues, individuals tend to experience more significant variations in their emotions.
2.2 College Students’ Mental Health Assessment
SCL-90 is a scale that can analyze the mental health problems of the subjects from multiple perspectives and is widely used in school, military, medical and health care, and other scenarios [16]. It adopts the self-assessment method. The scale contains 90 questions, and the score of each question is 1–5 points, 1 none, 2 mild, 3 moderate, 4 severe, and 5 very severe. The scale contains a total of ten factors, as detailed in Table 1.
Table 1 SCL-90
| Factor | Content | Question Item |
| Somatization | Subjective sensations in the body, such as difficulty breathing, weakness in limbs, etc. | 1, 4, 12, 27, 40, 42, 48, 49, 52, 53, 56, 58 |
| Force | Pointless behavior that one cannot get rid of | 3, 9, 10, 28, 38, 45, 46, 51, 55, 65 |
| Interpersonal sensitivity | Low self-esteem and sensitivity in dealing with others | 6, 21, 34, 36, 37, 41, 61, 69, 73 |
| Depression | A lack of confidence and energy, and depression | 5, 14, 15, 20, 22, 26, 29, 30, 31, 32, 54, 71, 79 |
| Anxiety | Uncontrollable nervousness and ethereal emotions | 2, 17, 23, 33, 39, 57, 72, 78, 80, 86 |
| Hostiles | An unfriendly and pessimistic attitude toward things | 11, 24, 63, 67, 74, 81 |
| Horror | Insecurity and constant panic | 13, 25, 47, 50, 70, 75, 82 |
| Paranoid | Excessive ego, suspicion, etc. | 8, 18, 43, 68, 76, 83 |
| Psychosis | Emotional withdrawal, relaxed thinking, decreased social functioning, etc. | 7, 16, 35, 62, 77, 84, 85, 87, 88, 90 |
| Other | Reflect on sleeping and eating | 19, 44, 59, 60, 64, 66, 89 |
Questionnaires were distributed online to students in Zhejiang College of Security Technology, and 2017 replies were obtained. Referring to the norm, a student was determined to have mental problems if they had one of the following situations:
(1) A total score 160 points
(2) An average score of any factor 2 points
(3) A number of positive items 43.
Then, the same professional mental health educator screened the samples again. Finally, the sample with mental health problems was denoted as “abnormal” and marked as “1”, and the sample without mental health problems was denoted as “normal” and marked as “0”. They were used for subsequent assessment data analysis based on machine learning algorithms. After marking, there were 216 abnormal samples and 1801 normal samples.
For the SCL-90 used in this paper, the reliability and validity tests were carried out by SPSS software [17], and the results are displayed in Tables 2 and 3.
Table 2 Reliability test results
| Factor | Cronbach’s | Standardized Cronbach’s |
| Somatization | 0.912 | 0.914 |
| Compulsion | 0.889 | 0.901 |
| Interpersonal sensitivity | 0.885 | 0.886 |
| Depression | 0.916 | 0.917 |
| Anxiety | 0.942 | 0.845 |
| Hostile | 0.863 | 0.865 |
| Horror | 0.845 | 0.845 |
| Paranoid | 0.829 | 0.831 |
| Psychosis | 0.915 | 0.916 |
| Other | 0.912 | 0.913 |
| Total | 0.986 | 0.987 |
Table 3 Validity test results
| Factor | Kaiser–Meyer–Olkin Value | Bartlett Sphericity Test Significance |
| Somatization | 0.945 | 0.000 |
| Compulsion | 0.932 | 0.000 |
| Interpersonal sensitivity | 0.925 | 0.000 |
| Depression | 0.915 | 0.000 |
| Anxiety | 0.962 | 0.000 |
| Hostile | 0.932 | 0.000 |
| Horror | 0.942 | 0.000 |
| Paranoid | 0.894 | 0.000 |
| Psychosis | 0.897 | 0.000 |
| Other | 0.886 | 0.000 |
| Total | 0.937 | 0.000 |
As can be seen from Tables 2 and 3, the of all factors was above 0.8, the of the total scale was 0.986, the Kaiser–Meyer–Olkin value of all factors was above 0.9, and there were significant correlations, indicating that SCL-90 had strong reliability and validity and the questionnaire results were valid.
2.3 Analysis of SCL-90 Assessment Data
The SCL-90 assessment data was analyzed, and the number of students with an average score of each factor 2 points is shown in Figure 1.
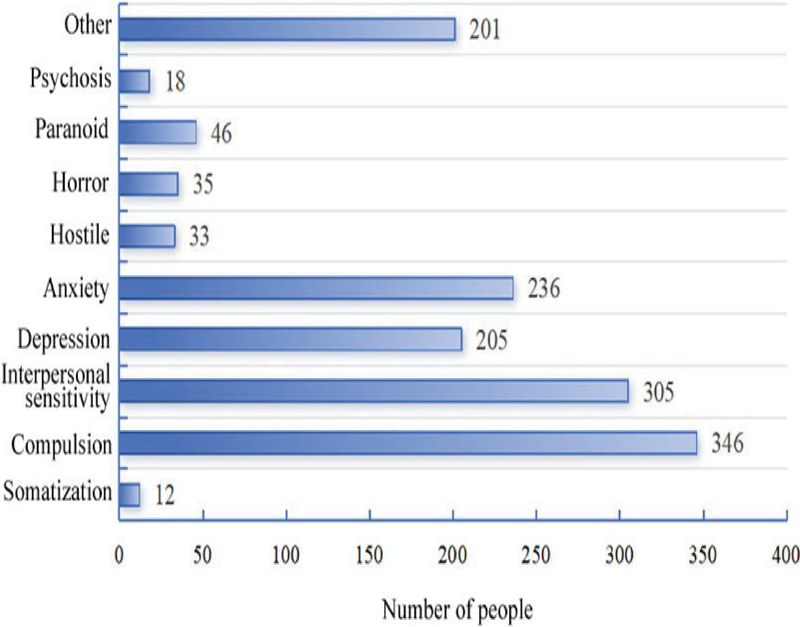
Figure 1 The number of students with an average score of each factor 2 points.
It can be found that the number of students who scored 2 points for the “compulsion” factor was the largest, reaching 346, followed by the “interpersonal sensitivity” factor, reaching 305, the next was the “anxiety” factor, reaching 236, and the number of people who scored 2 points for the “depression” and “other” factors was more than 200. As can be seen from the assessment data in Figure 1, the main psychological problems of the university students were compulsion, interpersonal relationships, and anxiety.
3 Different Machine Learning Algorithms
For the assessment results, this paper used different machine learning methods to judge whether college students have abnormal mental health based on the scores of various factors included in SCL-90. The compared machine learning algorithms are as follows.
(1) RF: RF is a binary classifier, which is not affected by multiple variables and exhibits good stability for incomplete or unbalanced data. Therefore, it is widely used in various classification problems [18]. The steps are as follows.
(a) Based on the Bootstrap method, datasets are obtained by sampling with replacement.
(b) If there are attributes, attributes are randomly extracted from each node of each tree, and then one attribute was selected these attributes as the splitting attribute of this node to generate a decision tree (without pruning).
(c) Multiple decision trees are generated according to the above steps. An RF model is established using these trees. The final classification results are determined according to the number of votes.
(2) XGBoost: Extreme gradient boosting (XGBoost) is an improvement on the conventional gradient boosting decision tree (GBDT) algorithm [19] and has significantly optimized performance. It fuses several weak classifiers to get strong classifiers based on the boosting algorithm. It has good applications in data classification and prediction in various fields [20]. It is assumed that there are samples in dataset and features, the XGBoost algorithm adds the predicted value of each tree as the final predicted value, which is defined as:
| (1) |
where represents the th tree model and is the number of trees. When learning, the objective function of the XGBoost algorithm is written as:
| (2) | |
| (3) |
where is the score of leaf nodes of each tree, is the number of leaf nodes, and are regular term coefficients.
(3) LightGBM: LightGBM is also an algorithm based on GBDT [21]. Its idea is to put the eigenvalues into discrete boxes and traverse through discrete values during training. In addition, LightGBM uses the following two strategies [22].
(a) Gradient-based one-side sampling (GOSS): Firstly, the gradients of the training samples are sorted in absolute descending order. The top samples form a large gradient dataset called , and the remaining samples constitute a small gradient dataset called . Then, information gain is calculated:
| (4) | |
| (5) | |
| (6) |
where is the segmentation point of feature and is the negative gradient direction of loss function.
(b) Exclusive feature bundling (EFB): EFB is a method based on graph theory, and its specific steps are as follows.
Based on the relationship between features, a weighted undirected graph is established. The edges between vertices are used as the relationship of features, and the weights of edges are used as the conflicting values between features.
According to the number of edges and the conflicting values, the degree of the features is obtained and arranged in descending order.
According to the sorted features, the incompletely exclusive features are bundled to achieve feature dimension reduction.
The above three machine learning algorithms all contain hyperparameters that need to be set. In this paper, the following hyperparameter optimization methods are compared.
(1) Grid search (GS) [23]: Suppose there are hyperparameters, and the h hyperparameter can take values, then the parameter combinations that can be obtained are . The principle of GS is to traverse all the combinations to find the best one.
(2) Bayesian optimization (BO) [24]
(a) The search range is determined, and then a group of parameters is randomly selected within this range.
(b) The objective function is evaluated according to these parameter. The optimal parameters during this round of iteration are calculated and added to the initial set.
(c) The model is updated continuously until the termination condition is reached. Finally, the optimal parameter combination is satisfied.
(3) Particle swarm optimization (PSO): PSO, a meta-heuristic algorithm [25], has excellent performance in solving complex and high-dimensional problems [26] and has the advantages of few parameters and simple calculation [27]. Suppose there are particles in a -dimensional space. In the th iteration, the position and velocity of the particle are written as and , respectively. The best position of particle is . The global best position is . The particle is updated:
| (7) | |
| (8) |
where is the weight, is the search direction, and are learning factors, and and are random numbers in (0,1).
4 Results and Analysis
4.1 Experimental Setup
The data from the 2017 replies were collected and divided into training and test samples according to 7:3. There were 1412 samples in the training set, but there were only 151 abnormal samples and 1261 normal samples in this set. Therefore, the synthetic minority oversampling technique (SMOTE) algorithm [28] was employed to balance the data. Finally, both the number of abnormal samples and normal samples was 716.
The hyperparameter search range of different algorithms was set as shown in Table 4.
Table 4 Hyperparameter search scope
| Hyperparameter | Meaning of | Search | |
| Name | Hyperparameter | Range | |
| RF | max_depth | Maximum depth | [5,50] |
| max_features | Maximum number of features | [1,20] | |
| n_estimators | Number of trees | [50,300] | |
| XGBoost | max_depth | Maximum depth | [1,10] |
| reg_alpha | L1 regularization term on the weight | [0,1] | |
| reg_lambda | L2 regularization term on the weight | [0,1] | |
| min_child_weight | The minimum sum of instance weight needed in the subitem | 1–5 | |
| n_estimators | Number of trees | [100,500] | |
| learning_rate | Learning rate | [0.001,0.5] | |
| LightGBM | max_depth | Maximum depth | [1,10] |
| num_leaves | Number of leaf nodes | [20,25] | |
| min_child_weight | The minimum sum of instance weight needed in the subitem | [0.0001,1] | |
| learning_rate | Learning rate | [0.001,0.5] | |
| reg_alpha | L1 regularization term on the weight | [0,1] | |
| reg_lambda | L2 regularization term on the weight | [0,1] | |
| n_estimators | Number of trees | [100,800] |
The classification performance of different machine learning algorithms on the SCL-90 mental health assessment dataset was evaluated based on the following indicators.
(1) Precision: The proportion of correctly classified samples in the positive category:
| (9) |
where is the number of samples that are classified as normal and are actually normal and is the number of samples that are classified as normal but actually abnormal.
(2) Recall rate: The proportion of samples classified as positive out of all positive samples:
| (10) |
where refers to the number of samples classified as abnormal that are actually normal.
(3) F1 value: This reflects the balance of precision and recall rate:
| (11) |
(4) AUC [29]: The area between the X axis and the receiver operator characteristic (ROC) curve. The closer the value is to 1, the better the classification performance.
4.2 Comparison of Results
Table 5 presents the performance of the RF algorithm in classifying normal and abnormal mental health samples under different hyperparameter optimization methods.
Table 5 Classification performance of the RF algorithm under different hyperparameter optimizations
| Precision | Recall Rate | F1 | AUC | |
| GS | 0.8224 | 0.8526 | 0.8372 | 0.8864 |
| BO | 0.8756 | 0.9077 | 0.8914 | 0.9384 |
| PSO | 0.8684 | 0.9125 | 0.8899 | 0.9321 |
From Table 5 it can be found that the RF algorithm optimized by CS exhibited a poor classification effect on mental health samples, with the P value, R value, and F1 value all below 0.9, and the AUC value was 0.8864. Among the three optimization methods, BO obtained the highest P value, reaching 0.8756, and PSO obtained the highest R value, reaching 0.9125. Finally, from the perspective of overall classification performance, BO was the most effective for RF hyperparameter optimization as it obtained an F1 value of 0.8914 and an AUC value of 0.9384.
Table 6 presents the performance of the XGBoost algorithm in classifying normal and abnormal mental health samples under different hyperparameter optimization methods.
Table 6 Classification performance of the XGBoost algorithm under different hyperparameter optimizations
| Precision | Recall rate | F1 | AUC | |
| GS | 0.8833 | 0.9007 | 0.8919 | 0.9301 |
| BO | 0.9112 | 0.9156 | 0.9134 | 0.9551 |
| PSO | 0.9107 | 0.9225 | 0.9166 | 0.9446 |
It can be seen that, similar to the RF algorithm, GS also performed poorly in optimizing XGBoost parameters, with an AUC value of 0.9301. Moreover, the optimal P value (0.9107) and the optimal AUC value (0.9551) of the XGBoost algorithm optimized by BO were obtained, while the algorithm optimized by PSO had the best performance on the R value and F1 value, which were 0.9225 and 0.9166 respectively. These results indicated that both BO and PSO had a good optimization effect on the XGBoost parameters and could help it show better classification performance for mental health samples.
The performance of the LightGBM algorithm in classifying normal and abnormal mental health samples under different hyperparameter optimization methods is presented in Table 7.
Table 7 Classification performance of the LightGBM algorithm under different hyperparameter optimizations
| Precision | Recall rate | F1 | AUC | |
| GS | 0.9227 | 0.9356 | 0.9291 | 0.9712 |
| BO | 0.9533 | 0.9987 | 0.9755 | 0.9883 |
| PSO | 0.9624 | 0.9962 | 0.9790 | 0.9945 |
From Table 7 it can be seen that the optimization effect of GS on the LightGBM algorithm was also poor. The P value obtained by the BO-optimized LightGBM algorithm was 0.9533, the R value was the highest (0.9987), the F1 value was 0.9755, and the AUC was 0.9883. The PSO-optimized LightGBM algorithm showed the best effect on the classification of mental health samples, with the highest P value of 0.9624, an R value of 0.9960, and the highest F1 and AUC values of 0.9790 and 0.9945.
As can be seen from Tables 5–7, when classifying mental health samples in the SCL-90 assessment dataset, the PSO-optimized LightGBM algorithm showed the best performance, with an F1 value of 0.9760 and an AUC of 0.9945, which can classify abnormal mental health samples.
To further demonstrate the performance of LightGBM optimized by PSO in sample classification, it is compared with some other machine learning algorithms currently available, including the logistic regression (LR) algorithm [30], the naive Bayesian (NB) algorithm [31], the K-nearest neighbor (KNN) algorithm [32], the support vector machine (SVM) algorithm [33], and the decision tree (DT) algorithm [34].
Table 8 Comparison with other machine learning algorithms
| Precision | Recall Rate | F1 | AUC | |
| LR | 0.8512 | 0.8734 | 0.8622 | 0.8852 |
| NB | 0.8667 | 0.8932 | 0.8798 | 0.8964 |
| KNN | 0.8712 | 0.9045 | 0.8875 | 0.9085 |
| SVM | 0.8794 | 0.9118 | 0.8953 | 0.9174 |
| DT | 0.8812 | 0.9213 | 0.9008 | 0.9233 |
| PSO-LightGBM | 0.9624 | 0.9962 | 0.9790 | 0.9945 |
From Table 8 it can be observed that the LR algorithm performed poorly in classifying the mental health samples, with an F1 score of only 0.8622 and an AUC value of 0.8852, indicating its unsatisfactory classification effect. Furthermore, several other machine learning methods such as NB had P values below 0.9. In terms of the F1 value, only the DT algorithm achieved a F1 value of 0.9008 while others were below 0.9. Moreover, the P, R, F1, and AUC values of the PSO-optimized LightGBM algorithm were above 0.95 in classifying mental health samples, surpassing other machine learning algorithms and further confirming its effectiveness.
5 Discussion
Machine learning algorithms have been extensively studied in the classification and prediction of mental health problems [15]. This study used machine learning algorithms to classify normal and abnormal samples of college students’ mental health based on the SCL-90 data and compared three machine learning algorithms: RF, XGBoost, and LightGBM.
It can be observed that different hyperparameter optimization methods exhibited varying effects on the RF, XGBoost, and LightGBM algorithms. The RF algorithm optimized using BO achieved an F1 value of 0.8914, outperforming the results obtained from GS and PSO. Both BO and PSO yielded good results when they were used as hyperparameter optimization methods for the XGBoost algorithm. However, when it comes to the LightGBM algorithm, PSO produced the best result with an F1 value of 0.9790 and an AUC value of 0.9945, surpassing the optimal values obtained from the RF and XGBoost algorithms. Based on these findings, it was found that different hyperparameter optimization methods exhibited varying performance for different machine learning algorithms; therefore, experimental validation is necessary to determine the most suitable method for each case. Moreover, comparisons of the RF, XGBoost, and LightGBM algorithms revealed that the LightGBM algorithm performed best in classifying mental health samples and can be applied effectively in practice.
Comparisons with other machine learning algorithms showed that the LightGBM algorithm optimized by PSO achieved optimal results, with all indicators above 0.95. Based on this result, it is feasible to apply the PSO-optimized LightGBM algorithm in the classification of mental health samples, and results better than general machine learning algorithms can be obtained.
6 Conclusion
Machine learning methods have extensive applications in data processing. To understand the usability of various machine learning methods in college students’ mental health assessment, this paper collected the mental health assessment data from college students using the SCL-90 and then compared the performance of different machine learning algorithms in classifying mental health samples under different hyperparameter optimizations. The experiment found that GS performed poorly in the hyperparameter optimization of machine learning algorithms, and BP and PSO both had better optimization performance for the XGBoost algorithm. In the hyperparameter optimization of the LightGBM algorithm, PSO exhibited the best performance. Overall, the PSO-optimized LightGBM algorithm had the best effect on the classification of college students’ mental health samples, with an F1 value reaching 0.9790 and an AUC reaching 0.9945. The algorithm can be applied in practical mental health education work in colleges.
References
[1] R. Patt, D. Meva, ‘Advancements in Machine Learning-Based Mental Health Prediction: A Comprehensive Review’, International Conference on Cognitive Computing and Cyber Physical Systems, pp. 497–507, 2024.
[2] H. Liu, J. Xu, ‘Research on the Use of Neural Network for the Prediction of College Students’ Mental Health’, Sci. Program., 2022, pp. 1-8, 2022.
[3] X. Wang, ‘Research on Mental Health Education for College Students’, Int. J. Soc. Sci. Educ. Res., 3(3), pp. 153–157, 2020.
[4] X. L. Mao, H. M. Chen, ‘Investigation of contemporary college students’mental health status and construction of a risk prediction model’, World J. Psychiatr., 13(8), pp. 573–582, 2023.
[5] Y. Tang, J. Su, ‘Prediction and analysis of College Students’ mental health based on BP neural network’, J. Intell. Fuzzy Syst., pp. 1–7, 2020.
[6] S. Liao, Q. Zhang, R. Gan, ‘Construction of real-time mental health early warning system based on machine learning’, J. Phys.: Conf. Ser., 1812(1), pp. 1–7, 2021.
[7] B. Purwandari, W. S. Wibawa, N. Fitriah, M. Christia, D. R. Bintari, ‘Internet Addiction and Mental Health Prediction Using Ensemble Learning Based on Web Browsing History’, ICSIM ’20: The 3rd International Conference on Software Engineering and Information Management, pp. 155–159, 2020.
[8] V. Laijawala, A. Aachaliya, H. Jatta, V. Pinjarkar, ‘Classification Algorithms based Mental Health Prediction using Data Mining’, 2020 5th International Conference on Communication and Electronics Systems (ICCES), Coimbatore, India, pp. 1174–1178, 2020.
[9] C. Du, C. Liu, P. Balamurugan, P. Selvaraj, ‘Deep Learning-based Mental Health Monitoring Scheme for College Students Using Convolutional Neural Network’, Int. J. Artif. Intell. T., (6/8), pp. 30, 2021.
[10] M. Ali, A. Baqir, H. H. R. Sherazi, A. Hussain, A. H. Alshehri, M. A. Imran, ‘Machine Learning Based Psychotic Behaviors Prediction from Facebook Status Updates’, Comput. Mater. Con., (008), pp. 2411–2427, 2022.
[11] W. Chen, R. Bokoch, ‘The Impact of Parental Solid Self, Treatment Involvement, Stress, and Parenting Styles on Children’s Mental Health Symptom Severity’, J. Child Fam. Stud., 33(9), pp. 2919–2932, 2024.
[12] A. Nanda, S. Tuteja, S. Gupta, ‘Machine learning based analysis and prediction of college students’ mental health during COVID-19 in India’, Artif. Intell. Mach. Learn. Mental Health Pandem., pp. 167–187, 2022.
[13] Shobhika, P. Kumar, S. Chandra, ‘Prediction and comparison of psychological health during COVID-19 among Indian population and Rajyoga meditators using machine learning algorithms’, Proc. Comput. Sci., 218, pp. 697–705, 2023.
[14] V. Azzi, K. Iskandar, S. Obeid, S. Hallit, ‘Parental divorce and smoking dependence in Lebanese adolescents: the mediating effect of mental health problems’, BMC Pediatr., 22(1), pp. 1–9, 2022.
[15] Y.T. Zhang, T. Huang, F. Zhou, A. D. Huang, X. Q. Ji, L. He, Q. Geng, J. Wang, C, Mei, Y. J. Xu, Z. L. Yang, J. B. Zhan, J. Cheng, ‘Correlation between Anxiety, Depression,and Sleep Quality in College Students’, Biomed. Environ. Sci., 35(7), pp. 648–651, 2022.
[16] X. Li, W. Song, J. Y. Zhang, C. Lu, Y. X. Wang, Y. X. Zheng, W. N. Hao, ‘Factors associated with mental health of graduate nursing students in China’, Medicine, 100(3), pp. 1–6, 2021.
[17] Z. S. Musihb, H. S. A. Hussein, A. M. A. Ali, ‘Disruption of sleep patterns among secondary school adolescents’, J. Integr. Nurs., 6(3), pp. 145–149, 2024.
[18] J. Liu, Q. Y. Xu, W. S. Chen, ‘Classification of Bird and Drone Targets Based on Motion Characteristics and Random Forest Model Using Surveillance Radar Data’, IEEE Access, 9, pp. 160135–160144, 2021.
[19] S. Smadi, O. Almomani, A. Saaidah, A. H. Mohammad, M. Alauthman, ‘VPN Encrypted Traffic classification using XGBoost’, Int. J. Adv. Trends Comput. Sci. Eng., 9(7), pp. 960, 2021.
[20] R. S. Mohril, B. S. Solanki, M. S. Kulkarni, B. K. Lad, ‘XGBoost based residual life prediction in the presence of human error in maintenance,’ Neural Comput. Appl., 35(4), pp. 3025–3039, 2023.
[21] V. A. Dev, M. R. Eden, ‘Formation lithology classification using scalable gradient boosted decision trees’, Comput. Chem. Eng., 128, pp. 392–404, 2019.
[22] M. H. Abdurrahman, B. Irawan, C. Setianingsih, ‘A Review of Light Gradient Boosting Machine Method for Hate Speech Classification on Twitter’, 2020 2nd International Conference on Electrical, Control and Instrumentation Engineering (ICECIE), Kuala Lumpur, Malaysia, pp. 1–6, 2020.
[23] D. Wang, X. Ban, L. Ji, X. Guan, K. Liu, X. Qian, ‘An Adaptive Shrinking Grid Search Chaotic Wolf Optimization Algorithm Using Standard Deviation Updating Amount’, Comput. Intel. Neurosc., 2020(11), pp. 1–15, 2020.
[24] Y. Yang, C. Ji, K. Deng, ‘Rapid design of metamaterials via multitarget bayesian optimization’, Ann. Appl. Stat., 15(2), pp. 768–796, 2021.
[25] P. B. Kumar, D. R. Parhi, C. Sahu, ‘An approach to optimize the path of humanoid robots using a hybridized regression-adaptive particle swarm optimization-adaptive ant colony optimization method’, Ind. Robot, 46(1), pp. 104–117, 2019.
[26] X. F. Song, Y. Zhang, Y. N. Guo, X. Y. Sun, Y. L. Wang, ‘Variable-size Cooperative Coevolutionary Particle Swarm Optimization for Feature Selection on High-dimensional Data’, IEEE T. Evolut. Comput., 24(5), pp. 882–895, 2020.
[27] X. W. Zhang, H. Liu, T. Zhang, Q. Wang, Y. Wang, L. Tu, ‘Terminal crossover and steering-based particle swarm optimization algorithm with disturbance’, Appl. Soft Comput., 85, pp. 1–21, 2019.
[28] A. Ishaq, S. Sadiq, M. Umer, S. Ullah, S. Mirjalili, V. Rupapara, M. Nappi, ‘Improving the Prediction of Heart Failure Patients’ Survival Using SMOTE and Effective Data Mining Techniques’, IEEE Access, 9, pp. 39707–39716, 2021.
[29] J. Y. Verbakel, E. W. Steyerberg, H. Uno, B. D. Cock, L. Wynants, G. S. Collins, B. V. Calster, ‘ROC curves for clinical prediction models part 1. ROC plots showed no added value above the AUC when evaluating the performance of clinical prediction models (vol 126, pg 207, 2020)’, J. Clin. Epidemiol., 130, pp. 171–173, 2021.
[30] A. T. Nahini, M. D. Baranon, C. Ayena, A. M. Soglo, E. N. Sambieni, M. A. Sanni, ‘Multidimensional and Logistic Regression Analysis of Unmet Family Planning Needs among Women of Childbearing Age in Donga Department, Benin’, Open Access Library J., 11(9), pp. 1–18, 2024.
[31] S. S. Prasetiyowati, Y. Sibaroni, ‘Unlocking the potential of Naive Bayes for spatio temporal classification: a novel approach to feature expansion,’ J. Big Data, 11(1), pp. 1–27, 2024.
[32] A. Z. Khameneh, M. Ghaznavi, A. Kilicman, Z. Mahad, A. Mardani, ‘A maximal-clique-based clustering approach for multi-observer multi-view data by using k-nearest neighbor with S-pseudo-ultrametric induced by a fuzzy similarity’, Neural Comput. Appl., 36(16), pp. 9525–9550, 2024.
[33] J. S. Bobby, B. S. C. Kapali, U. S. Kumar, M. A. Femina, ‘QCBO-WSVM: Quantum chaos butterfly optimization-based weighted support vector machine for neuropathic pain detection from EEG signal’, Int. J. Imag. Syst. Tech., 33(5), pp. 1606–1620, 2023.
[34] B. Sindhusaranya, M. R. Geetha, ‘Retinal blood vessel segmentation using root Guided decision tree assisted enhanced Fuzzy C-mean clustering for disease identification’, Biomedical Signal Processing and Control, 82, pp. 1–10, 2023.
[35] B. Bailey, D. R. Strunk, ‘Predicting anxiety and depression over 12 months of the COVID-19 pandemic: A machine learning study’, J. Clin. Psychol., 79(10), pp. 2388–2403, 2023.
Biographies

Yongsen Cai is an associate professor at Zhejiang College of Security Technology. He graduated from University of Electronic Science and Technology of China with a Master’s degree. His research interests include ideological and political education, educational management, and mental health education for college students.

Danling Lin is a research associate at Zhejiang College of Security Technology. She graduated from Zhejiang University and is a PhD candidate at Zhejiang Normal University. Her research directions are ideological and political education, educational management, mental health education for college students, and family education.

Qing Lu is a lecturer at Zhejiang College of Security Technology. She holds a Master’s degree. Her research interests include ideological and political education for college students, higher vocational education management, and mental health education for college students.
Journal of ICT Standardization, Vol. 12_4, 409–428.
doi: 10.13052/jicts2245-800X.1243
© 2025 River Publishers