Risk Warning and Decision Support Model for Shield Tunneling Construction in Urban Rail Transit
Wenfeng Cao1,* and Lijun Shi2
1School of Horticulture and Landscape Architecture, Fujian Vocational College of Agriculture, Fuzhou Fujian, 353000, China
2High-speed Railway Technology (Hunan) Co., Ltd, Changsha Hunan, 410000, China
E-mail: fujiancwf0516@163.com; cao_wenfe@outlook.com
*Corresponding Author
Received 20 June 2025; Accepted 05 January 2026
Abstract
Risks occur due to variable geological conditions and urban constraints. Inadequate risk identification and management in shield tunneling can result in safety hazards, schedule overruns, and increased project costs, necessitating an effective risk assessment and decision-making framework. This research aims to develop a comprehensive risk warning and decision support model to facilitate early risk detection and informed mitigation strategies during shield tunneling construction in urban rail transit projects. The dataset includes geotechnical conditions, tunneling parameters, environmental factors, operational records, and safety monitoring data. Data sources include multi-sensors, and project logs, enabling comprehensive risk analysis and modeling. These multi-sensor inputs include cutterhead torque sensors, thrust force sensors, slurry pressure sensors, vibration and displacement sensors, as well as ground settlement monitoring instruments. The project logs consist of TBM operational logs, geotechnical investigation records, and safety monitoring logs documenting environmental and structural conditions during tunneling. To ensure data quality, pre-processing methods including Interquartile Range (IQR) for outlier detection and mean imputation for missing values are applied. Predictive risk modeling was conducted using Regularized Random Forest (RRF). Risk thresholds were established in accordance with model outputs and relevant safety standards to enable proactive early warning alerts. The decision support module leverages Proximal Policy Optimization (PPO) to recommend adaptive mitigation actions, such as tunneling parameter adjustments and structural reinforcements. Additionally, it facilitates forecasting of potential outcomes, providing dynamic, real-time feedback to the construction management team for rapid operational response. The proposed model demonstrated robust performance in early risk identification and offered actionable recommendations that enhance safety management and operational efficiency within urban shield tunneling projects. The integrated risk warning and decision support framework provides a technically sound and practical tool to improve risk mitigation efficacy, optimize construction decision-making processes, and promote the safe and efficient advancement of urban rail transit shield tunneling construction.
Keywords: Risk warning, decision support, construction, proximal policy optimization (PPO), regularized random forest (RRF), safety standards, ICT protocols.
1 Introduction
A primary mode of transportation worldwide is Urban Rail Transit (URT). The growth of URT is critical to alleviating the burden of urban public transportation, promoting urban construction and the economic growth of linked businesses, improving residents’ travel, and living conditions, and improving the urban environment. Large-scale urban rail transit network construction introduces multiple categories of risks, including geological risks (such as soil variability and groundwater inflow), structural risks affecting adjacent buildings, operational risks involving equipment malfunction and worker safety, and environmental risks related to ground settlement, vibration, and surface disruption [1]. Tunneling has emerged as the most effective method for implementing underground transit networks in compactly developed areas. It is performed utilizing traditional methods, such as Earth Pressure Balance (EPB), which is a Shield Tunneling (ST) or slurry ST [2]. It is ideal for mixed-facial situations as it allows for greater control over face pressure. ST is a tunnel propulsion and excavation technique that employs a shield machine, often the Earth Pressure Balance (EPB) shield, and mixed or open face shield [3]. However, Shield Tunneling construction (STC) requires various activities, complicated machinery, intensive workers and a changing environment, generating risk factors that might lead to accidents. As a result, when building metro shields, it is critical to evaluate the safety risks. The tunneling process is impacted by three key factors like geological conditions, environment (underwater, urban, mountain) and shield properties [4].
In urban areas, the ST method for tunnel construction has been successfully deployed quickly while maintaining a high standard of safety. However, shield driving causes ground motions that are unavoidable, and numerous accidents have occurred such as structural damage or ground collapse. The primary factors impacting ST parameters include slurry pressure, excavation speed, cutter torque, soil pressure, cutter speed and a variety of torque indicators. Several tunneling parameters show variable degrees of correlation, determined by ambient elements and human actions [5].
STC safety issues can be explicitly classified into three major categories: (1) tunnel structural safety, involving lining deformation, ground settlement, and potential collapse; (2) personnel operation safety, including mechanical injuries, equipment failures, electrical hazards, and fire-related risks; and (3) environmental safety, which covers vibration, noise, groundwater disturbance, and the impact of tunneling-induced settlement on nearby infrastructure. The operational safety of construction staff relates to mechanical damage, object strike, and electrical and fire safety concerns experienced by personnel during construction operations [6]. However, shield construction certainly damages the surrounding soil. The STC, particularly in soft clay areas, will cause soil settlement, resulting in irregular settling of the existing foundations of neighboring constructions, structural tilting and even safety accidents. As a result, the data about soil settlement caused by shield building should be gathered quickly to give a reference for early warning [7]. Existing risk management systems like Fault Tree Analysis (FTA) for ST frequently rely on static assessments and expert judgment, which lack real-time adaptability and forecast accuracy. Fault Tree Analysis (FTA) is a deductive safety evaluation method that models how basic component failures combine to cause a top-level accident event. While FTA is useful for identifying potential failure paths, its structure is static, depends heavily on expert-defined probabilities, and cannot incorporate continuously changing tunneling conditions making it insufficient for real-time risk management in shield tunneling operations. These restrictions prevent early mitigation of developing risks, resulting in safety, economic, and scheduling inefficiencies. To address these constraints, the research offers a hybrid intelligent framework that combines Regularized Random Forest (RRF) for accurate risk prediction, Proximal Policy Optimization (PPO), and Rule-Based Optimization (RBO) for real-time decision assistance. It facilitates forecasting of potential outcomes, providing dynamic, real-time feedback to the construction management team for rapid operational response. This research is beneficial for civil engineers, urban infrastructure planners and construction managers involved in shield tunneling for urban rail transit.
2 Related Works
Significant risk elements and their relationships in metro STC were identified to prevent accidents [8]. Using Social Network Analysis (SNA), it investigated correlations between risk factors determined after an extensive research assessment. Findings revealed the interconnectedness of risky behavior, site management, and safety oversight, with some directly causing accidents and others indirectly, but limitations included unpredictable risk factors and limited data availability. The safety risk of ST beneath existing tunnels was evaluated using a hybrid Trapezoidal Cloud Model-Bayesian Network (TCM-BN) technique [9]. The method transformed and discretized the 12 risk parameters to improve prior probability estimation and perform forward reasoning, sensitivity analysis, and reverse diagnosis. The findings from a Wuhan Rail Transit demonstrated improved risk prediction accuracy and critical risk identification but faced limitations like expert-defined priors and model complexity.
The risk-informed decision-making in metro tunnel construction was improved by tackling epistemic uncertainty using a Continuous Time Bayesian Network (CTBN) methodology [10]. The CTBN model, utilizing Dynamic Fault Trees, incorporated expert opinions, historical data, and real-time anomalies for efficient evidence-based reasoning. However, data quality limitations necessitate expert involvement for model building and interpretation. The safety risk management in the metro shield construction was improved by using text mining to identify, extract, and show risk variables [11]. The Metro Project Safety Risk Early Warning System generated a risk corpus through word segmentation and risk factor extraction using the Jieba package. The findings included a structured list of risk-related phrases and a visual cloud diagram, but manual screening and language-specific technologies limit scalability and cross-linguistic application.
A dynamic risk warning system for tunnel construction was developed by combining knowledge-driven consequence, and data-driven likelihood, data [12]. It used a two-dimensional cloud model-based probability algorithm to simulate risk under uncertainty and compute risk levels for Guiyang Metro Line 3, demonstrating excellent stability with a Standard Deviation (SD) of less than 0.025. The safety and efficiency of STC were improved by dynamically modifying safety monitoring parameters [13]. introduces the m-CSRM framework, integrating fuzzy decision-support with ML-based risk prediction to enhance contextual cyber-risk assessment; this approach informs and inspires the proposed method by showing how intelligence-driven integration improves accuracy and adaptive risk evaluation [14]. It utilized finite element simulation to establish theoretical settlement values and develop an early warning system. Dynamo integrated digital and analog monitoring for real-time visualization, enhancing precision but requiring simulation accuracy and adaptability to diverse construction environments.
The connection between ST and railway operating on the Zhengzhou Metro Line 4 under-crossing Longhai Railway was investigated [15]. It used a 3D coupled finite element model in MIDAS/GTS NX to simulate building stages and ground sinking under train-induced vibrations. The results showed that the maximum settlement was within safe limits, but the model’s simplification of train loads to vibrations limited its accuracy. The ground surface settlement caused by ST was accurately predicted to improve warnings [16]. It used a tangent circle-based data preprocessing method and optimized a Back Propagation Neural Network (BPNN) for prediction, achieving an accuracy of 0.46%, but its applicability to a wide range of geological conditions is limited.
A scientifically reliable safety risk evaluation model for metro ST that utilized Hierarchical holography method (HHM) was established [17]. The model optimized using uncertain set theory and Order-relationship hierarchy method (G1) and Order-weighted average operator (COWA) methodologies, effectively identified risk indicators in Tianjin Metro conditions. However, it struggles with dynamic real-time threats and complex urban development unpredictability. The significant risk chains in URT operations were identified to better understand risk transmission dynamics [18]. It utilized an upgraded H-Apriori algorithm with a hazard degree index to identify risk sources and construct a weighted risk network using path search theory. However, the strategy faced limitations due to data quality and real-time risk evolution.
The construction risks for subway shield tunnels in complicated karst geological environments, with Guiyang Rail Transit Line 3 serving as a case study, were identified and assessed [19]. A risk assessment index system was developed using four risk categories, WBS-RBS technology, and AHP weighting. While useful for safety control, the qualitative methodology and expert judgment limitations limit real-time adaptability and forecast accuracy. A Pair-Copula Bayesian Network (PCBN) model was used to analyze the safety concerns of ST near existing tunnels [20]. Bayesian Networks (BN) and pair copulas were used to reflect complicated, nonlinear interactions among risk components. The model, applied to Wuhan Metro Lines 8 and 3, improved risk assessment accuracy and interpretability but required significant data and computing resources for widespread usage.
3 Methodology
This research aims to develop a comprehensive risk warning and decision support model to facilitate early risk detection and informed mitigation strategies during shield tunneling construction in urban rail transit projects. The risk levels were categorized into three levels of risk such as low, medium risk and high risk. The Urban Shield Tunneling data was gathered and pre-processed using the Interquartile Range (IQR) for outlier detection and mean imputation for missing values. Predictive risk modeling was conducted using Regularized Random Forest (RRF). The decision support module leverages Proximal Policy Optimization (PPO) combined with rule-based optimization algorithms to recommend adaptive mitigation actions, such as tunneling parameter adjustments and structural reinforcements. It facilitates forecasting of potential outcomes, providing dynamic, real-time feedback to the construction management team for rapid operational response. Figure 1 illustrates the methodology overview for risk warning prediction using the PPO-RRF model.
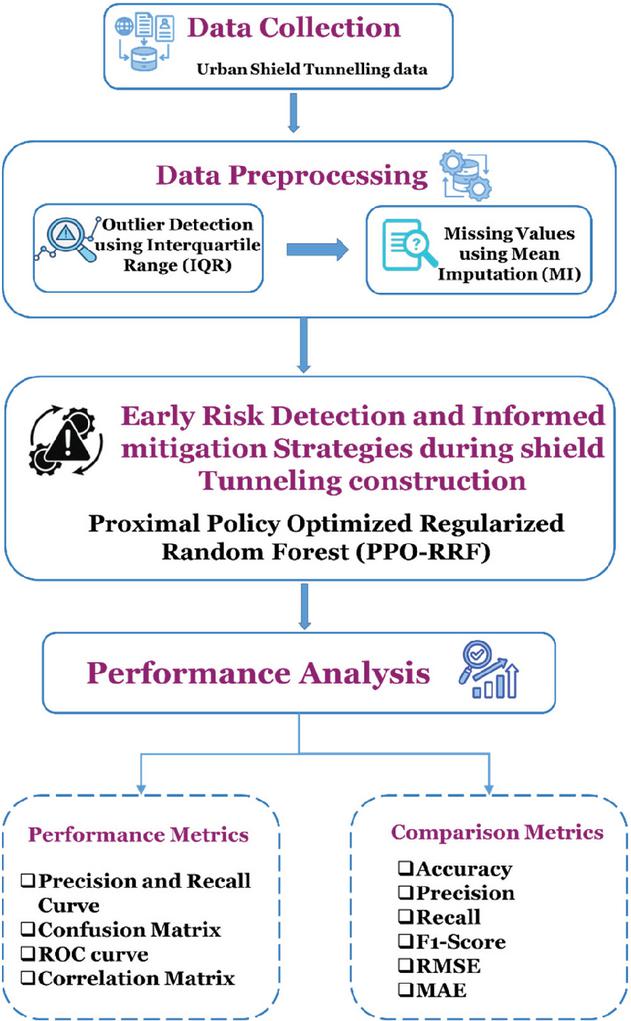
Figure 1 Methodology overview for risk warning prediction using the PPO-RRF model.
3.1 Data Collection
The Urban Shield Tunneling data was gathered from the Kaggle link: https://www.kaggle.com/datasets/ziya07/urban-shield-tunneling-dataset. This dataset contributes to the research and development of risk warning and decision support systems for ST in URT projects. It contains data that simulates actual conditions experienced while operating a tunnel boring machine (TBM). The data encompasses essential data elements such as geotechnical data, tunneling machine data, environmental data, and safety monitoring data. All the data points contained a risk level (Low, Medium, or High) based on domain-informed thresholds, along with potential mitigation recommendations for managing risk.
3.2 Data Pre-processing
Data pre-processing is the process of cleaning and transforming raw data to enhance its quality and suitability for timely and accurate analysis. It supports the model’s capability to provide real-time feedback, enabling continuous monitoring and dynamic updates of risk status during shield tunneling operations. It generates correct risk predictions through the identification of outliers using the Interquartile Range (IQR), identifying missing values using mean imputation, and transforming data in a way that allows for reliable input into the risk modeling process.
In this study, the Interquartile Range (IQR) and Mean Imputation (MI) are applied sequentially rather than simultaneously. First, the IQR method is used to detect and remove outliers from the tunneling dataset, ensuring that extreme abnormal values do not distort the statistical properties of the features. Once outliers are removed, the resulting gaps – as well as any originally missing data – are handled using Mean Imputation (MI). Applying MI after IQR ensures that the imputed values are computed from a clean, outlier-free distribution, which improves the reliability and stability of subsequent predictive modeling. This sequential process enhances data consistency and prevents biased imputations that may occur if outliers were present during the imputation stage.
3.2.1 Interquartile Range (IQR)
The IQR is a statistical measure for detecting outliers that calculates the range between a dataset’s 25th () and 75th () percentiles. It helps in the detection and elimination of extreme tunneling data values that affect risk modeling. It guarantees that the model is trained with correct and representative data. Effective outlier elimination increases the robustness of predictive analysis. The value of IQR is provided by Equation (1).
| (1) |
3.2.2 Mean imputation (MI)
MI is a data preparation technique that replaces the missing values with the average of the detected values for that variable. It is used to manage incomplete ST data while preserving valuable records. This preserves data integrity and provides a complete dataset for modeling. It improves consistency in risk assessment by lowering data sparsity. MI is calculated using Equation (2).
| (2) |
Where denotes the number of non-missing values in the th feature of the th class, and represents the data subset belonging to class .
The use of Mean Imputation (MI) also improves model performance by ensuring that the learning algorithms receive a complete and consistent dataset. Missing values, if left unresolved, reduce usable training samples and introduce instability into both the RRF classifier and the PPO decision module. By imputing missing values with the feature mean calculated after outlier removal, MI provides a more uniform input distribution, reduces variance caused by data gaps, and supports more stable tree construction in RRF and reliable policy updates in PPO. This leads to increased accuracy and consistency in the risk prediction and mitigation processes.
3.3 Early Risk Detection and Informed Mitigation Strategies During Shield Tunneling Construction Using Proximal Policy Optimized Regularized Random Forest (PPO-RRF)
The PPO–RRF framework combines the RRF for accurate early risk detection and PPO for learning adaptive mitigation plans. This comprehensive system identifies issues related to tunneling in real time, and provides immediate actionable solutions (e.g., parameter changes and reinforcements). This coordinated effort provides valuable benefits for safety management of railway tunneling and efficient progress in urban ST. It facilitates forecasting of potential outcomes, providing dynamic, real-time feedback to the construction management team for rapid operational response.
In the PPO–RRF framework, the two models interact in a sequential and complementary manner. The Regularized Random Forest (RRF) operates as the predictive module, producing real-time risk classifications based on cleaned and pre-processed tunneling data. These predicted risk levels serve as structured inputs to the Proximal Policy Optimization (PPO) module, which functions as the decision-making component. PPO uses the RRF-derived risk category together with current environmental and operational states to select optimal mitigation actions, such as adjusting tunneling parameters or applying reinforcement measures. Thus, RRF answers the question ‘What is the current risk level?’, while PPO answers ‘What action should be taken in response?’. This interaction enables the system to combine accurate risk prediction with adaptive, policy-driven decision support for dynamic tunneling conditions.
3.3.1 Early risk warning using regularized random forest (RRF)
RF is an Ensemble Learning (EL) method that uses various decision trees to increase classification and regression accuracy by aggregating their findings. However, RF might be susceptible to overfitting and has a limited interpretability, especially with noisy or high-dimension data commonly available in ST operations. To eliminate these limitations, RRF was developed, using a regularization technique that penalizes insignificant features and decreases the complexity of the model.
RRF improves the traditional RF by incorporating regularization to minimize the feature redundancy and reduce the risk of overfitting. It is used to develop a reliable and understandable risk prediction model for ST. It detects major risk factors while remaining generalized. This enables early warning with accurate risk classification. It uses the tree regularization framework to select a compact feature subset. While RRF is constructed similarly to RF, its main difference lies in using the regularized information gain in RRF as depicted in Equation (3).
| (3) |
Where the root node of the first tree has an empty set and is the set of feature indexes used for splitting in earlier nodes. Here, the penalty coefficient is denoted by . The coefficient penalizes the th feature for splitting node when . The penalty increases with a smaller . If a new feature contributes sufficient predictive information to the chosen features, RRF adds the feature’s index to using at each node.
3.3.2 Decision support using proximal policy optimization (PPO)
PPO is a reinforcement learning method that improves decision-making by constantly modifying actions depending on input while remaining stable. It is used to dynamically offer mitigation solutions while tunneling. It responds to changing conditions in real time, increasing operating safety. It ensures optimal, data-driven modifications in high-risk situations. Equation (4) is used as a policy estimation tool.
| (4) |
Where is the advantage value estimation and is the stochastic policy. represents the observable state of the environment at time , while represents the activity conducted during that state. The set of sampling values is averaged to determine the expected value (). The method alternates between optimization and sampling continuously. Equation (5) defines as the objective function’s derivative.
| (5) |
Instead of using to facilitate off-policy training, is utilized to increase training efficiency and make sampled data reusable. The objective function shows that when , the policy optimizes in the direction of increasing , increasing the probability of selecting the present action.
The action selection probability , advantage function , and learning rate are used together to define the size of the training step. When is less than 1, indicating that the policy updating produced by the maximized objective function is excessive, a clipping mechanism is introduced to the objective function in the PPO algorithm to penalize the policy change. In formula (6), the final objective function is displayed.
| (6) |
The action selection probability ratio of new and old policies is represented by the formula . The clip function eliminates the incentive to move outside of the hyperparameter-defined interval . Algorithm 1 depicts the pseudocode for PPO-RRF. Table 1 depicts the hyperparameter for the PPO-RRF Framework.
| Algorithm 1 Proximal Policy Optimized Regularized Random Forest (PPO-RRF) |
| Input: |
| D Shield tunneling dataset (with features and risk labels) |
| Regularization coefficient |
| Clipping threshold for PPO |
| Initial policy network with parameters |
| Discount factor |
| Learning rate |
| Total timesteps |
| Step 1: Risk Prediction with Regularized Random Forest (RRF) |
| Initialize feature set |
| For each node v in decision trees: |
| For each candidate feature j: |
| If : |
| Compute penalized gain |
| using Equation (3) |
| Else: |
| Select feature with max Gain_R and update F |
| Train RRF model on D to predict risk level |
| Step 2: Mitigation Strategy with PPO |
| Initialize PPO policy and old policy |
| For each episode from 1 to T: |
| Observe state s_t (e.g., tunneling pressure, speed, soil type) |
| Select action a_t based on : a_t |
| Apply a_t and receive reward r_t and next state |
| Compute advantage using reward – to – go or GAE |
| Calculate policy gradient using Equation ((4)) |
| Compute clipped surrogate objective using Equations ((5)) and ((6)) |
| Update policy by maximizing L_CLIP() via gradient ascent |
| Step 3: Rule – Based Optimization (RBO) for Final Decision Support |
| Define rules from domain experts (e.g., pressure thresholds, reinforcement triggers) |
| For each predicted risk R and PPO action a_t: |
| If High and a_t involves risky tunneling speed: |
| Apply RBO to adjust to conservative parameters |
| Else if : |
| Allow PPO output if within safe bounds |
| Else: |
| Proceed as per PPO output |
| Output: |
| – Real – time risk level prediction (Low, Medium, High) |
| – Adaptive mitigation action recommendation |
| – Rule – checked and feasible tunneling strategy |
Table 1 Hyperparameter for the PPO-RRF framework
| Component | Hyperparameter | Symbol | Typical Value | Description |
| RRF | Penalty coefficient | 0.1 – 0.5 | Controls regularization strength; lower values penalize new features more | |
| Number of trees | – | 100 | Total trees used in the ensemble forest | |
| Max depth | – | 10 | Limits the depth of each decision tree | |
| Minimum samples split | – | 2 | Minimum samples required to split a node | |
| Feature selection method | F | Auto | Keeps only significant features across splits | |
| Criterion | Gain_R (y_j, v) | Gini or Entropy | Regularized gain metric for feature selection | |
| PPO | Learning rate | 3 | Rate at which the policy and value networks are updated | |
| Discount factor | 0.99 | Determines the weight of future rewards | ||
| GAE lambda | (GAE) | 0.95 | Smooths advantage estimation for more stable learning | |
| Clipping range | 0.2 | Controls how far the new policy can deviate from the old one | ||
| Policy update epochs | – | 10 | Number of training iterations per update | |
| Mini-batch size | – | 64 | Number of samples per optimization batch | |
| Value function coefficient | cv | 0.5 | Balances value function loss with policy loss | |
| Entropy coefficient | ce | 0.01 | Encourages policy exploration | |
| Optimizer | – | Adam | Optimizer used for updating neural network weights |
PPO–RRF framework offers enhanced accuracy in risk prediction and dynamic adaptability in decision-making, enabling real-time identification of potential hazards and recommending optimal mitigation actions. This integration ensures robust, data-driven risk management that improves safety and operational efficiency in complex ST projects. It efficiently handles high-dimensional and noisy data, improving prediction stability and operational reliability. The PPO-RRF model allows for continual learning and modification, which makes it appropriate for complex, uncertain tunneling situations.
4 Result and Discussion
The objective of the research is to offer a comprehensive risk warning and decision support model that enables early risk detection and educated mitigation measures during STC in URT projects. The risk levels were categorized into three risk levels such as low, medium and high. It facilitates forecasting of potential outcomes, providing dynamic, real-time feedback to the construction management team for rapid operational response. This section contains the experimental setup, and performance metrics used for early risk detection of the STC.
4.1 Experimental Setup
The experimental setup was developed in Python to facilitate model construction and reinforcement learning integration. To ensure optimal computation and storage management, all data processing and model outputs were carried out on a system equipped with 16 GB RAM and 512 GB SSD storage.
4.2 Performance Metrics
The performance metrics utilized in this section are ROC (Receiver Operating Characteristic) curve, confusion matrix and precision-recall curve. The research also discusses the ablation study of the methods used in the research.
• ROC Curve
The ROC curve compares the False Positive Rate (FPR) and the True Positive Rate (TPR) at different categorization thresholds, highlighting the balance between sensitivity and specificity. It assesses the RRF model’s overall discriminatory capacity to distinguish between risky and safe tunneling scenarios. It is calculated by using Equation (7). Figure 2 represents the ROC curve for risk prediction performance evaluation using PPO-RRF model.
| (7) |
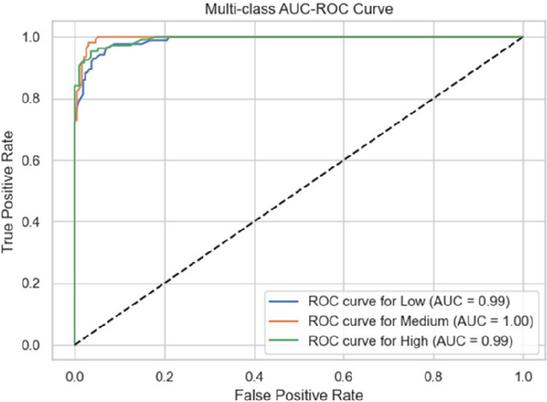
Figure 2 ROC curve for risk prediction performance evaluation using PPO-RRF model.
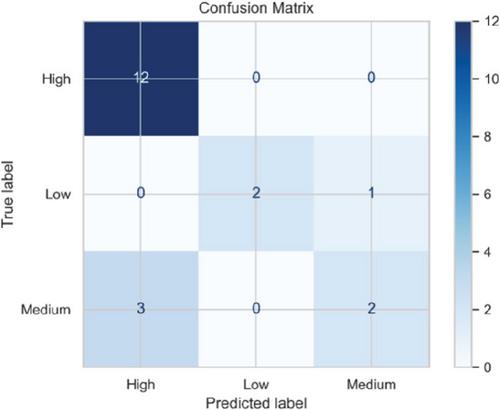
Figure 3 Confusion matrix of tunneling risk classification results.
The ROC values are 0.99 for low, 1.00 for medium, and 0.99 for high, indicating a highly reliable categorization. The proximity of curves to the top-left corner indicates high model sensitivity and specificity.
• Confusion Matrix
A confusion matrix combines True Positives (TP), True Negatives (TN), False Positives (FP) and False Negatives (FN) to provide a comprehensive explanation of classification findings. It is critical to observe and quantify how effectively the model forecasts tunneling risk occurrences compared with safe situations. The Confusion matrix of tunneling risk prediction results was illustrated in Figure 3.
• Precision-Recall Curve
The precision-recall curve demonstrates the relationship between precision and recall at various thresholds, which is important for dealing with imbalanced classes such as rare tunneling risks. It demonstrates how well the algorithm balances false alarms and neglected risks in ST risk detection. Figure 4 represents the precision-recall curve of PPO-RRF showing precision and recall balance at various thresholds.
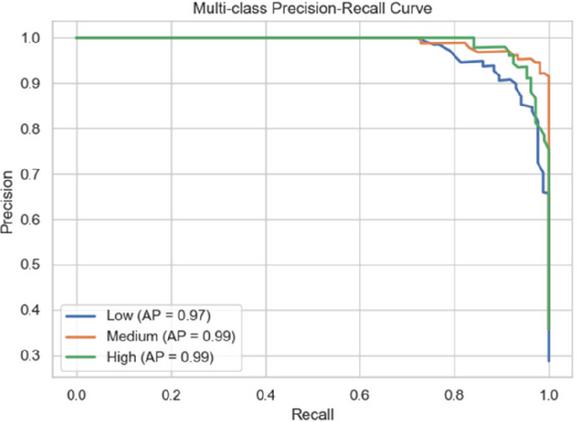
Figure 4 Precision-Recall Curve of PPO-RRF at various thresholds.
The precision-recall curve compares precision and recall for each risk level. The model’s average accuracy (AP) ratings were 0.97 for Low, 0.99 for Medium, and 0.99 for High-risk classes.
• Ablation Study
An ablation study includes systematically deleting or modifying critical components of a system to determine their individual impact on overall performance. It assists in determining which components contribute the most to accurate risk identification and effective decision support. It emphasizes the significance of each feature or method in enhancing ST safety and efficiency. Table 2 demonstrates the ablation study results that represent the impact of key model components on risk prediction accuracy and mitigation effectiveness.
Table 2 Ablation study results demonstrating the impact of key model components on risk prediction accuracy and mitigation effectiveness
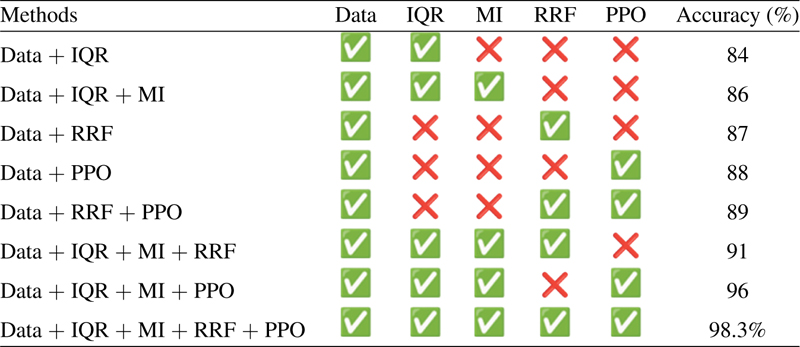
The combination of data preprocessing (IQR and MI), RRF and PPO achieved the highest accuracy of 98.3%, demonstrating that incorporating robust data cleaning, precise risk prediction, and adaptive decision support significantly improves risk management effectiveness in ST. This comprehensive approach ensures early detection and dynamic mitigation, which enhances overall safety and operational efficiency.
• Risk Level Analysis through Operational and Statistical Visualization
In the research, cutter speed and thrust force are significant operational characteristics impacting risk levels during drilling activities, with greater values frequently correlated with increased risk. Settlement variability across risk categories demonstrates that high risk conditions result in larger and more unpredictable ground movement, whilst low risk scenarios show limited and consistent settlement. These findings underscore the significant role of monitoring thrust and cutter inputs to accurately predict and reduce settlement-related risks. Figure 5 represents risk level analysis through operational and statistical visualization.
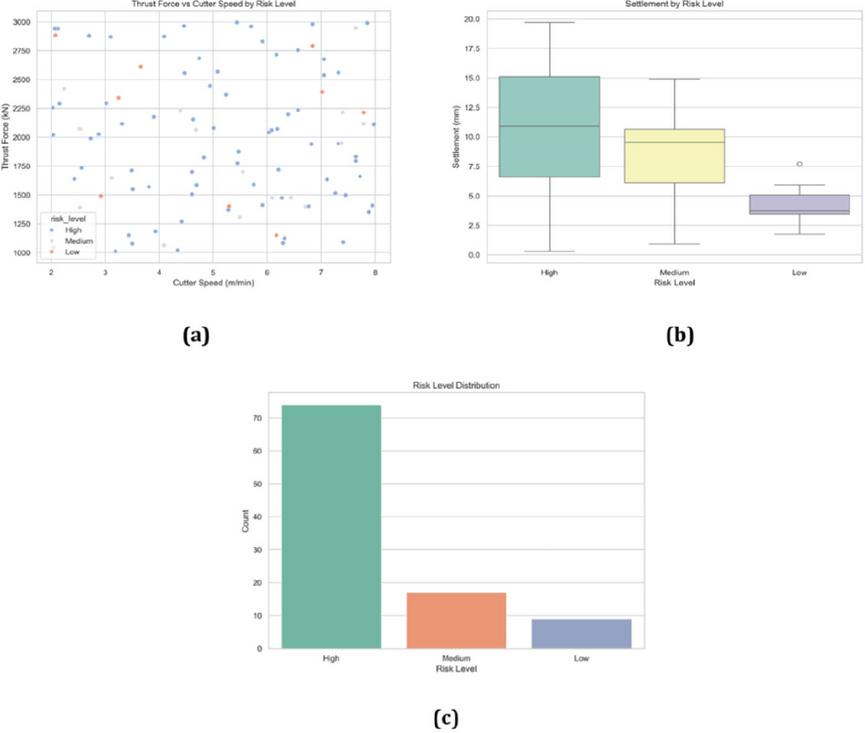
Figure 5 Risk Level Analysis through Operational and Statistical Visualization.
High risk spots are focused at higher thrust forces in Figure 5(a), where the cutter speed varies between 2 and 8 m/min and the thrust force ranges from 1000 kN to 3000 kN. Settlement values range from 0 to 19.8 mm (median 11.5 mm) for high risk, 1 to 15 mm (median 10 mm) for medium risk, and 1.5 to 6 mm (median 3.5 mm) for low risk, as shown in Figure 5(b). A skewed distribution with roughly 73 High, 18 Medium, and 9 Low risk occurrences is shown in Figure 5(c).
• Evaluation of Downtime and correlation matrix
The correlation matrix represents the links between critical factors such as cutter speed, thrust force, settlement, downtime, and alarms. Figure 6 represents the evaluation of the correlation matrix.
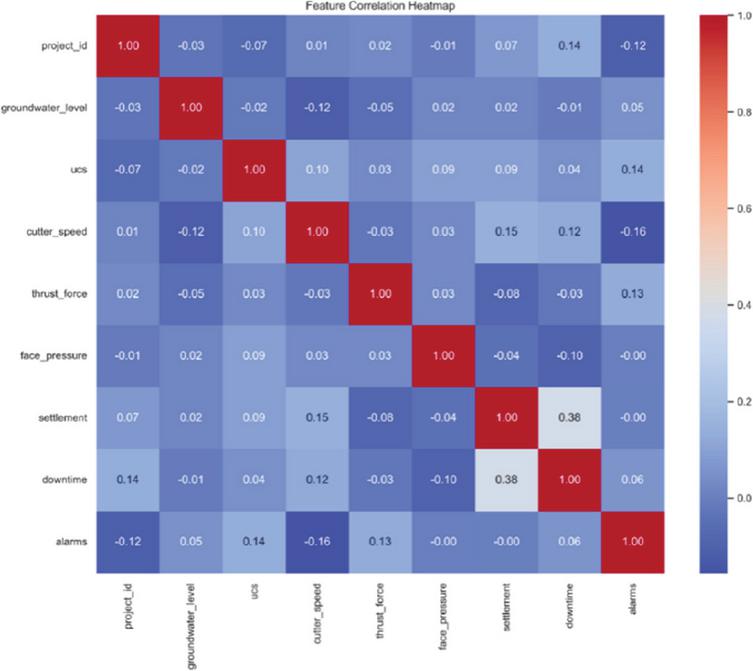
Figure 6 Evaluation of correlation matrix.
According to Figure 6, settlement and downtime have a moderately positive association (0.38), but cutter speed and alarms have a little negative correlation (-0.16). There are modest to moderate positive associations between downtime and alarms and other variables like UCS and project ID.
• Risk Level and Soil Type of Downtime, Alerts, and Actions
The downtime by risk level shows that high-risk zones have more fluctuation and higher average downtime, stressing the significance of careful planning and contingency plans in such areas. The overall number of alerts generated by soil type, with rock generating the highest, aids in determining which geological situations demand more frequent monitoring. The distribution of recommended actions by risk level reveals that Reinforce & Reduce Speed is the most advised action under high-risk, which aids decision-making for real-time tunnel operations plans. Figure 7 represents the risk level and soil type of downtime, alerts, and actions.
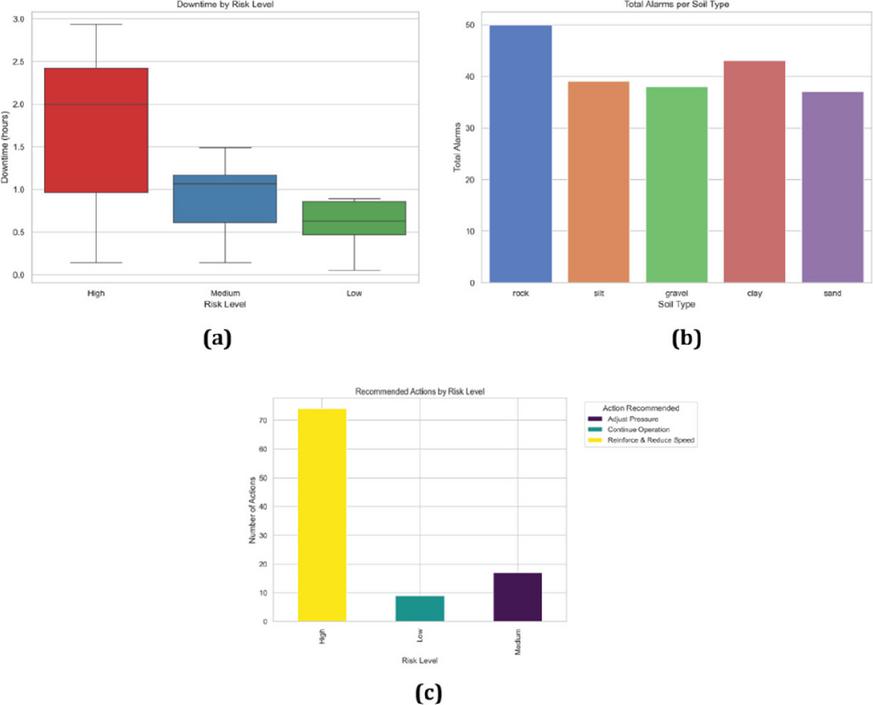
Figure 7 Risk level and soil type of (a) downtime, (b) alarms and (c) actions.
From Figure 7(a), downtime is substantially greater (median 2.0) than in medium- and low-risk areas (median 1.1 and 0.7, respectively) in high-risk areas. In Figure 7(b), Rock has the greatest alert count (50), followed by silt (39), and clay (43), suggesting that certain soil types experience operational problems most frequently. Figure 7(c) represents the Reinforce & Reduce Speed which is the most common recommended response in high-risk cases (73), whilst “Continue Operation” and “Adjust Pressure” are more prevalent in medium (17) and low (9) risk categories, respectively.
4.3 Comparison Phase
The performance metrics such as Root Mean Squared Error (RMSE), Mean Absolute Error (MAE), Mean Absolute Percentage Error (MAPE), Coefficient of Determination (), Accuracy, Recall, Precision, and F1-Score used for comparison of risk detection in ST. The existing methods, such as DEQT-EKF [21], RF [22] and RF [23], are used for comparing the risk detection of ST using the PPO-RRF model.
• RMSE
RMSE calculates the square root of the average squared differences between predicted and actual values. It helps to quantify how closely the RRF model’s results correspond to true tunneling risk values. A lower RMSE suggests improved prediction performance. RMSE is calculated by using Equation (8). Figure 8 represents the RMSE plot comparing prediction accuracy across model variants. Table 3 represents RMSE values for evaluating prediction error in tunneling risk model.
| (8) |
Where is the actual value, represents the predicted value and is the total number of data points. The difference is the squared error for each point, and RMSE is the square root of their average.
Table 3 RMSE values for evaluating prediction error in tunneling risk model
| Methods | RMSE |
| DEQT-EKF [23] | 1.457 |
| RF [24] | 0.047 |
| PPO-RRF [Proposed] | 0.984 |
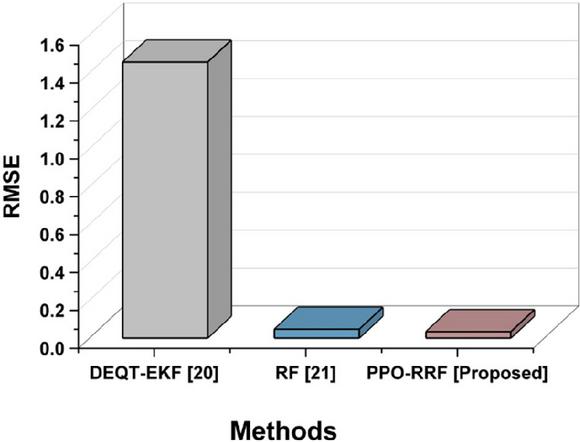
Figure 8 RMSE plot comparing prediction accuracy across model variants.
The PPO-RRF model has an RMSE of 0.984, showing a smaller average squared prediction error than DEQT-EKF (1.457) and RF(0.047).
• MAPE
MAPE displays prediction errors as a proportion of actual values, which allows for a more intuitive understanding of model performance in relation to risk factors. It allows comparing prediction errors across different tunneling circumstances by normalizing errors to scale. Table 4 represents MAPE values for evaluating percentage error in risk predictions. Figure 9 depicts the MAPE comparison for relative prediction accuracy of tunneling risks.
Table 4 MAPE values for evaluating percentage error in risk predictions
| Methods | MAPE (%) |
| DEQT-EKF [20] | 6.12 |
| PPO-RRF [Proposed] | 5.75 |
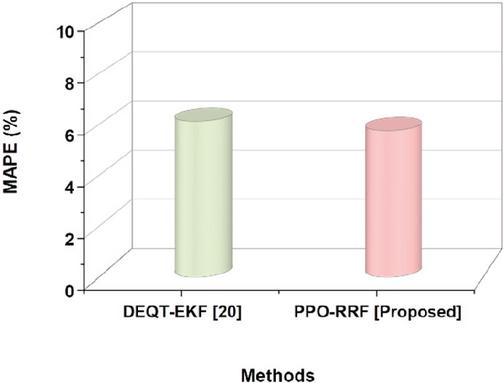
Figure 9 MAPE comparison for relative prediction accuracy of tunneling risks.
The PPO-RRF model achieved a MAPE of 5.75%, which is higher than the DEQT-EKF (6.12%), indicating that it produces lower relative percentage errors.
• MAE
MAE measures the average absolute difference between anticipated and true values, providing a simple measure of prediction accuracy that ignores huge errors. It is useful for calculating the average magnitude of risk prediction errors, which aids in determining the reliability of the risk warning system. Table 5 represents the MAE values for evaluating average absolute prediction errors. Figure 10 shows an MAE comparison for tunneling risk prediction model performance. MAE is calculated using Equation (9).
| (9) |
Table 5 MAE values for evaluating average absolute prediction errors
| Methods | MAE |
| DEQT-EKF [20] | 1.007 |
| PPO-RRF [Proposed] | 0.957 |
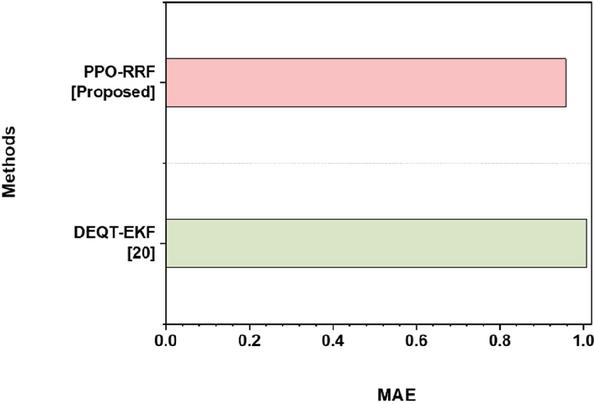
Figure 10 MAE comparison for tunneling risk prediction model performance.
PPO-RRF has an MAE of 0.957, indicating a low average absolute deviation from actual risk levels. It is slightly better than DEQT-EKF (1.007), showing greater consistency in prediction accuracy.
• R
R2 represents the amount of variance in the dependent variable that is predictable from the independent variables. It ranges from 0 to 1, with values around 1, demonstrating strong predictive power. It demonstrates how effectively the RRF model explains variations in tunneling risk. Table 6 shows the R2 values for evaluating variance explanation in risk predictions. Figure 11 represents R2 comparison indicating the predictive strength of the risk assessment model.
Table 6 R2 values for evaluating variance explanation in risk predictions
| Methods | R2 |
| RF [21] | 0.991 |
| PPO-RRF [Proposed] | 0.070 |
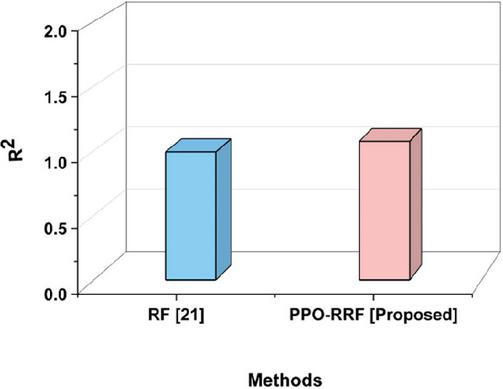
Figure 11 R2 comparison indicating predictive strength of risk assessment model.
The RF [22] has a low R2 of 0.991, explaining only 4.7% of the variance. The PPO-RRF model has a slightly improved R2 of 0.070, indicating a more effective match for the risk prediction data.
• Precision
Precision is calculated as the fraction of True Positive (TP) predictions among all predicted positives, demonstrating how frequently the model is correct when detecting a risk. High precision is required to reduce false alarms on the construction site. It assures that most of the early warnings are actually valid. Table 7 demonstrates the precision comparison between PPO-RRF and existing methods. Figure 12 illustrates the precision value across all evaluated models.
Table 7 Precision comparison between PDO-Bi-RNN and existing methods
| Methods | Precision (%) |
| RF [22] | 94 |
| PPO-RRF [Proposed] | 97.5 |
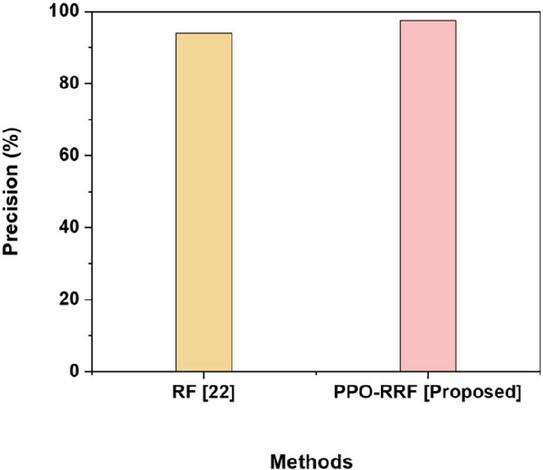
Figure 12 Precision visualization across all evaluated models.
PPO-RRF achieves 97.5% precision, which is higher than RF [22]’s 94%, lowering false alarms and increasing trustworthiness in risk warnings.
• Accuracy
Accuracy is defined as the proportion of TP predictions among all predicted positives, indicating how frequently the model is correct in recognizing a risk. High precision is necessary to reduce false alarms on building sites. It is calculated using Equation (10). Figure 13 depicts the graphical representation of the accuracy using PPO-RRF compared to existing models. Table 8 represents the accuracy comparison of different models for ESR.
| (10) |
Table 8 Accuracy comparison of different models for early risk prediction of STC
| Methods | Accuracy (%) |
| RF [22] | 95 |
| PPO-RRF [Proposed] | 98.3 |
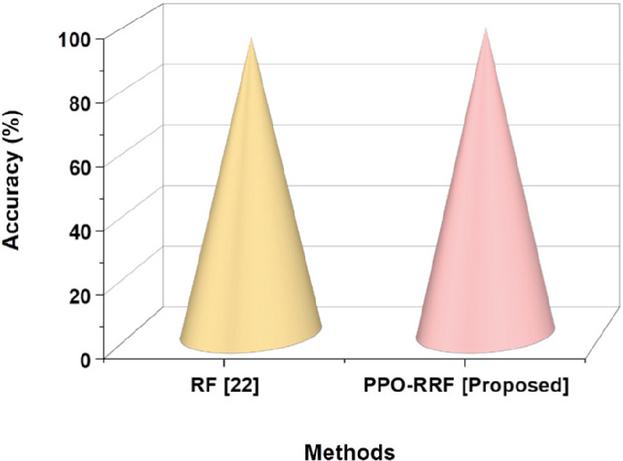
Figure 13 Graphical representation of the accuracy using PPO-RRF compared to existing models.
PPO-RRF achieves 98.3% accuracy, which is higher than RF [22]’s 95%, reducing false alarms and enhancing confidence in risk warnings.
• F1-Score
The F1-Score is the harmonic mean of precision and recall, which balances FP and FN. It is a complete metric when the class distribution is unequal or when precision and recall are equally significant. It is used to validate the PPO-RRF model’s capability to make accurate and dependable decisions. It is calculated by Equation (11). Figure 14 depicts the F1-Score of PPO-RRF. Table 9 represents F1-Score evaluation in SR tasks using the PPO-RRF model.
| (11) |
Table 9 F1-Score evaluation in ESR performance using PPO-RRF model
| Methods | F1-Score (%) |
| RF [22] | 94 |
| PPO-RRF [Proposed] | 97 |
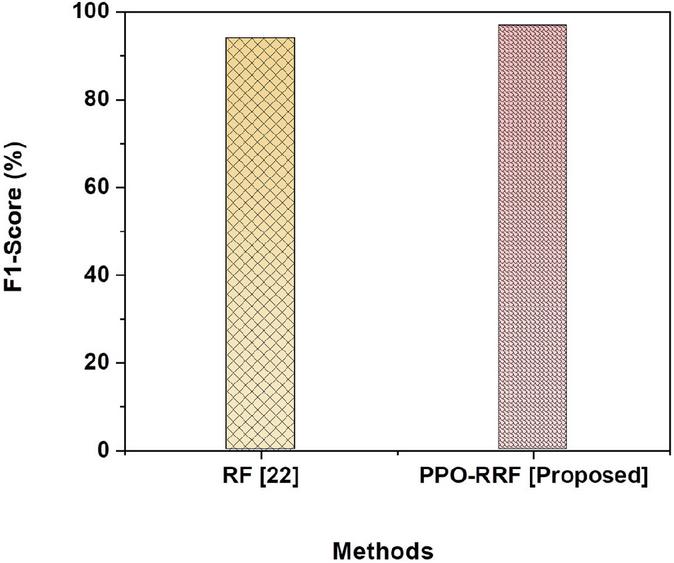
Figure 14 F1-Score of PPO-RRF for risk prediction performance.
The F1-Score of 97% in PPO-RRF efficiently balances precision and recall, outperforming the RF [22] of 94%.
• Recall
Recall assesses the model’s ability to correctly detect actual positive cases (true risks). It is crucial in risk management since overlooking a possible threat might have serious implications. A high recall indicates that the model reliably predicts the majority of the real risks. Table 10 illustrates the recall performance across all evaluated models. Figure 15 displays the recall comparison for proposed and existing methods.
Table 10 Recall performance across all evaluated models
| Methods | Recall (%) |
| RF [22] | 94 |
| PPO-RRF [Proposed] | 97 |
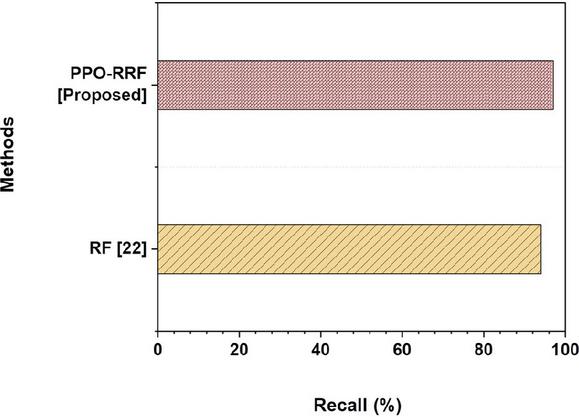
Figure 15 Recall comparison for proposed and existing methods.
With a recall of 97%, the model accurately detects the majority of actual risk occurrences, compared to 94% for RF [22]. High recall is critical in construction safety, ensuring that potential risks are not overlooked. It demonstrates the model’s considerable sensitivity.
The objective of the research is to develop a complete risk warning and decision support model that will allow for early risk detection and informed mitigation measures during STC in URT projects. The existing methods, such as DEQT-EKF [21], RF [22] and RF [23], that are used for comparison of early risk detection in ST exhibit notable limitations. Higher RMSE and MAPE produced by DEQT-EKF [21] indicate reduced accuracy in continuous prediction challenges. Low R2 value of RF [22] shows ineffective explanatory power and limited capacity to capture data variance. RF [23] is insufficient for continuous, data-driven risk management in complex tunneling situations as it lacks real-time adaptation and regression-based outputs, although it achieves good classification accuracy. In contrast, the PPO-RRF model significantly improved performance with lower RMSE, MAE and MAPE as well as higher precision, accuracy, recall and F1-score due to the combined use of RRF for its resilient feature selection, and PDO for its hyperparameter tuning. The research is important because it demonstrates a highly accurate and flexible framework for early risk warning in ST, and therefore improves construction safety, and operational efficiency, and supports real-time strategic responses in complex urban environments.
5 Conclusion
The objective of the research is to create a complete risk warning and decision support model that will allow for early risk detection and educated mitigation measures during ST construction in URT projects. The research successfully built and validated a complete risk warning and decision support model specifically designed for ST construction in URT projects. The Urban ST data that contains the three risk levels, such as low, medium and high, was gathered and pre-processed using IQR for outlier detection and mean imputation for missing values, which assured the integrity and dependability of the input data. The PPO-RRF framework accurately predicted risk levels and delivered adaptive mitigation strategies through timely alerts and dynamic tunneling adjustments. It facilitated forecasting of potential outcomes, providing dynamic, real-time feedback to the construction management team for rapid operational response. The PPO-RRF model significantly improved performance with lower RMSE (0.984), MAE (0.957), R2 0.070) and MAPE (5.75%) as well as higher precision (97.5%), recall (97%), accuracy (98.3%), and F1-Score (97%). Due to the limited training data available in such settings, the model’s performance could vary under extreme geological anomalies. Future research could incorporate real-time sensor data streams and improve model adaptation to various tunneling settings.
Declarations
Funding
There is no specific funding to support this research.
Conflict of Interest
The authors declare that they have no conflicts of interest regarding this work.
Data Availability
The datasets generated during and/or analysed during the current study are available from the corresponding author on reasonable request.
Code Availability
Not applicable.
Author Contributions
Wenfeng Cao and Lijun Shi contributed to the design and methodology of this study, the assessment of the outcomes, and the writing of the manuscript.
References
[1] Wu, Y., Zhao, L. Y., Jiang, Y. X., Li, W., Wang, Y. S., Zhao, H., Wu, W., and Zhang, X. J. (2021). Research and application of intelligent monitoring system platform for safety risk and risk investigation in urban rail transit engineering construction. Advances in Civil Engineering, 2021(1), 9915745. https://doi.org/10.1155/2021/9915745
[2] Xu, N., Guo, C., Wang, L., Zhou, X., and Xie, Y. (2024). A three-stage dynamic risk model for metro shield tunnel construction. KSCE Journal of Civil Engineering, 28(2), 503–516. https://doi.org/10.1007/s12205-023-0655-2
[3] Zeng, Y., Njock, P. G. A., Xiong, W., Zhang, X. L., and Shen, S. L. (2023). Risks analysis of large diameter slurry shield tunneling in urban area. Underground Space, 13, 281–300. https://doi.org/10.1016/j.undsp.2023.05.001
[4] Dalong, J., Xiang, S., and Dajun, Y. (2020). Theoretical analysis of three-dimensional ground displacements induced by shield tunneling. Applied Mathematical Modelling, 79, 85–105. https://doi.org/10.1016/j.apm.2019.10.014
[5] Fan, X., Tan, Z., Zhang, B., Zhao, J., Cao, Y., and Jiang, Y. (2024). Analysis of shield tunneling parameters and research on prediction model of tunneling excavation speed in volcanic ash strata of Jakarta–Bandung high-speed railway project. Applied Sciences, 14(11), 4623. https://doi.org/10.3390/app14114623
[6] Ge, S., Gao, W., Cui, S., Chen, X., and Wang, S. (2022). Safety prediction of shield tunnel construction using deep belief network and whale optimization algorithm. Automation in Construction, 142, 104488. https://doi.org/10.1016/j.autcon.2022.104488
[7] Ye, X. W., Jin, T., and Chen, Y. M. (2022). Machine learning-based forecasting of soil settlement induced by shield tunneling construction. Tunnelling and Underground Space Technology, 124, 104452. https://doi.org/10.1016/j.tust.2022.104452
[8] Pan, H., Huang, H., Luo, Z., Wu, C., and Yang, S. (2024). Research on safety risk factors of metro shield tunnel construction in China based on social network analysis. Engineering, Construction and Architectural Management. https://doi.org/10.1108/ECAM-05-2024-0685
[9] Chen, H., Shen, G. Q., Feng, Z., and Yang, S. (2024). Safety risk assessment of shield tunneling under existing tunnels: A hybrid trapezoidal cloud model and Bayesian network approach. Tunnelling and Underground Space Technology, 152, 105936. https://doi.org/10.1016/j.tust.2024.105936
[10] Guo, Y., Zheng, J., Zhang, R., and Yang, Y. (2022). An evidence-based risk decision support approach for metro tunnel construction. Journal of Civil Engineering and Management, 28(5), 377–396. https://doi.org/10.3846/jcem.2022.16807
[11] Tang, C., Shen, C., Zhang, J., and Guo, Z. (2024). Identification of safety risk factors in metro shield construction. Buildings, 14(2), 492. https://doi.org/10.3390/buildings14020492
[12] Sun, H., Zhu, M., Dai, Y., Liu, X., and Li, X. (2024). Dynamic risk early warning system for tunnel construction based on two-dimensional cloud model. Expert Systems with Applications, 255, 124799. https://doi.org/10.1016/j.eswa.2024.124799
[13] Cheng, Q., Wang, X., Sun, J., Zhao, H., and Liu, X. (2025). Research on BIM-based visualization, simulation, and early warning system for shield tunnel construction. Buildings, 15(5), 746. https://doi.org/10.3390/buildings15050746
[14] Devarajan, M. V., Al-Farouni, M., Srikanteswara, R., Bharattej, R. R. V. S. S., and Kumar, P. M. (2024, May). Decision support method and risk analysis based on merged-cyber security risk management. In 2024 Second, International Conference on Data Science and Information System (ICDSIS) (pp. 1–4). IEEE. http://doi.org/10.1109/ICDSIS61070.2024.10594070.
[15] Liu, B., Xi, D., and Xu, P. (2020). Study on the interaction of metro shield tunnel construction under-crossing the existing Longhai railway. Geotechnical and Geological Engineering, 38(2), 2159–2168. https://doi.org/10.1007/s10706-019-01154-y
[16] Wang, Q., Shen, C., Tang, C., Guo, Z., Wu, F., and Yang, W. (2024). Machine learning-based forecasting of ground surface settlement induced by metro shield tunneling construction. Scientific Reports, 14(1), 31795. https://doi.org/10.1038/s41598-024-82837-2
[17] Zheng, Y., Li, F., Guo, H., Chen, J., and Wu, J. (2025). Research on construction risk assessment method of shield tunnel based on subjective and objective weights. Journal of Engineering and Applied Science, 72(1), 25. https://doi.org/10.1186/s44147-025-00587-y
[18] Shi, G., Ding, X., Hong, C., Liu, Z., and Zhao, L. (2024). Research on key risk chain mining method for urban rail transit operations: A new approach to risk management. International Journal of Transportation Science and Technology, 13, 29–43. https://doi.org/10.1016/j.ijtst.2023.11.004
[19] Wang, X., Lu, H., Su, W., and Zhu, X. (2022, November). Risk analysis and assessment of shield tunnel construction in Karst area. In 2022 8th International Conference on Hydraulic and Civil Engineering (ICHCE) (pp. 674–680). IEEE. https://doi.org/10.1109/ICHCE57331.2022.10042675
[20] Chen, H., Lei, Y., Xia, L., Deveci, M., Chen, Z. S., and Liu, Y. (2025). Dynamic evaluation of the safety risk during shield construction near existing tunnels via a pair-copula Bayesian network. Applied Soft Computing, 169, 112583. https://doi.org/10.1016/j.asoc.2024.112583
[21] Deng, L. C., Zhang, W., Deng, L., Shi, Y. H., Zi, J. J., He, X., and Zhu, H. H. (2024). Forecasting and early warning of shield tunnelling-induced ground collapse in rock-soil interface mixed ground using multivariate data fusion and Catastrophe Theory. Engineering Geology, 335, 107548. https://doi.org/10.1016/j.enggeo.2024.107548
[22] Liu, Y., Chen, H., Zhang, L., and Wang, X. (2021). Risk prediction and diagnosis of water seepage in operational shield tunnels based on random forest. Journal of Civil Engineering and Management, 27(7), 539–552. https://doi.org/10.3846/jcem.2021.14901
[23] Zhai, J., Wang, Q., Yuan, D., Zhang, W., Wang, H., Xie, X., and Shahrour, I. (2022). Clogging risk early warning for slurry shield tunneling in mixed mudstone–gravel ground: A real-time self-updating machine learning approach. Sustainability, 14(3), 1368. https://doi.org/10.3390/su14031368
Biographies

Wenfeng Cao, male, born on November 20, 1982, in Mengcheng County, Anhui Province, is a Senior Engineer and a faculty member at Fujian Agricultural Vocational and Technical College. He graduated from Central South University of Forestry and Technology with a major in Civil Engineering and holds the professional qualification of a Class 1 Constructor. His research focuses on the construction and management of highway engineering.

Lijun Shi, male, born on October 25, 1981, in Fenghuang County, Hunan Province, is a Professor-level Senior Engineer and Deputy Chief Engineer of High-speed Railway Technology (Hunan) Co., Ltd. He obtained his PhD from Central South University and holds the professional qualification as a Class 1 Constructor. His research focuses on the R&D of intelligent detection equipment for rail transit and the application of AI algorithms in track defect identification.
Journal of ICT Standardization, Vol. 14_2, 223–254
doi: 10.13052/jicts2245-800X.1424
© 2026 River Publishers