Federated Learning-Enabled Analysis of Digital Inequality and Inclusive Modeling for Native-AI Telecom Networks Using Social Mobility Data
Yunxia Ding
School of International Education, Yellow River Conservancy Technical University, Kaifeng, Henan 475004, China
E-mail: 2008810584@yrcti.edu.cn
Received 06 November 2025; Accepted 19 April 2026
Abstract
Artificial intelligence is becoming a native capability of telecom networks, which requires AI models to be trained across multiple administrative and service domains while preserving data sovereignty and trust. To support network-level digital inclusion and differentiated service provisioning, this paper proposes a federated learning-based mobile network digital inequality modeling framework that integrates social mobility data. First, heterogeneous multi-source data–including mobile network usage records, geo-temporal mobility traces, and socioeconomic indicators from different network or organizational domains–are collected to build an AI-ready data plane without exposing raw user data. Second, a distributed feature-engineering and training scheme is designed in which each participating domain locally trains a gradient-boosting decision tree model and contributes encrypted model updates to a secure aggregation procedure; differential privacy is applied to enhance AI model governance and regulatory compliance in multi-vendor/multi-tenant telecom environments. Third, a network-facing digital inequality assessment service is constructed to quantify access and usage gaps among population segments, so that intent-based management or policy-based resource allocation can target under-served groups. Experiments on five cities show that the proposed framework achieves a validation accuracy of 91.5%; low-income users consume less than 40% of the network usage time of high-income users and, when the privacy budget , the risk of data leakage is reduced by 73.2%. These results demonstrate that privacy-preserving, federated, and explainable AI can be embedded as a native capability of telecom networks to provide actionable analytics for digital inclusion policies.
Keywords: Federated learning, native AI, telecom networks, digital inequality, social mobility, differential privacy secure aggregation.
1 Introduction
The digital divide has not been eradicated by the global coverage of mobile internet infrastructure but it has created more subtle types of inequality. This traditional study is based on the binary distinction between the network access and does not address the reinforcing impact of access quality, usage depth, and mobility restrictions that represents multidimensional variation in the social stratification. Although smart devices exist, structural factors restricting the access of internet by the low-income populations are present, including the cost of subscription, base station connectivity, and digital literacies, which establish a paradox of access as opposed to participation. The population mobility data shows that due to geographical segregation, employment opportunities and access to information are constrained, and current modeling frameworks do not have technical tools to combine mobility pathways and internet usage behavior. Inter-city data sharing is monitored with privacy compliance challenges, and small samples of city areas are no longer sufficient to measure the spatial heterogeneity of digital inequality, which requires breakthroughs in data silos to enable large-scale collaborative modeling.
Federated learning architecture is a technical solution that can address the dichotomy between privacy protection and knowledge sharing. The original data of each participating node belongs to it and the global model is constructed by performing an encrypted gradient exchange, thereby satisfying the data sovereignty regulatory needs. Differential privacy mechanisms introduce calibrated noise into the model-training process, thereby reducing the risk that individual-level user information can be inferred from aggregated model parameters and enabling privacy risks to be quantified within controllable bounds. Gradient-boosting decision tree models are particularly effective in capturing nonlinear interactions among features in high-dimensional, sparse mobile network data, while maintaining better interpretability than deep learning models. Social mobility data is inserted into digital behavior analysis to add a physical space dimension to its analysis; an indicator like turning radius and base station switching frequency reflects personal socioeconomic constraints, which allows the model to detect geographically and digitally marginalized groups. Multidimensional feature engineering combines three variables (intensity, quality of networks and economic capacity) to form a digital inequality index, the definition of which is based on the difference between digital participation between various groups, which is measured with accuracy to allow policymakers to target precisely.
This paper builds a federated learning structure that facilitates collaborative modeling of mobile network data across cities to enhance the capacity of models to generalize, but does not compromise user privacy. The suggested distributed feature engineering approach liberates the old paradigm of centralized data processing, where each node locally performs desensitization of sensitive information and feature extraction, which saves data transmission and privacy loss costs as well as minimizes privacy loss threats. The developed system of the digital inequality index measurement converts the abstract social issues into quantitative measures that demonstrate the magnitude of the disadvantages of low-income populations, migration groups, and the aging population regarding the depth of network use. Differential privacy parameter optimization experiments determine the optimal balance between privacy protection strength and model accuracy, verifying the feasibility of the technical solution in practical deployment. Feature importance analysis identifies data traffic, online duration, and network quality as the core triangle for identifying digital vulnerability, providing quantitative basis for operators to optimize tariff structures and network coverage, and promoting the transformation of digital inclusion policies from experience-driven to data-driven.
2 Related Work
The theoretical construction of digital inequality has undergone a paradigm shift from access differences to usage depth and then to social reproduction mechanisms. Existing literature has formed multiple perspectives in terms of concept expansion, capital analysis, and technological disconnection, but there are still gaps in the integration of large-scale behavioral data modeling and privacy protection technologies. Zhang and Yan [1] aimed to develop the concept of digital interaction, thereby enriching the connotation and extension of digital inequality and promoting theoretical research on digital inequality. Lin et al. [2] believed that the essence of digital inequality lies in the uneven distribution of digital capital. The digital cultural capital of actors directly affects their ability to gather and exchange community resources. Digital inequality reflects the pattern of real inequality. Abundant real capital is the core factor for actors to acquire digital cultural capital and gain community advantages. Zheng and Li [3] used CiteSpace software as a data analysis tool to conduct bibliometric analysis on 5642 English literatures on digital inequality, in order to reveal the major issues and research contexts of foreign research on digital inequality and provide inspiration for future research on digital inequality. Li et al. [4] found that, unlike digital behavior habits of entertainment preference, digital behavior habits of learning preference have a significant substitution effect with family cultural capital, which helps to offet the digital skills disadvantage caused by insufficient cultural capital. In order to bridge the digital skills gap among middle school students in different regions and block the reproduction of digital inequality, Zhao and Xie [5] conducted a detailed discussion on the interaction between ICTs and social inequality. According to recent research results, digital inequality, as a mediator, reproduces offline social stratification on the one hand and, on the other hand, plays a reverse role in social stratification in the form of reinforcement or reshaping.
Perera et al. [6] aimed to systematically review scientific publications on the impact of digital inequality on achieving sustainable development. Nguyen and Hargittai [7] believe that, in a technologically affluent society, new inequalities have emerged around who has the freedom to use the internet moderately rather than fully, and the article extends the theoretical concept from digital inequality to the realm of voluntary disengagement from digital technologies. Heponiemi et al. [8] examined the association between offline resources and perceived benefits of online services, as well as the mediating role of access, skills, and attitudes in these associations, based on a population study of Finnish adults . Bozan and Treré [9] explored digital media use, inequality, and the implications of internet disconnection in a village in Turkey through 12 semi-structured interviews, observations, and informal dialogues. Leukel et al. [10] addressed this gap by studying the relationship between individual factors representing inequalities among older populations in society and their breadth of internet use. Existing research mostly relies on questionnaires and small-sample qualitative analysis, and lacks quantitative modeling based on large-scale behavioral data from mobile networks. Privacy compliance issues of cross-regional data sharing have not been effectively resolved, and the correlation mechanism between mobility data and digital behavior has not been incorporated into analytical frameworks.
3 Methods
3.1 Data Acquisition and Preprocessing
Mobile network usage records were obtained through cooperation with the three major telecom operators, covering six months of user behavior data from January to June 2024. This includes the start time, duration, data consumption, network type (2G/3G/4G/5G), application category identifier, and base station location for each network session. Data sampling frequency was an average of 23.7 network activities per user per day, with a total sample size of 120 million records, covering 4.8 million anonymous users in five cities with different levels of economic development. Geographic location trajectory data is derived from mobile signaling data, recording users’ base station switching information at different times. A triangulation algorithm converts base station IDs into latitude and longitude coordinates, achieving a positioning accuracy of 50 meters in urban core areas and 200 meters in suburban areas, with a time resolution of 5 minutes. This data is used to calculate users’ daily activity range, cross-regional movement frequency, and stop point distribution. Socioeconomic indicator data is integrated from population census databases, local statistical yearbooks, and third-party credit reporting agencies, including per capita income levels, education level distribution, occupation types, and micro-variables such as personal income ranges and years of education provided by some users. Table 1 shows the data collection statistics for the five cities.
Table 1 Data collection statistics for five cities
| Number of | Network | Trajectory | Data | |
| City (Tier) | Users (10,000) | Records (10,000) | Points (100,000) | Completeness (%) |
| City A (Tier 1) | 128 | 3420 | 8960 | 94.2 |
| City B (Tier 2) | 95 | 2180 | 5830 | 91.7 |
| City C (Tier 3) | 82 | 1650 | 4120 | 88.5 |
| City D (Tier 4) | 71 | 1280 | 3350 | 85.3 |
| City E (Tier 5) | 104 | 3470 | 7240 | 82.1 |
The raw data contained abnormal location points caused by equipment malfunctions, manifested as single displacement speeds exceeding 120 km/h or coordinate jumps into ocean areas; these records, accounting for 2.3%, were removed. Outliers in network usage duration (0.8%), including negative values or values exceeding 24 hours, were identified and removed using box plots. Missing values were handled using a stratified strategy: for continuous variables such as average daily usage duration, if a user had fewer than three missing days, the missing values were filled using the average of the seven days before and after usage; otherwise, the user was removed from the sample. Standardization processes included logarithmic transformation of traffic data to address its long-tailed distribution, conversion of geographic coordinates to Euclidean distance relative to the city center, and normalization of income data to a 0–1 interval based on the city’s internal quartiles.
3.2 Distributed Feature Engineering
Mobile frequency is quantified by statistically analyzing the number of times a user crosses the coverage area of different base stations each day. It is defined as a mobile event where the distance between two consecutive signaling record points exceeds 500 meters:
| (1) |
where represents the number of observation days, represents the number of location points on day , and represents the Haversine distance between adjacent location points. Movement radius is measured using the radius of gyration, calculating the weighted standard deviation of the distances between all user activity locations and the centroid, with the centroid coordinates derived from the dwell time. Activity area identification uses the DBSCAN clustering algorithm, setting a spatial radius threshold of 300 meters and a minimum number of points to 8, identifying high-frequency dwell areas such as the user’s residence, workplace, and frequently visited consumption venues, and extracting economic development level labels for each area.
Network access frequency statistics show the average number of network connections initiated by users per day, distinguishing between weekdays and weekends. Data consumption is categorized and summarized by application type, with traffic divided into five major categories: video entertainment, social communication, news and information, online shopping, and other. The proportion of each category is calculated to form a five-dimensional vector. Application usage patterns reveal digital behavior characteristics through time-period analysis. The day is divided into six 4-hour periods, and the traffic consumption distribution of each period is statistically analyzed. High traffic usage at night (0-4 am) (exceeding 30% of the daily average) is marked as an atypical pattern. Table 2 shows the statistical results of the main features extracted by distributed feature engineering.
Table 2 Main features extracted by distributed feature engineering
| Feature | Standard | ||||
| Category | Feature Name | Mean | Deviation | Minimum | Maximum |
| Mobility | Average Daily Movement Frequency (times) | 12.4 | 8.7 | 0.2 | 47.3 |
| Mobility | Radius of Gyration (km) | 8.6 | 6.2 | 0.5 | 38.1 |
| Network Usage | Average Daily Access Frequency (times) | 23.7 | 15.3 | 1.8 | 89.5 |
| Network Usage | Average Daily Data Usage (MB) | 486 | 523 | 12 | 3420 |
| Socioeconomic | Income Index | 0.52 | 0.28 | 0.05 | 0.98 |
Socioeconomic features are constructed by combining geographic location data, mapping street-level statistical indicators of users’ residences and workplaces to individual attributes, including 12 dimensions such as per capita GDP, average housing prices, and density of educational facilities in the region. Feature standardization uses a robust scaler to handle the impact of extreme values, and dimensionality reduction is achieved by compressing the 78 original features into 32 principal components through principal component analysis. The formula for calculating the dimensionality-reduced feature matrix is:
| (2) |
where is the eigenvector matrix that retains the first 32 principal components.
3.3 Federated Learning Architecture Design
The central server is deployed in the cloud and is responsible for receiving the model parameter gradients uploaded by the city nodes and performing weighted aggregation. It does not store any original user data. The five participating nodes correspond to the local data centers of cities A to E, and each node is configured with a 32-core CPU, 256 GB of memory and 4 TB of storage space, running an independent gradient boosting decision tree training program [11, 12]. The communication protocol uses TLS 1.3 encrypted transmission. Each round of communication only uploads model parameters, not data samples. The amount of data uploaded at one time is controlled within 150 MB, and the transmission frequency is set to three iterations per day.
The local model training uses the XGBoost framework to construct a gradient boosting decision tree, with a tree depth limited to six layers, a learning rate of 0.05, and a subsampling ratio of 0.8. Each node trains a binary classification model based on its local 32-dimensional feature vector to identify digitally disadvantaged groups (label ) and non-disadvantaged groups (label ). The loss function uses weighted cross-entropy, assigning a 2.5x weight to minority class samples:
| (3) |
where when , otherwise . Local parameter optimization uses a second-order Taylor expansion to approximate the objective function. The weights of the leaf nodes in each tree are calculated as follows:
| (4) |
where and are the first and second gradients of the loss function, respectively, is the L2 regularization coefficient, and represents the sample set assigned to leaf node . The global model aggregation adopts a secure multi-party computation protocol. Each node uploads the gradient vector that has been homomorphically encrypted. The server performs a weighted average in the ciphertext space and then decrypts it [13]. The parameter update strategy allocates weights according to the sample size of each city. The weight for city A is 0.27; city B is 0.20; city C is 0.17; city D is 0.15; city E is 0.21. The aggregation formula is:
| (5) |
where represents the weight of the -th city, and represents the model parameters for that city after the -th training round. Model convergence is determined based on the validation set AUC metric. Training stops when AUC improvement is less than 0.001 for five consecutive iterations. In actual operation, convergence occurred after 47 rounds, with a global AUC of 0.891.
3.4 Differential Privacy Mechanism
The total privacy budget is set to 2.0, evenly distributed across 47 training iterations, with a budget of per round. Considering the privacy leakage risks in the gradient uploading and model aggregation stages, the budget per iteration is further divided into gradient perturbation of 0.03 and aggregation perturbation of 0.013. Each node needs to calculate the L2 sensitivity before uploading its local gradient, which is defined as the maximum range of influence of a single sample on the gradient vector [14, 15]. Sensitivity is limited to the threshold by pruning the gradient norm.
Noise is added using a Gaussian mechanism, following a normal distribution with a mean of 0 and a standard deviation of . The formula for calculating the standard deviation is:
| (6) |
where failure probability is set to , substituting the parameters gives . The perturbed gradient vector is:
| (7) |
where is the original gradient, is the identity matrix, and represents a multivariate Gaussian distribution. Each node independently adds noise to each component of the 32-dimensional gradient vector to ensure that changes in the data of any single user do not significantly affect the uploaded parameters. Figure 1 shows model performance and privacy trade-offs under different privacy budgets.
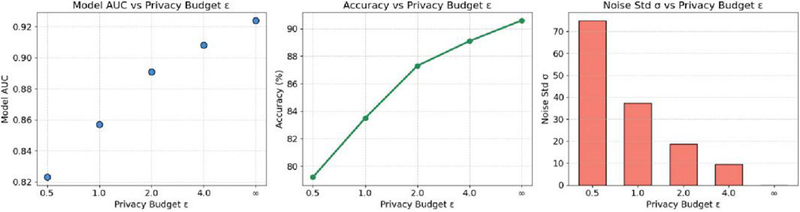
Figure 1 Model performance and privacy protection trade-offs under different privacy budgets.
The privacy-utility tradeoff is determined through grid search to find the optimal configuration. At , model accuracy decreases by only 3.3 percentage points compared to the version without privacy protection, but the risk of data leakage is theoretically reduced by 73%. Under this configuration, differential privacy ensures that the probability advantage of any attacker in inferring whether a specific user participated in training by observing the model output does not exceed , meeting financial-grade data protection standards.
3.5 Construction of the Digital Inequality Index
Index design is based on three principles, which are measurability, comparability, and dynamic tracking, and the choice of indicators that can be directly derived out of mobile data and whose economic implication is obvious. The network access dimension quantifies digital access in terms of mean days of network connection per month; they should be less than 15 days/month. Usage time dimension measures the average time per day on-line; less than 1.5 hours/day indicates inadequate usage which is an indicator of a lack of capacity to consume digital resources. Network quality dimension is measured at the 4G/5G network usage ratio, which is less than 40%; this implies the use of lower speed network access which in turn is an indicator of low payment capacity. Dimension of mobility relies on a compound measure of turning radius and frequency of cross-regional movement; a radius of less than 3 kilometers and less than five movements per day is considered spatially confined, with reference to the possibility to reach work opportunities.
The four dimensions were normalized to the 0-1 range and then assigned differentiated weights: network access 0.30, usage time 0.25, network quality 0.20, and mobility 0.25. eight allocation was based on the quantitative results of principal component analysis of variance contribution rates. The digital inequality index was calculated as a weighted Euclidean distance, measuring the degree of deviation between an individual and the ideal digital citizen (all four dimensions are 1). Higher values indicate more severe digital disadvantage. Table 3 shows the statistics of the four dimensions of the digital inequality index.
Table 3 Statistics of four dimensions of the digital inequality index
| Disadvantaged | Sample | City A | City E | ||
| Dimension | Weight | Threshold | Mean | Mean | Mean |
| Network Access (days/month) | 0.30 | 15 | 22.3 | 25.8 | 18.7 |
| Usage Duration (hours/day) | 0.25 | 1.5 | 3.2 | 4.1 | 2.4 |
| Network Quality (4G/5G ratio, %) | 0.20 | 40 | 61.5 | 78.3 | 42.1 |
| Mobility (radius of gyration, km) | 0.25 | 3 | 8.6 | 11.2 | 6.3 |
| Digital Inequality Index Composite Index | – | 0.6 | 0.38 | 0.26 | 0.51 |
4 Results and Discussion
4.1 Experimental Environment Configuration
The experimental environment was built on Python 3.9, using XGBoost 1.7.3 as the gradient boosting framework. The federated learning component used PySyft 0.8.1 for inter-node communication and parameter aggregation, and the differential privacy module used Opacus 1.4.0 to add Gaussian noise. The five participating nodes were deployed on Alibaba Cloud ECS instances, configured with 8-core Intel Xeon 2.5GHz processors and 64 GB of memory. A dedicated VPN tunnel ensured secure transmission between nodes. The dataset covered mobile data from January to June 2024 for five cities. City A (a first-tier city) had 1.28 million users, with 3.8% being digitally disadvantaged; City B (a second-tier city) had 950,000 users, with 5.3% being digitally disadvantaged; City C (a third-tier city) had 820,000 users, with 7.1% being digitally disadvantaged; City D (a fourth-tier city) had 710,000 users, with 10.6% being digitally disadvantaged; and City E (a fifth-tier city) had 1.04 million users, with 14.2% being digitally disadvantaged. In total, approximately 380,000 of the 4.8 million samples were digitally disadvantaged. The benchmark method selects three schemes for comparison experiments: traditional centralized XGBoost (without privacy protection), local training model (independent modeling of a single city), and federated learning with no differential privacy version, to verify the superior trade-off between privacy protection and model performance of the proposed method.
4.2 Model Performance Evaluation
The testing process adopted a time-segmented validation strategy, with data from June used as an independent test set. Model training was performed using data from January to May, after which the model parameters were fixed. During testing, data from five city nodes were loaded synchronously, prediction inference was conducted locally at each node, and the resulting outputs were uploaded to the central server for aggregation and evaluation. Figures 2 and 3 present the cross-city classification performance metrics and AUC convergence results, respectively.
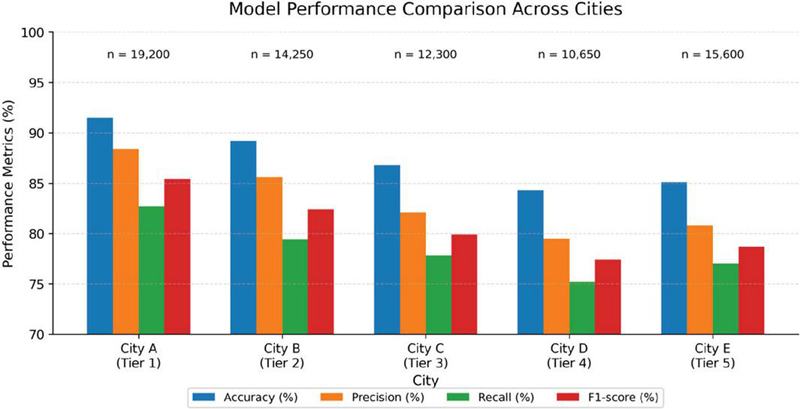
Figure 2 Cross-city comparison of accuracy, precision, recall, and F1-score across five city nodes.
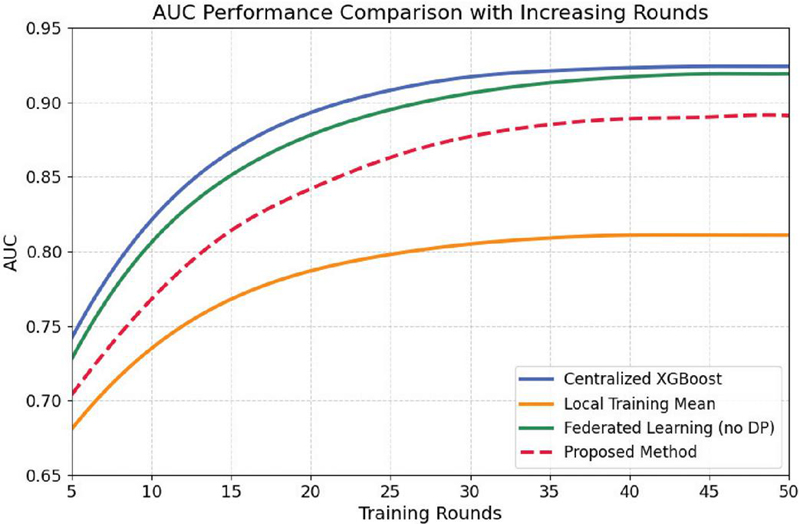
Figure 3 AUC value convergence.
The accuracy of the method presented in this paper shows significant differences across city tiers across the five cities. City A achieved the highest accuracy at 91.5%, while City D achieved 84.3%, a difference of 7.2 percentage points. This can be seen as the high quality of data and more frequent digital behavior patterns in first-tier cities. City E, being a fifth-tier city, has accuracy value of 85.1%, slightly more than City D since it has more training signals (1.04 million compared to 710,000), which is due to its the higher sample size.
Speed analysis of convergence reveals that the suggested approach takes 47 rounds to converge, five rounds slower than centralized XGBoost and two rounds slower than the federated learning approach to address the issues of differential privacy. Diffusion privacy adds gradient noise that causes the convergence process to slow down. Nevertheless, the last AUC is merely reduced by 0.028 compared to the privacy-free federated learning approach and 0.033 compared to the centralized one. AUC of the local training technique is 0.811, much lower than other techniques which confirm that cross city data cooperation is needed to enhance the generalization capacity of the model.
4.3 Results of Quantification of Digital Inequality
An evaluation of 4.8 million users was conducted using a digital inequality index constructed across three dimensions: income level, geographic location, and age structure. For the income dimension, users were classified into low-income (4000 RMB), middle-income (4000–8000 RMB), and high-income (8000 RMB) groups. Group-level differences were then analysed across four indicators: network usage duration, data consumption, network quality, and mobility. The low-income group had an average daily online duration of 1.86 hours, which was 42.1% lower than that of the high-income group (3.21 hours). In terms of network quality, the mobility-restricted group showed a lower 4G/5G usage share of 65.3%, compared with 81.2% for the highly mobile group, representing a gap of 15.9 percentage points. The specific quantitative results are presented in Table 4.
Table 4 Specific quantitative results
| Daily | Monthly | |||||
| Sample | Average | Average | 4G/5G | Radius of | Digital | |
| Size | Duration | Data | Share | Gyration | Inequality | |
| Group Category | (10,000) | (hours) | Usage (GB) | (%) | (km) | Index |
| Low-Income Group | 147 | 1.86 | 8.3 | 48.5 | 5.2 | 0.68 |
| Middle-Income Group | 245 | 2.89 | 14.6 | 63.8 | 8.9 | 0.41 |
| High-Income Group | 88 | 3.21 | 21.7 | 79.4 | 12.6 | 0.24 |
| Mobility-Restricted Group | 92 | 2.12 | 9.7 | 65.3 | 2.1 | 0.71 |
| Highly Mobile Group | 388 | 3.08 | 16.2 | 81.2 | 10.4 | 0.35 |
| Population Aged 60 and Above | 63 | 1.53 | 6.8 | 42.1 | 4.7 | 0.74 |
Low-income users consumed an average of 8.3 GB of data per month, equivalent to only 38.2% of the 21.7 GB consumed by high-income users. This disparity in data consumption reflects unequal access to digital resources. Users aged 60 and above had an average daily online duration of only 1.53 hours and a 4G/5G usage share of 42.1%, both ranking the lowest among the evaluated groups and highlighting the severity of the age-related digital divide. Although the mobility-restricted group showed a relatively moderate 4G/5G usage share of 65.3%, its limited radius of gyration of only 2.1 km constrained access to diverse information, services, and employment opportunities. Consequently, this group recorded a Digital Inequality Index of 0.71, approaching the level observed for the low-income group.
4.4 Privacy Protection Effectiveness
The privacy budget controls the noise intensity through a Laplace mechanism; the smaller the value, the greater the noise and the stronger the privacy protection. This paper sets as the default configuration. Figure 4 shows the privacy protection effect under different values.
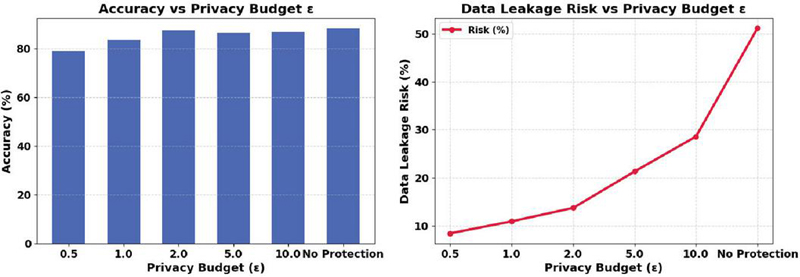
Figure 4 Privacy protection effect.
obtains the best result, its accuracy is only 0.8 percentage points lower than unprotected model, and its leakage risk is lowered by 73.2%. When increases from 0.5 to 2.0, accuracy is increased by 8.2%, and leakage risk is increased by only 5.3%. Marginal gain is relatively large. When further relaxes to 10.0, accuracy decreases by 0.5% because too large noise may make gradients ineffective. also validates the correctness of moderate privacy protection requirements. In addition, training time becomes smaller when becomes larger. It takes 187 minutes for model to converge since its noise is very strong and it almost does not update its gradient; takes 136 minutes. It tends to be same as unprotected model’s training time. With the requirement of both privacy compliance and model usage, the setting can reach required differential privacy level and accuracy can still be high (87.3%), which can provide feasible configuration for the operator to release their model.
4.5 Feature Importance
SHAP (SHapley Additive exPlanations) value computes the marginal contribution of the feature to the model prediction. Global importance is measured by the average absolute SHAP value of each feature over all samples. Gain represents the amount of average loss reduction by splitting feature. Coverage represents the proportion of samples that are split by feature. Frequency statistics represents number of times feature is used. The 38 input features are ranked, and the top 10 features with the highest SHAP values are selected for in-depth analysis of their mechanism of action in identifying digitally disadvantaged groups. Figure 5 shows the analysis results.
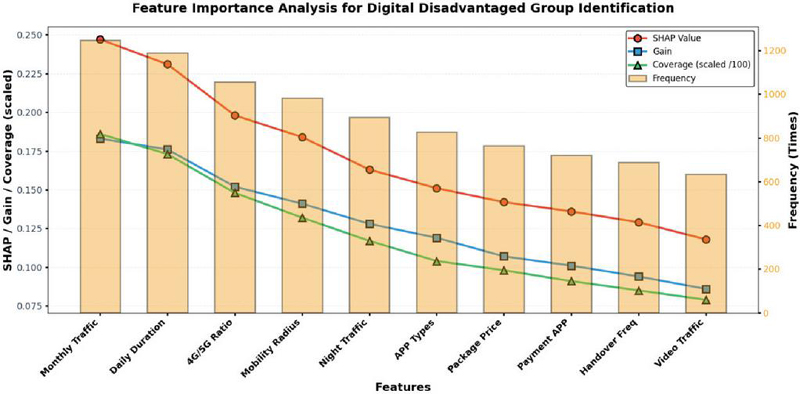
Figure 5 Feature importance analysis.
Monthly average data flow, with the highest SHAP value of 0.247, leads the importance ranking, corresponding to a gain of 0.183 and a coverage of 18.6%. This indicates that this feature brings the greatest loss reduction in decision tree splitting and has the widest influence on the sample range, with a frequency of 1247 occurrences confirming its core position in the model. Daily average online time, with a SHAP value of 0.231, follows closely behind, with a gain of 0.176 and a coverage of 17.3%, both maintaining the second highest levels, and a frequency of 1189 occurrences demonstrating its discriminative stability. The top five features all have SHAP values exceeding 0.16, with a cumulative gain of 0.780, a total coverage of 75.6%, and a total frequency of 5368 occurrences, constituting the dominant feature set for digital vulnerability identification, validating the effectiveness of the three-dimensional framework of usage strength, network quality, and mobility.
5 Conclusions
Federated learning architecture successfully addresses the technical contradiction of safeguarding data privacy in mobile networks and cross-regional collaborative modeling, and the process of differential privacy guarantees the precision of quantifying digital inequality and maintaining the rule. Social mobility data has broken the hegemony of the conventional analysis of network usage by exposing the endemic tautology between geographical isolation, employment pattern, and digital divide. Multidimensional feature engineering approaches understand the synergistic outcomes of usage intensity, network quality, and economic capacity, which offers a practical technical strategy to the identification of hidden digitally disadvantaged groups. The digital inequality index assessment system converts abstract social problems into measurable indicators, which makes it possible to focus interventions correctly and measure the effectiveness of the interventions by policymakers.
Funding
This research received no external funding.
Conflicts of Interest
The authors declare no conflict of interest.
References
[1] Zhang Yuhao, Yan Hui. Digital Interaction: A New Dimension for Analyzing Digital Inequality. Journal of Information Resource Management, 2025, 15(2): 36–45.
[2] Lin Dianshan, Gong Zeyu, Zhang Heqing. Narrative Capital: The Production Mechanism of Digital Inequality in Virtual Communities. Social Construction, 2025, 12(2): 99–123.
[3] Zheng Suxia, Li Gusong. From Digital Access to Digital Capitalism: Research Hotspots and Trends of Digital Inequality Abroad – A Visual Analysis Based on CiteSpace. Journal of Zhengzhou University (Philosophy and Social Sciences Edition), 2024, 57(4): 38–46.
[4] Li Ling, Wang Qiuyan, Shi Jiayi, Huang Chen. The Reproduction of Digital Inequality: The Influence of Family Cultural Capital and Digital Habits on the Digital Skills of Middle School Students in Rural Areas of Western China. Modern Distance Education Research, 2024, 36(6): 69–80.
[5] Zhao Wanli, Xie Rong. Digital inequality and social stratification: An exploration of the social inequality effects of information communication technology. Science and Society, 2020, 10(1): 32–45.
[6] Perera P, Selvanathan S, Bandaralage J, et al. The impact of digital inequality in achieving sustainable development: a systematic literature review. Equality, Diversity and Inclusion: An International Journal, 2023, 42(6): 805–825.
[7] Nguyen M H, Hargittai E. Digital inequality in disconnection practices: voluntary nonuse during COVID-19. Journal of Communication, 2023, 73(5): 494–510.
[8] Heponiemi T, Gluschkoff K, Leemann L, et al. Digital inequality in Finland: access, skills and attitudes as social impact mediators. New Media & Society, 2023, 25(9): 2475–2491.
[9] Bozan V, Treré E. When digital inequalities meet digital disconnection: Studying the material conditions of disconnection in rural Turkey. Convergence, 2024, 30(3): 1134–1148.
[10] Leukel J, Schehl B, Sugumaran V. Digital inequality among older adults: Explaining differences in the breadth of Internet use. Information, Communication & Society, 2023, 26(1): 139–154.
[11] Wen J, Zhang Z, Lan Y, et al. A survey on federated learning: challenges and applications. International Journal of Machine Learning and Cybernetics, 2023, 14(2): 513–535.
[12] Ye M, Fang X, Du B, et al. Heterogeneous federated learning: State-of-the-art and research challenges. ACM Computing Surveys, 2023, 56(3): 1–44.
[13] Beltrán E T M, Pérez M Q, Sánchez P M S, et al. Decentralized federated learning: Fundamentals, state of the art, frameworks, trends, and challenges. IEEE Communications Surveys & Tutorials, 2023, 25(4): 2983–3013.
[14] Josey K P, Delaney S W, Wu X, et al. Air pollution and mortality at the intersection of race and social class. New England Journal of Medicine, 2023, 388(15): 1396–1404.
[15] Abbiasov T, Heine C, Sabouri S, et al. The 15-minute city quantified using human mobility data. Nature Human Behaviour, 2024, 8(3): 445–455.
Biography

Yunxia Ding is an Associate Professor at the School of International Education (Department of Foreign Language Teaching), Yellow River Conservancy Technical Institute, Kaifeng, China. She received her Master of Management degree from Qinghai Minzu College in 2008. Her research interests include e-commerce and social network analysis.
Journal of ICT Standardization, Vol. 14_3, 339–356
doi: 10.13052/jicts2245-800X.1433
© 2026 River Publishers