5G-Advanced Network Slicing for Smart Grid Communications: Intelligent Resource Scheduling Under Energy-Efficiency and Performance Trade-Offs
Zhang Xianyang
School of Artificial Intelligence and Automation, Huazhong University of Science and Technology, Wuhan, Hubei, China
E-mail: 15927054887@163.com
*Corresponding Author
Received 23 April 2026; Accepted 16 June 2026
Abstract
5G-Advanced network slicing is emerging as a promising communication framework for smart-grid services with diverse latency, reliability, bandwidth, and criticality requirements. In smart-grid communication infrastructures, however, slice scheduling must balance service differentiation with energy efficiency, fairness, and resilience under dynamic operating conditions. This paper presents an interpretable intelligent scheduling framework, where intelligence refers to state-aware, service-aware, energy-aware, and resilience-aware adaptation rather than purely black-box learning. The framework jointly considers slice admission, radio-resource allocation, edge-resource allocation, activity-state control, and disturbed-mode adaptation. The problem is formulated as a dynamic multi-objective scheduling problem incorporating delay, reliability, service utility, energy consumption, fairness, and resilience. On this basis, a hierarchical scheduling method is developed for normal, bursty, and degraded operating conditions. Evaluation under representative smart-grid scenarios, including mixed-service operation, demand-response events, distributed energy resource (DER) coordination surges, and degraded-capacity conditions, shows that the proposed method achieves a better overall balance among service-level agreement (SLA) satisfaction, energy efficiency, fairness, and resilience than benchmark strategies. The results indicate that intelligent 5G-Advanced slice scheduling is a promising standards-aligned approach for service-differentiated and dependable smart-grid communications.
Keywords: 5G-Advanced, network slicing, smart grid communications, smart-energy infrastructures, intelligent resource scheduling, energy efficiency, resilience, multi-objective optimization.
1 Introduction
The ongoing modernization of power and energy systems is making communication infrastructure a core enabler of grid observability, distributed control, demand response, distributed energy resource (DER) coordination, advanced metering, electric vehicle (EV) integration, and resilience-oriented automation. In parallel, 5G has evolved toward 5G-Advanced, with Release 18 placing stronger emphasis on automation, intelligence, and support for heterogeneous vertical services [1, 2]. In this context, network slicing has emerged as a key mechanism for creating multiple logical service networks over shared infrastructure, each tailored to distinct latency, reliability, throughput, and isolation requirements [3, 4]. In this paper, the term 5G-Advanced is used not only to denote an evolution of radio access capability, but also to emphasize the stronger role of automation, intelligent orchestration, edge-assisted control, and service-differentiated network management. These capabilities are directly relevant to smart-grid communications because the scheduler must continuously adapt slice admission, resource allocation, and activity-state control according to heterogeneous service criticality and operating conditions.
A growing body of literature has shown that network slicing is not merely a virtualization concept, but a broader resource-management problem spanning radio access, transport, edge/cloud computing, orchestration, and service assurance. Existing studies have examined software-defined networking (SDN) and network function virtualization (NFV) based slicing architectures, resource-allocation principles, orchestration frameworks, and next-generation slicing models for 5G and beyond-5G systems [5–8]. More recent work has further emphasized the close relationship between slicing design and energy efficiency in fifth-generation networks [9]. Taken together, these studies suggest that network slicing is particularly well suited to environments characterized by heterogeneous service classes and strict service-level objectives, which is precisely the case for emerging smart-energy infrastructures.
At the same time, the rapid densification and softwarization of mobile systems have made energy efficiency a first-order design objective. Architectural studies have examined adaptive energy management in sliced networks [10], while other work has investigated throughput–energy-efficiency trade-offs and the deployment cost implications of energy-aware slicing [11, 12]. From a service-oriented perspective, joint delay–throughput trade-offs for smart-grid-oriented radio access network (RAN) slicing and scheduling strategies considering quality of service (QoS) and energy efficiency have also been reported [13, 14]. In parallel, machine learning and deep learning have increasingly been introduced into slice control and orchestration, including intelligent slicing design, deep-learning-based multi-domain service coordination, and heuristic low-latency slicing strategies for 5G/B5G environments [15–17]. Collectively, these studies confirm that energy consumption, service quality, and slice isolation are tightly coupled and should not be optimized independently.
For smart grids and broader smart-energy systems, these issues become even more critical. Prior studies have shown that 5G can support a wide range of energy-sector services, including demand response, EV charging coordination, operational monitoring, and utility communication [18–20]. It has also been argued that SDN- and slicing-enabled architectures can improve the flexibility and economic efficiency of smart-grid communications [21], while pilot-oriented investigations have illustrated the broader role of 5G in the digital transformation of smart grids [22, 23]. More recent work has moved toward explicit slicing strategies for smart-energy systems, including service-carrying methods for smart-grid communications, architectures for mixed-critical cellular energy services, and smart RAN slicing approaches tailored to utility scenarios [24–26]. At the experimental level, latency-oriented evaluations of protection-related communication over 5G and open-source smart-grid testbeds have begun to quantify the feasibility of these approaches in more realistic settings [27, 28]. However, the service landscape of smart-energy systems remains highly heterogeneous: protection and control traffic is ultra-delay-sensitive; demand-response traffic is event-driven and bursty; DER coordination requires dependable distributed communication; advanced metering infrastructure (AMI) traffic is large-scale but typically delay-tolerant; and video-assisted inspection demands sustained bandwidth. These properties make smart-energy communication infrastructures an especially relevant and demanding application domain for 5G-Advanced slicing.
Viewed collectively, the existing literature can be organized into three closely related streams. The first addresses general 5G/5G-Advanced slicing architectures and resource allocation, establishing the foundations of slice isolation, orchestration, and multi-tenant resource control [1–9]. The second focuses on energy-aware and AI-enabled slice management, showing that joint optimization of power, bandwidth, scheduling, and prediction can improve network-side efficiency [10–17]. The third addresses smart-grid and smart-energy communication applications of 5G, demonstrating that energy-sector use cases increasingly require differentiated communication treatment and can benefit from slicing, edge support, and low-latency wireless connectivity [18–28]. Although these three streams are individually well developed, their intersection remains underexplored.
Specifically, a clear methodological gap remains in the current literature. First, much of the network-slicing literature is still telecom-centric, optimizing generic key performance indicators (KPIs) such as throughput, delay, acceptance ratio, or utilization without explicitly modeling the operational value of different smart-energy services [3–9, 13–17]. Second, many energy-aware slicing studies focus on reducing network power consumption but do not sufficiently capture service-critical differentiation or the effect of bursty smart-grid operating conditions [10–14]. Third, smart-grid-oriented 5G studies have largely emphasized feasibility, architecture, pilot demonstrations, or protocol-level latency evaluation rather than developing a unified intelligent slice scheduler that explicitly balances energy efficiency, communication performance, service criticality, and resilience [18–28].
This gap is especially important for 5G-Advanced-enabled smart-energy infrastructures. Compared with earlier 5G phases, 5G-Advanced places stronger emphasis on network intelligence, automation, and enhanced service differentiation [1, 2], which makes it increasingly realistic to deploy schedulers capable of continuously balancing latency, reliability, fairness, and energy consumption across slices. However, the literature still lacks a sufficiently integrated framework that is simultaneously energy-aware, service-aware, and resilience-aware for smart-energy communications. This limitation motivates the development of the formulation and scheduling framework proposed in this paper.
Motivated by the above gaps, this paper develops an intelligent resource scheduling framework for 5G-Advanced network slicing in smart-energy communication infrastructures, explicitly targeting the trade-off between energy efficiency and service performance. Instead of treating all traffic as generic mobile traffic, the framework incorporates representative smart-energy service classes and their heterogeneous communication requirements, so that slice admission, resource allocation, priority adaptation, and resource activation decisions are guided by both conventional network KPIs and service criticality.
The novelty of this work lies in combining three elements that are usually treated separately. First, the scheduler uses smart-grid service criticality to distinguish the operational value of different communication slices. Second, it jointly controls communication resources, edge resources, and infrastructure activity states so that energy efficiency is considered together with service performance. Third, it introduces disturbed-mode adaptation to protect critical services under bursty or degraded operating conditions. Therefore, the proposed method is not only a generic network-slicing allocation scheme, but a service-aware, energy-aware, and resilience-aware slice scheduler tailored to mixed-critical smart-grid communication infrastructures.
The main contributions of this paper are as follows. First, a smart-grid service abstraction is developed to map protection/control, demand response, DER coordination, AMI, and video-assisted monitoring traffic to differentiated slice requirements. Second, a multi-objective scheduling formulation is developed to capture delay, reliability, service utility, energy consumption, fairness, and resilience. Third, an interpretable hierarchical scheduling method is proposed, combining urgency-based priority evaluation, utility-efficiency resource allocation, activity-state control, and disturbed-mode correction. Fourth, a simulation-based evaluation is conducted under normal, event-driven, and degraded-capacity conditions, with comparison against static, priority-based, throughput-oriented, energy-minimization, and service-unaware adaptive baselines.
2 Application Context and Problem Setting
2.1 Smart Energy Communication Scenarios
Modern smart-energy infrastructures support diverse communication services rather than a single homogeneous traffic type. In practice, power-system digitalization involves protection and control signaling, demand-response coordination, DER monitoring and dispatch, AMI, and increasingly bandwidth-intensive multimedia or inspection functions. Prior work on 5G-enabled smart grids has shown that these services have markedly different latency, reliability, and bandwidth requirements, making differentiated communication treatment essential and making smart-grid communications a suitable application domain for standards-based 5G-Advanced network slicing.
In this paper, the smart-energy traffic landscape is abstracted into five representative service classes: protection and control traffic, demand-response signaling, DER and renewable coordination traffic, AMI and periodic monitoring traffic, and video-assisted inspection or other bandwidth-intensive monitoring traffic. Protection and control services are highly time-sensitive and dependability-critical, while demand-response traffic is event-driven and bursty. DER coordination traffic is distributed and variable, AMI traffic is comparatively delay-tolerant but large-scale, and video-assisted monitoring introduces sustained or bursty high-bandwidth demand. Because these service classes differ in burstiness, timing sensitivity, isolation needs, and operational consequence, a single static allocation strategy is unlikely to be efficient. Instead, the communication infrastructure should map heterogeneous services onto differentiated logical slices and adapt resource decisions over time.
Table 1 Smart energy service classes and communication requirements
| Representative | Reliability | Bandwidth | Criticality | ||||
| Service Class | Functions | Traffic Pattern | Latency Target | Requirement | Demand | Burstiness | Level |
| Protection & control | Fault isolation, transfer-trip, self-healing support, operational control | Small packets, highly time-sensitive, event-driven | Ultra-low | Very high | Low | Moderate | Very high |
| Demand response | Load adjustment signals, event-triggered control, customer-side coordination | Bursty, event-triggered, geographically wide | Low-to-moderate | High | Low-to-moderate | High | High |
| DER coordination | Renewable/storage dispatch updates, distributed coordination, event handling | Distributed, variable, update-driven | Low-to-moderate | High | Moderate | Moderate-to-high | High |
| AMI/periodic monitoring | Smart meter reporting, large-scale monitoring, routine telemetry | Periodic or quasi-periodic, large-scale | Delay-tolerant | Moderate | Low | Low | Medium |
| Video-assisted inspection | Substation/asset inspection, anomaly verification, video analytics | Sustained or bursty high-volume streams | Moderate | Moderate | High | Moderate-to-high | Medium |
A key implication of Table 1 and Figure 1 is that the smart-energy domain is inherently multi-service and mixed-critical. Accordingly, the scheduling problem addressed in this paper is not a generic mobile-broadband resource-allocation problem, but a critical-infrastructure communication problem in which the value of serving traffic depends on the corresponding energy-service function.
2.2 5G-Advanced Network Slicing for Smart Energy Infrastructures
5G-Advanced provides a particularly suitable technological basis for such heterogeneous environments because it strengthens service differentiation, automation, and AI-assisted management in comparison with earlier 5G phases. Release 18 has been widely described as the first 5G-Advanced release and places notable emphasis on intelligent network operation and broader support for vertical services. In smart-energy settings, these capabilities make it increasingly realistic to orchestrate multiple logical service networks with distinct quality targets over shared physical infrastructure.
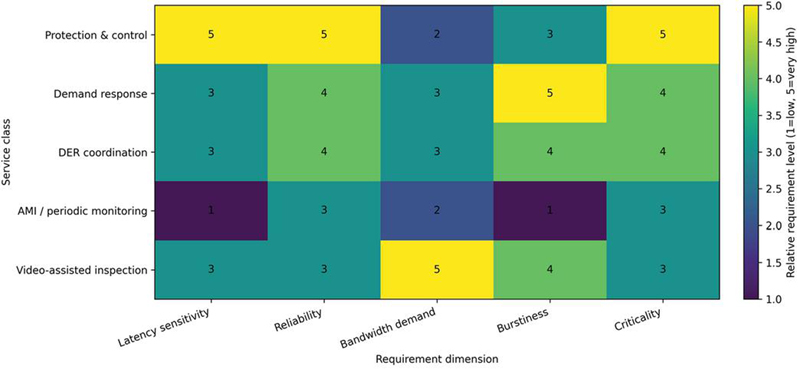
Figure 1 Smart energy service categories and their communication requirements.
For smart energy infrastructures, network slicing should be interpreted not merely as virtual partitioning, but as a cross-layer service provisioning mechanism spanning radio access, edge computing, transport support, and control-plane orchestration. In this context, a slice can be viewed as a service-specific logical environment with a predefined or dynamically adjusted combination of resource reservation, priority treatment, isolation level, and performance assurance. Recent smart-grid research has explicitly framed slicing as a key enabler for interoperable connectivity, mixed-critical service support, and AI-assisted RAN management for IEC 61850-related services. Field-oriented and pilot-oriented studies similarly suggest that slicing-enabled architectures can support utility communication use cases more flexibly than monolithic or one-size-fits-all configurations.
Accordingly, the present paper considers a smart-energy communication infrastructure composed of four functional layers: (1) Energy application layer, which includes protection/control, demand response, DER coordination, metering, and monitoring functions; (2) Access and connectivity layer, which provides wireless access through 5G-Advanced infrastructure; (3) Edge intelligence and service support layer, which offers localized processing, buffering, and scheduling assistance; (4) Slice orchestration and control layer, which observes service states and determines slice-level resource decisions.
Within this architecture, different smart-energy services are mapped to distinct slice types according to their operational characteristics. For example, protection and control traffic may require high-priority, strongly isolated, ultra-low-latency treatment; demand-response traffic may require elastic but event-aware prioritization; AMI traffic may favor scalable, energy-efficient handling; and video-assisted monitoring may require bandwidth continuity with lower control priority. This mapping is consistent with recent smart-grid slicing architectures proposed for mixed-critical cellular energy systems and AI-assisted smart-grid RAN slicing.
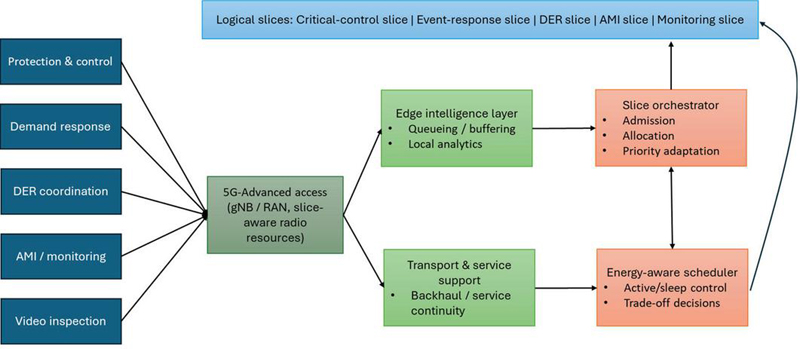
Figure 2 5G-Advanced network slicing architecture for smart energy infrastructures.
The architectural interpretation adopted here is important for two reasons. First, it makes the paper compatible with the realities of future smart-grid communication infrastructures, where different operational services must coexist over shared platforms. Second, it highlights that the scheduling problem is inherently multi-resource and multi-objective, since slice quality depends not only on radio allocation but also on compute availability, orchestration responsiveness, and the selective activation or deactivation of resources.
In the proposed framework, 5G-Advanced capabilities are reflected at the slice-orchestration level. The scheduler assumes that service descriptors, aggregate slice states, edge-resource availability, and network activity states can be observed or estimated by the orchestration layer. Based on these inputs, it performs adaptive admission, priority adjustment, radio/edge resource allocation, and disturbed-mode correction. Thus, the proposed method is aligned with the 5G-Advanced trend toward automated and service-aware network control.
2.3 Energy-Efficiency and Performance Trade-Off in Slice Scheduling
Although differentiated slicing improves service customization, it also sharpens the trade-off between communication performance and energy efficiency. Lower energy use can be achieved through resource consolidation, adaptive activation, and reduced overprovisioning, but these measures may increase delay, reduce service margins, or weaken robustness under sudden load changes. Conversely, maintaining strict latency and reliability guarantees for all services at all times may require persistent over-allocation and higher infrastructure energy consumption.
In smart-energy systems, this trade-off is more pronounced for three reasons. First, service criticality is uneven, so performance degradation does not have the same consequence across service classes. Second, traffic is event-driven and nonstationary, meaning energy-saving policies that work under normal conditions may become harmful during bursts or disturbances. Third, resilience matters alongside efficiency, since communication performance under degraded conditions is often as important as average performance in normal operation. Therefore, the core challenge is not simply to maximize throughput or minimize power, but to allocate and activate resources over time so that critical services remain protected while overall infrastructure energy use remains efficient.
Figure 3 plays a central conceptual role in the paper: it makes explicit that the scheduler must operate on a multidimensional trade-off surface rather than a single KPI axis.
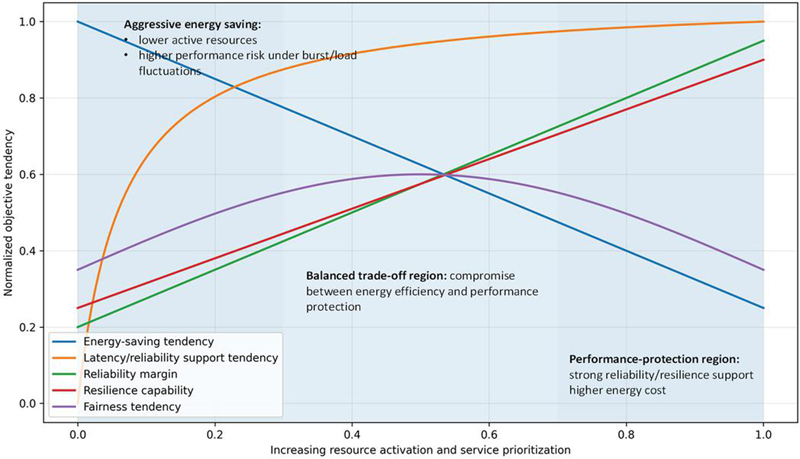
Figure 3 Conceptual view of the energy-efficiency–performance trade-off in slice scheduling.
2.4 Formal Problem Statement
The resource scheduling problem considered in this paper involves a 5G-Advanced smart-energy communication infrastructure supporting multiple heterogeneous service slices with different traffic dynamics, QoS requirements, resource demands, and criticality levels. At each scheduling interval, the scheduler observes traffic, queue, resource, and performance states, and determines admission, radio and computing resource allocation, priority adaptation, activity-state control, and response under bursty or degraded conditions.
The objective is to balance several conflicting goals, including protection of highly critical services, acceptable support for less time-sensitive traffic, reduced infrastructure energy consumption, improved fairness and utilization, and preserved resilience under disturbances. Accordingly, the problem is formulated as a dynamic multi-objective mixed-critical scheduling problem with coupled communication and energy dimensions. Because heterogeneous slices compete for limited shared resources and practical systems require near-real-time adaptation, the task is not a conventional single-metric allocation problem, but a service-aware and energy-aware scheduling problem for critical-infrastructure communications.
3 System Model and Problem Formulation
This section formalizes the slice-scheduling problem introduced in Section 2. The aim is to model the interaction among heterogeneous smart-energy service slices, shared communication and computing resources, infrastructure energy consumption, communication performance, and service-specific utility, and then formulate scheduling as a dynamic multi-objective optimization problem.
3.1 Overall Network Architecture Model
Consider a 5G-Advanced smart-energy communication infrastructure composed of a set of access nodes, edge-computing entities, and a centralized or logically centralized slice orchestration controller. Let denote the set of access nodes or gNBs, the set of edge-computing nodes, and the set of logical service slices. The infrastructure supports multiple smart-energy applications, including protection and control, demand response, DER coordination, advanced metering, and bandwidth-intensive monitoring. These applications generate heterogeneous traffic demands mapped onto differentiated slices according to operational requirements. Each slice may consume radio-access resources, edge-computing resources, and orchestration attention during service delivery. Time is modeled in discrete scheduling intervals indexed by . At each interval, the controller observes the aggregate network state and determines slice-level scheduling decisions for the next interval, affecting admission, resource allocation, priority treatment, and infrastructure activation. To retain tractability, the model operates at slice level rather than packet level.
3.2 Slice and Traffic Model
Each slice is associated with a service descriptor , including nominal traffic intensity, maximum tolerable delay, minimum required reliability, nominal communication-resource demand, nominal computing-resource demand, and service criticality weight. For each slice and scheduling interval , let denote the newly arriving traffic demand, the queue backlog at the beginning of the interval, and the achieved service rate. Queue evolution is modeled as:
To represent whether slice demand is admitted for service, define the admission variable:
where corresponds to full admission, to deferral, and intermediate values to partial admission if fractional service is allowed.
3.3 Resource Model
The infrastructure includes two main categories of schedulable resources: communication resources and computing resources. Let denote the available radio-resource budget at access node during interval , and denote the available computing-resource budget at edge node during interval . For each slice , define as the radio resource allocated from access node to slice , and as the computing resource allocated from edge node to slice . The aggregate resources allocated to slice are therefore:
The allocation must satisfy the capacity constraints:
To capture adaptive infrastructure operation, let denote whether access node is active in interval , and denote whether edge node is active in interval . Effective resource availability is linked to the activity states through maximum capacities and :
This enables the scheduler to jointly control resource allocation and resource activation.
3.4 Energy Consumption Model
The total infrastructure energy consumption in each scheduling interval is modeled as the sum of communication-side, computing-side, and switching-related components. For the access layer, the power consumption of node is expressed as:
where is the baseline active power and is the incremental power coefficient associated with communication resource utilization. Similarly, for the edge layer, the power consumption of node is expressed as:
where is the baseline active power and is the incremental processing power coefficient. To reflect activation and deactivation overheads, switching costs are included as:
where and denote switching cost coefficients for access and edge nodes. The total network power in interval is therefore:
If the duration of each scheduling interval is , the total energy consumption is:
3.5 Communication Performance Model
Slice-level communication performance is characterized through delay, reliability, and service-level agreement (SLA) violation.
3.5.1 Delay model
Let denote the effective end-to-end delay experienced by slice in interval . This delay includes queueing, transmission, and processing components and is modeled as a function of queue backlog and service rate. For analytical convenience, a monotonic approximation may be adopted:
where is a small positive constant.
3.5.2 Reliability model
Let denote the reliability achieved by slice in interval, interpreted as the probability of successful or SLA-compliant delivery. Reliability depends on resource sufficiency, congestion, and service conditions, and is represented as
3.5.3 SLA violation indicators
To explicitly account for service degradation, define the delay-violation indicator
and the reliability-violation indicator
The overall SLA-violation indicator is then written as
3.6 Smart-Energy Service Utility Model
A key feature of the present work is that service quality is not evaluated solely through generic communication KPIs. Instead, a service-utility model is introduced to reflect the operational value of communication performance for different smart-energy functions. Let denote the utility achieved by slice in interval . It is defined as
where is the service criticality weight and is a slice-specific utility function. For highly critical slices such as protection and control, utility decreases sharply once delay exceeds a threshold or reliability drops below the required level. For demand response and DER coordination, degradation is less abrupt but still significant during event-driven windows. For AMI, degradation is more gradual, while for bandwidth-intensive monitoring utility depends more strongly on continuity and sufficient throughput. In the simulation, the normalized utility of slice at interval is computed from delay satisfaction, reliability satisfaction, and service support:
where is the service criticality weight, is the normalized delay-satisfaction term, is the normalized reliability-satisfaction term, and is the normalized service-rate support term. The coefficients , , and determine the relative importance of delay, reliability, and served traffic. For protection/control slices, the delay and reliability terms are weighted more strongly and utility drops sharply when SLA thresholds are violated. For demand-response and DER coordination slices, the utility function gives additional weight to event-window performance. For AMI traffic, degradation is modeled more gradually because traffic is relatively delay tolerant. For video-assisted monitoring, the service-rate support term is weighted more strongly to reflect bandwidth continuity.
3.7 Fairness and Resilience Indicators
In addition to slice-level QoS and utility, two system-level indicators are incorporated.
3.7.1 Fairness indicator
Let denote the inter-slice fairness index in interval . A Jain-type index is adopted:
where may denote the admitted traffic fraction, achieved service rate, or normalized utility of slice .
3.7.2 Resilience indicator
In this paper, resilience is evaluated as a communication-infrastructure-level metric rather than a physical-grid resilience metric. In the simulation, the resilience score is computed from three normalized components: critical-service SLA retention, degradation severity, and recovery speed:
where measures the fraction of critical-service intervals that remain SLA-compliant, penalizes the depth of performance degradation during resource reduction, and reflects the speed of recovery after the degraded condition ends.
3.8 State Representation for Scheduling
Based on the above definitions, the scheduler operates on an aggregate state vector which may be expressed as
This state representation aggregates traffic, backlog, allocated resources, achieved performance, and infrastructure activation status.
3.9 Problem Formulation
Given the system model above, the scheduling task is formulated as a dynamic multi-objective optimization problem. At each scheduling interval , the controller determines the admission variables, slice-level resource allocations, and infrastructure activity states:
The objective is to jointly minimize total infrastructure energy consumption; minimize communication delay and SLA violations; maximize service utility; improve inter-slice fairness; enhance resilience under dynamic operating conditions. A generic optimization form can therefore be written as
where denotes the set of decision variables and are nonnegative weighting coefficients reflecting the relative importance of utility, energy, delay, violation penalties, fairness, and resilience, respectively. The optimization is subject to the following constraints:
1. radio-resource capacity
2. computing-resource capacity
3. activity-state feasibility
4. queue dynamics
5. delay and reliability service conditions
for slices requiring strict QoS guarantees, possibly enforced either as hard constraints or through the violation penalty term;
6. variable-domain constraints
The problem is dynamic because traffic demand and service urgency evolve over time, and it is difficult to solve exactly under near-real-time decision requirements. This motivates the intelligent scheduling method developed in Section 4. The formulation above is used as the decision objective and design basis of the scheduler. It is not solved as an exhaustive mixed-integer optimization problem at every scheduling interval, because such a solution would be difficult to apply under near-real-time orchestration requirements. Instead, the proposed method in Section 4 approximates the objective through a hierarchical heuristic procedure: first evaluating slice urgency and criticality, then allocating radio and edge resources according to marginal service benefit and energy cost, and finally applying disturbed-mode correction when bursty or degraded conditions are detected.
3.10 Assumptions and Scope Boundaries
Several assumptions are adopted to retain tractability. Detailed physical-layer (PHY) effects, packet-level retransmission, and channel-level stochasticity are abstracted into slice-level service-rate and reliability functions. The scheduler is assumed to have access to timely aggregate state information. Backhaul and transport effects are represented implicitly through service-support capacity rather than a detailed topology model. Finally, the present work focuses on communication-infrastructure scheduling rather than full co-optimization with physical grid dynamics. The main notation and symbols used in the formulation are summarized in Table 2.
Table 2 Main notation and symbols
| Symbol | Definition |
| Set of access nodes or gNBs | |
| Set of edge-computing nodes | |
| Set of logical service slices | |
| Set of scheduling intervals | |
| Newly arriving traffic demand of slice at interval | |
| Queue backlog of slice at interval | |
| Service rate achieved by slice at interval | |
| Admission variable of slice | |
| Service descriptor of slice | |
| Nominal traffic intensity of slice | |
| Maximum tolerable delay of slice | |
| Minimum required reliability of slice | |
| Nominal communication resource demand of slice | |
| Nominal computing resource demand of slice | |
| Criticality weight of slice | |
| Available radio-resource budget at access node | |
| Available computing-resource budget at edge node | |
| Radio resource allocated from node to slice | |
| Computing resource allocated from node to slice | |
| Aggregate radio resource allocated to slice | |
| Aggregate computing resource allocated to slice | |
| Activity state of access node | |
| Activity state of edge node | |
| Maximum communication capacity of node | |
| Maximum computing capacity of node | |
| Power consumed by access node | |
| Power consumed by edge node | |
| Power-equivalent switching overhead | |
| Total network power consumption | |
| Total energy consumption in interval | |
| Delay experienced by slice | |
| Reliability achieved by slice | |
| Delay-violation indicator | |
| Reliability-violation indicator | |
| Overall SLA-violation indicator | |
| Service utility of slice | |
| Fairness indicator | |
| Resilience indicator | |
| Aggregate system state | |
| Set of scheduling decision variables | |
| Objective weighting coefficients |
4 Proposed Intelligent Scheduling Method
Section 4 translates the multi-objective formulation in Section 3 into an interpretable hierarchical scheduling procedure suitable for interval-based slice orchestration. Given the dynamic multi-objective problem formulated in Section 3, the solution should adapt to time-varying traffic mixtures and service urgencies, capture the trade-off between energy consumption and communication performance, and remain computationally feasible for near-real-time orchestration. To meet these requirements, this paper proposes a service-aware and energy-aware intelligent scheduling framework for 5G-Advanced network slicing.
4.1 Framework Overview
The proposed scheduling framework operates in a closed loop over discrete scheduling intervals. In this work, “intelligent” does not imply that the scheduler is implemented as a black-box deep-learning controller. Instead, the term refers to adaptive and state-aware decision making based on observed traffic pressure, service criticality, delay stress, reliability stress, resource sufficiency, and disturbance conditions. The proposed scheduler is therefore an interpretable, rule-guided hierarchical method that can be implemented directly or extended with learning-based modules in future work. At each interval , the controller receives the current system state , evaluates the operating condition of all service slices, and generates a scheduling decision set . The decision process includes five tightly coupled stages:
1. State acquisition and normalization
The controller collects aggregate system information, including traffic arrivals, backlog levels, delay indicators, reliability status, allocated resources, and access/edge activity states.
2. Service-aware condition evaluation
Each slice is evaluated in terms of urgency, criticality, and service degradation risk. This step distinguishes highly critical slices from elastic or delay-tolerant slices.
3. Trade-off-driven decision generation
Based on the current state, the scheduler determines admission levels, radio-resource allocation, edge-resource allocation, priority adjustment, and resource activation or sleep decisions.
4. Resilience-oriented correction
When abnormal events, bursty demand, or degraded operating conditions are detected, the scheduler applies corrective decision logic to protect critical services and maintain graceful degradation.
5. Feedback and state update
The realized service outcomes, including delay, reliability, utility, and energy consumption, are used to update the system state for the next scheduling interval.
This design allows the scheduler to combine normal-operation efficiency with disturbance-aware responsiveness, which is particularly important for smart-energy infrastructures.
4.2 State Space and System Observation Design
The scheduler operates on an aggregate observation vector derived from the model in Section 3. For scheduling purposes, the raw state is transformed into a compact decision-oriented representation. For each slice , the following quantities are evaluated: (a) traffic pressure, reflecting the combined effect of new arrivals and queue backlog; (b) delay stress, indicating the proximity of current delay to the allowed threshold; (c) reliability stress, indicating the proximity of the achieved reliability to the minimum acceptable level; (d) criticality-weighted urgency, combining service criticality with real-time performance pressure; (e) resource sufficiency ratio, reflecting whether currently allocated resources are adequate for the observed load. A representative slice urgency score may be defined as
where , , and are nonnegative coefficients controlling the relative influence of backlog, delay pressure, and reliability pressure. In addition to slice-level urgency, the scheduler also evaluates system-level operating conditions. Two indicators are especially important: (1) load tightness, reflecting the ratio of aggregate demand to active infrastructure capacity; (2) disturbance condition, reflecting whether bursty events, sharp traffic surges, or degraded resource states are present. These variables allow the scheduler to distinguish between routine and stressed operating regimes.
4.3 Action Space Design
At each interval , the scheduler produces a joint decision set
The action space includes (1) admission control, full admission, partial admission, or deferral of slice demand. (2) radio-resource allocation, communication-resource assignment across slices and access nodes. (3) edge-resource allocation, computing-resource assignment across slices and edge nodes. (4) activity-state control, deciding which access and edge resources remain active or enter reduced-activity states. (5) priority adaptation, dynamic priority adjustment through urgency-based allocation rules.
4.4 Multi-Objective Scheduling Signal Design
Because the scheduling problem is multi-objective, the proposed method defines a composite scheduling value to balance service utility, energy cost, SLA risk, fairness, and resilience. For a candidate action , define the instantaneous scheduling value as:
where are tunable trade-off parameters. To strengthen protection of critical slices, an additional critical-service loss penalty is introduced:
where denotes the set of highly critical slices. The resulting decision signal becomes where is the critical-service protection coefficient.
4.5 Core Scheduling Algorithm
To solve the dynamic scheduling problem efficiently, this paper adopts a hierarchical intelligent scheduling strategy composed of a priority-evaluation stage and a resource-allocation stage.
4.5.1 Stage I: Service-aware priority evaluation
In the first stage, the scheduler computes the urgency score for each slice. This produces a real-time ranking of slices based on criticality and performance stress. The ranking is then used to define three operational tiers: (1) Tier I: critical-protection slices, which must be protected against severe delay and reliability degradation; (2) Tier II: performance-sensitive slices, which should receive adaptive support under moderate-to-high load; (3) Tier III: elastic slices, which may tolerate controlled degradation or deferred service when capacity is limited. This tiering process is dynamic rather than fixed. For example, a demand-response slice may temporarily move into a higher urgency tier during an active response event, while routine monitoring traffic may remain in a lower tier under the same conditions.
4.5.2 Stage II: Resource allocation and activity adjustment
After the slice priorities are evaluated, the scheduler allocates radio and edge resources in descending order of urgency, subject to capacity and activity-state constraints. Let denote the ranking position of slice at interval , where smaller values indicate higher priority. The allocation policy follows three rules. (1) Critical-service protection rule, e.g., slices in the highest urgency tier receive sufficient resource support to minimize severe SLA violations whenever feasible. (2) Utility-efficiency balancing rule, e.g., for noncritical slices, additional resources are allocated only when the expected utility gain exceeds the associated energy and opportunity cost. (3) Controlled degradation rule, e.g., under overload or disturbance conditions, lower-tier slices may receive reduced allocation or partial admission to preserve global system stability. A marginal value score is used to guide incremental allocation:
where and are balancing coefficients. Intuitively, quantifies whether allocating additional resource to slice yields sufficient utility gain relative to the induced energy cost. Resource activation decisions are then made by comparing the expected service benefit of activating additional access or edge resources against their idle and switching energy costs. A dormant resource is activated only if the projected reduction in critical-service loss or overall utility degradation exceeds the energy penalty associated with activation.
4.5.3 Stage III: Post-allocation consistency adjustment
Because greedy or urgency-driven allocation may create local imbalance, a consistency-adjustment stage is applied after the primary allocation. This stage checks whether critical slices remain exposed to severe violation; lower-priority slices are starved excessively; active resources are underutilized; switching decisions are oscillatory. If such conditions are detected, the scheduler performs bounded reallocation or reverses unstable activity-state changes.
4.6 Resilience-Aware Adaptation Mechanism
A major design goal of the proposed scheduler is to maintain acceptable operation not only in routine conditions but also under bursty or degraded scenarios.
4.6.1 Disturbance detection
At each interval, the scheduler evaluates whether the system has entered a stressed condition. A disturbance flag is defined based on criteria such as rapid growth in aggregate arrival demand, sudden increase in critical-slice urgency, sharp reduction in available resource capacity, or persistent SLA violations over consecutive intervals. If any criterion exceeds a predefined threshold, the disturbance flag is set to 1.
4.6.2 Disturbance-response policy
When , the scheduler temporarily shifts from efficiency-oriented balancing to resilience-oriented protection. Specifically, it applies the following actions: (1) increase the effective weight of critical slices; (2) tighten admission control for elastic traffic; (3) activate additional communication or edge resources if necessary; (4) suppress unnecessary activity-state switching to avoid instability; (5) preserve service continuity for critical functions even at the cost of higher short-term energy consumption. A simple disturbed-mode modification can be expressed as
where is the resilience-emphasis factor.
4.6.3 Recovery transition
Once the disturbance subsides, the scheduler transitions gradually back to normal operating mode to avoid oscillation and preserve performance during recovery.
4.7 Algorithm Procedure and Pseudocode
The overall scheduling procedure is summarized as follows.
| Algorithm 1 Service-aware and energy-aware intelligent slice scheduling |
| Input: Current state , slice descriptors , resource capacities, trade-off parameters |
| Output: Scheduling decision set |
|
1. Observe current traffic, backlog, delay, reliability, and resource states. 2. Compute slice urgency scores for all . 3. Evaluate system load tightness and disturbance flag . 4. If , activate resilience-aware weighting and disturbed-mode protection rules. 5. Rank slices according to urgency and effective criticality. 6. Determine admission levels based on current load and service tier. 7. Allocate radio resources subject to access-layer capacity constraints. 8. Allocate edge resources subject to computing capacity constraints. 9. Decide activity states and based on benefit-cost comparison. 10. Apply consistency adjustment to remove severe imbalance or unstable switching. 11. Execute the scheduling decision . 12. Update queue states, performance indicators, utility, fairness, resilience, and energy consumption for interval . |
This procedure provides an interpretable framework that can be implemented with heuristic optimization, rule-guided learning, or reinforcement learning extensions. For the purpose of this paper, the algorithm serves as a structured intelligent scheduler rather than a purely black-box controller.
4.8 Complexity and Real-Time Feasibility Analysis
The proposed scheduler is more efficient than exhaustive joint optimization over all decision combinations. Let , , and denote the numbers of slices, access nodes, and edge nodes, respectively. Urgency-score computation is approximately linear in the number of slices. Under urgency-sorted incremental allocation, the main computational burden is associated with sorting and resource assignment, which remains polynomial in system size. The activity-adjustment and consistency-correction steps add moderate overhead.
From an engineering perspective, three features improve real-time feasibility: (1) the scheduler operates on aggregated slice-level states rather than packet-level states; (2) the decision pipeline is hierarchical rather than fully joint and exhaustive; (3) disturbed-mode adaptation is triggered conditionally rather than continuously. These properties make the proposed method well suited for deployment in edge-assisted or controller-assisted 5G-Advanced smart grid communication infrastructures.
5 Experimental Design and Evaluation Methodology
This section presents the evaluation methodology used to validate the proposed intelligent slice-scheduling framework. The experiments are designed to compare overall performance across scheduling methods, quantify the energy-efficiency–performance trade-off, verify service-class-aware behavior, and assess robustness under event-driven and degraded operating conditions.
5.1 Evaluation Objectives
The experiments address five questions: (1) whether the proposed method improves the balance between communication performance and infrastructure energy consumption relative to benchmark schedulers; (2) whether it differentiates effectively among heterogeneous smart-energy services; (3) how it behaves under nonstationary traffic conditions such as demand-response surges and renewable-coordination fluctuations; (4) whether it preserves resilience under degraded operating conditions; (5) whether it remains practically feasible in terms of complexity, ablation behavior, and parameter sensitivity. Accordingly, the evaluation framework combines normal-operation benchmarking, event-driven scenario analysis, degraded-mode analysis, ablation study, and sensitivity analysis.
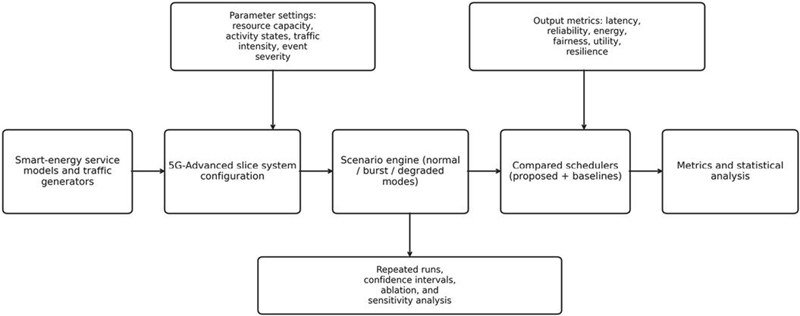
Figure 4 Experimental design and evaluation workflow.
Figure 4 summarizes the evaluation pipeline, including service modeling, system configuration, scenario generation, scheduler comparison, and statistical analysis.
5.2 Simulation and System Configuration
A discrete-time system-level simulation environment is used to emulate a 5G-Advanced smart-energy communication infrastructure with heterogeneous logical slices. The simulated system includes multiple access nodes, multiple edge-computing nodes, and a slice orchestrator operating at each scheduling interval. The workload consists of the five service classes defined in Section 2, instantiated as five logical slices with distinct demand patterns, delay sensitivity, reliability requirements, and criticality levels. The model includes both radio-resource and edge-computing capacity constraints, as well as activity-state control for access and edge nodes. The energy model follows Section 3, including baseline and load-dependent power consumption together with switching penalties. Each experimental condition is evaluated over repeated scheduling intervals and multiple independent runs, enabling statistically stable comparison of delay, reliability, energy consumption, service utility, fairness, and resilience.
Table 3 Experimental parameters and system settings
| Category | Parameter | Value/Setting |
| Topology | Number of access nodes (B) | 4 gNBs |
| Topology | Number of edge nodes (E) | 2 edge nodes |
| Topology | Scheduling horizon | 24 h equivalent workload/multi-interval simulation |
| Topology | Radio-resource capacity | Normalized capacity of 1.0 per access node |
| Topology | Edge-computing capacity | Normalized capacity of 1.0 per edge node |
| Slices | Number of service slices (S) | 5 |
| Slices | Slice types | Protection/control, demand response, DER coordination, AMI/monitoring, video-assisted inspection |
| Slices | Admission mode | Full admission, partial admission, or deferral |
| Slices | Protection/control slice descriptor | Highest criticality; ultra-low delay target; very high reliability target; low bandwidth demand; very low degradation tolerance |
| Slices | Demand-response slice descriptor | High criticality; low-to-moderate delay target; high reliability target; bursty event-driven traffic; low degradation tolerance during event windows |
| Slices | DER coordination slice descriptor | High criticality; low-to-moderate delay target; high reliability target; moderate resource demand; variable update-driven traffic |
| Slices | AMI/monitoring slice descriptor | Medium criticality; delay-tolerant; moderate reliability target; low per-device resource demand; large-scale periodic traffic |
| Slices | Video-assisted inspection slice descriptor | Medium criticality; moderate delay target; moderate reliability target; high bandwidth demand; moderate degradation tolerance |
| Traffic | Traffic arrival process | Service-specific time-varying arrival traces |
| Traffic | Protection/control traffic | Persistent low-volume traffic with occasional event-triggered increase |
| Traffic | Demand-response traffic | Bursty event-window traffic with high temporary arrival intensity |
| Traffic | DER coordination traffic | Variable update-driven traffic with moderate-to-high fluctuation |
| Traffic | AMI/monitoring traffic | Periodic or quasi-periodic large-scale reporting traffic |
| Traffic | Video-assisted inspection traffic | Sustained or bursty high-volume traffic |
| Traffic | Load scaling factor | 0.6–1.6 nominal load |
| Traffic | Burst/event injection | Demand-response surge, DER coordination fluctuation, critical-service stress, and degraded-capacity scenarios |
| Scheduling | Scheduling interval | One slice-orchestration decision epoch |
| Scheduling | Resource allocation granularity | Slice-level radio and edge resource units |
| Scheduling | Repeated runs | 30 independent runs |
| Energy model | Access-node energy model | Normalized baseline active power plus load-dependent power |
| Energy model | Edge-node energy model | Normalized baseline active power plus processing-dependent power |
| Energy model | Switching penalty | Included for access-node and edge-node activation/deactivation |
| Energy model | Energy normalization | Energy values normalized relative to the nominal mixed-service operating condition |
| Utility/objective | Service utility components | Delay satisfaction, reliability satisfaction, served traffic, and service criticality |
| Utility/objective | Service criticality weighting | Highest for protection/control; high for demand response and DER coordination; medium for AMI and video inspection |
| Utility/objective | Fairness metric | Jain-type inter-slice fairness index |
| Utility/objective | Resilience metric | Critical-service SLA retention, degradation depth, and recovery speed under disturbed or degraded operation |
| Disturbance setting | Demand-response event | Temporary burst increase in demand-response traffic during event window |
| Disturbance setting | Degraded-capacity event | Temporary reduction in available radio and/or edge-computing capacity during disturbance interval |
| Disturbance setting | Recovery measurement | Number of scheduling intervals required for critical-service SLA and resilience score to return toward normal operating range |
| Evaluation | Confidence intervals | 95% confidence intervals over repeated runs |
| Evaluation | Ablation settings | Without energy-awareness; without utility-awareness; without resilience adaptation |
| Evaluation | Sensitivity dimensions | Load, objective weights, resource capacity, and event severity |
Table 3 summarizes the main simulation assumptions, including the number of access and edge nodes, number of slices, admission mode, traffic setup, energy model settings, scheduling interval, repeated runs, and sensitivity dimensions. All resource, traffic, utility, and energy quantities are normalized because the purpose of the evaluation is to compare scheduling behavior at the system level rather than to reproduce a vendor-specific 5G deployment. The same normalized parameter configuration is used for all compared scheduling methods. Therefore, the evaluation focuses on relative differences in SLA satisfaction, energy consumption, service utility, fairness, and resilience under identical traffic and resource conditions. In the degraded-capacity scenario, the available radio and/or edge-computing capacity is reduced during a predefined disturbance window and restored afterward; recovery is measured by the time required for critical-service SLA satisfaction and resilience indicators to return toward the normal operating range.
5.3 Smart-Energy Test Scenarios
The experiments use five representative smart-energy scenarios to evaluate the proposed scheduling framework under both routine and stressed operating conditions. In all cases, protection and control traffic is modeled as persistent and highly time-sensitive, demand-response traffic as bursty and event-driven, DER coordination traffic as variable, AMI and periodic monitoring traffic as large-scale and delay-tolerant, and video-assisted inspection traffic as bandwidth-intensive. The first scenario represents normal mixed-service operation and serves as the baseline. The second introduces a temporary demand-response traffic surge. The third emphasizes DER and renewable coordination under fluctuating conditions. The fourth introduces transient stress on highly critical traffic, especially protection and control services. The fifth evaluates degraded-capacity operation by partially reducing communication and/or computing resources. In the degraded-capacity scenario, a temporary infrastructure degradation is introduced by reducing the available radio and/or edge-computing capacity during a fixed event window. Unless otherwise stated, the degraded condition reduces the available communication and computing capacity by a predefined percentage during the disturbance interval, after which capacity is restored to the nominal level. This scenario emulates partial access-node overload, edge-resource unavailability, or constrained service-support capacity during abnormal operating conditions. In the default degraded-capacity case, 30% of radio-resource capacity and 20% of edge-computing capacity are unavailable for 10 scheduling intervals.
5.4 Baseline Methods
The proposed method is compared against multiple baselines representing different scheduling philosophies: (1) Static equal-allocation strategy; fixed proportional split across slices without dynamic adaptation. (2) Priority heuristic; fixed service-class ranking. (3) Throughput-oriented scheduler; allocates resources to maximize carried load or aggregate throughput. (4) Energy-minimization scheduler; aggressively reduces active resources to minimize energy expenditure. (5) Service-unaware intelligent scheduler; adapts to traffic and system state but does not explicitly model smart-energy utility differentiation or resilience-oriented disturbed-mode adaptation.
Table 4 Baseline methods and comparison rationale
| Baseline | Core Principle | Strength/Purpose |
| Static equal allocation | Fixed proportional resource split across slices | Reference for non-adaptive operation |
| Priority heuristic | Static priority ordering by service class | Reference for conventional utility-style prioritization |
| Throughput-oriented scheduler | Allocate resources to maximize carried load/ throughput | Tests pure performance bias |
| Energy-minimization scheduler | Aggressively minimize active resources and energy use | Tests pure efficiency bias |
| Service-unaware intelligent scheduler | Adaptive scheduling without smart-energy utility awareness | Isolates value of utility and resilience modeling |
| Proposed method | Service-aware, energy-aware, and resilience-aware scheduling | Target method under evaluation |
Table 4 summarizes the compared schedulers, their core principles, and the purpose of including each one in the evaluation.
5.5 Evaluation Metrics
The proposed method is evaluated using three complementary categories of metrics: communication metrics, energy-efficiency metrics, and service/system-level metrics. Communication performance is assessed using end-to-end delay, achieved reliability, and SLA satisfaction, where delay captures the timeliness of service delivery, reliability reflects the probability of successful or SLA-compliant service, and the SLA satisfaction ratio measures the proportion of intervals or service instances that meet both delay and reliability requirements. Infrastructure efficiency is quantified through total network energy consumption, average power usage, and energy expenditure per unit of successfully delivered service, since the proposed method explicitly aims to reduce infrastructure energy usage while maintaining communication quality. To capture the operational objectives of smart-grid communication infrastructures, the evaluation also includes service utility, fairness, and resilience. Service utility reflects the criticality-aware communication value achieved by each slice, fairness measures whether lower-priority slices are systematically starved, and resilience is assessed through degraded-mode service continuity, critical-service protection, and recovery-oriented behavior. Taken together, these metrics allow the experiments to evaluate not only whether the scheduler is efficient, but also whether it is operationally suitable for mixed-critical smart-energy environments. The resilience score reported in the results is therefore not intended to represent physical power-grid resilience. It represents communication-service continuity and recovery behavior under degraded communication or computing capacity.
5.6 Statistical and Analytical Rigor
Each experimental condition is evaluated over multiple independent runs. Reported results are therefore based on repeated simulation with variability arising from traffic realization, event timing, and resource contention. Confidence intervals are used where appropriate. In addition to direct method comparison, the evaluation includes (1) ablation analysis, to isolate the contribution of key design components such as energy awareness, service-utility awareness, and resilience adaptation; (2) sensitivity analysis, to assess the influence of traffic load, objective weighting, resource capacity, and event severity; (3) complexity-oriented analysis, to examine the computational viability of the method under increasing system size.
6 Results and Discussion
This section presents the evaluation results of the proposed intelligent slice-scheduling framework from multiple perspectives, including overall performance, service-class-aware behavior, energy-efficiency–performance trade-offs, event-driven adaptability, degraded-mode resilience, and component-level contribution.
6.1 Overall Performance Comparison Under Normal Mixed-Service Operation
The first set of results compares the proposed method with the benchmark schedulers under normal mixed-service operating conditions.
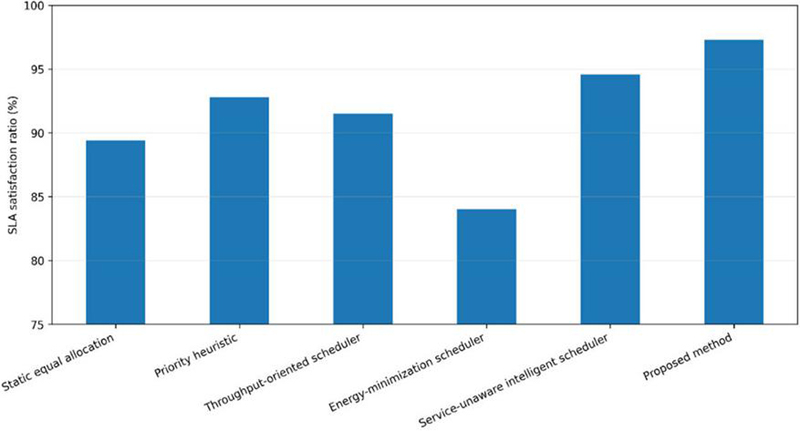
Figure 5 Overall SLA satisfaction under normal mixed-service operation.
Table 5 Main quantitative comparison under normal mixed-service operation
| Method | Avg Delay (ms) | Reliability (%) | SLA Satisfaction (%) | Energy Consumption (norm.) | Utility Score (norm.) | Fairness Index | Resilience Score |
| Static equal allocation | 19.6 | 96.2 | 89.4 | 1.08 | 0.78 | 0.88 | 0.77 |
| Priority heuristic | 14.8 | 97.8 | 92.8 | 1.02 | 0.84 | 0.81 | 0.82 |
| Throughput-oriented scheduler | 13.2 | 97.1 | 91.5 | 1.18 | 0.82 | 0.74 | 0.75 |
| Energy-minimization scheduler | 24.1 | 93.9 | 84 | 0.82 | 0.69 | 0.71 | 0.63 |
| Service-unaware intelligent scheduler | 11.7 | 98.4 | 94.6 | 0.97 | 0.88 | 0.86 | 0.86 |
| Proposed method | 8.9 | 99.2 | 97.3 | 0.91 | 0.94 | 0.9 | 0.92 |
As shown in Figure 5 and Table 5, the proposed method achieves the highest overall SLA satisfaction ratio among all compared strategies. Relative to static equal allocation and the fixed-priority heuristic, the gain indicates that non-adaptive resource partitioning and static service ranking are insufficient for heterogeneous smart-energy traffic. The improvement over the service-unaware intelligent scheduler further shows that explicit utility modeling and resilience-aware logic contribute beyond generic adaptive scheduling.
Table 5 also shows that the proposed method achieves the best or near-best values across multiple system-level indicators simultaneously, including lower average delay, higher reliability, higher SLA satisfaction, stronger fairness, better resilience, and lower normalized energy consumption than most non-efficiency-aware baselines. This supports the view that smart-energy slice scheduling should be treated as a multi-objective orchestration problem rather than as a single-metric optimization problem.
6.2 Service-Class-Oriented Performance Analysis
Because smart-grid communication infrastructures support mixed-critical services, aggregate results alone are insufficient.
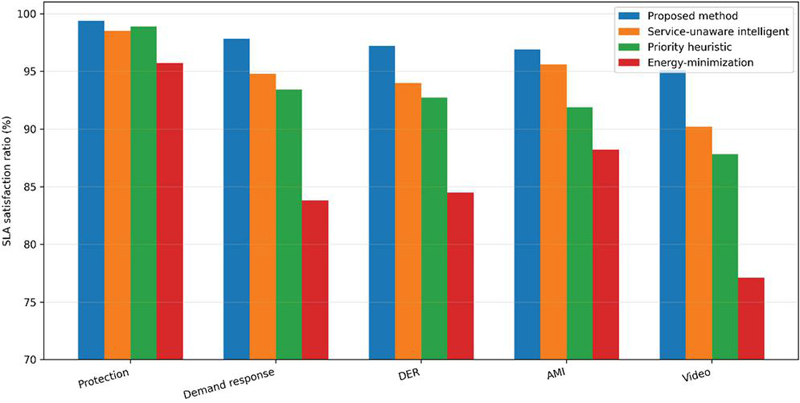
Figure 6 Service-class-oriented SLA satisfaction comparison.
Figure 6 shows that the proposed method provides the strongest protection for critical services while maintaining acceptable performance for less critical classes. The largest gain is observed for the protection and control slice, indicating that the criticality-aware urgency mechanism succeeds in preserving service integrity under heterogeneous load.
Demand-response and DER coordination slices also improve consistently, which suggests that the proposed method does not merely favor the most critical slice at the expense of all others. By contrast, the energy-minimization baseline shows substantial degradation across these slices, highlighting the risk of efficiency-first operation without mixed-criticality awareness. AMI and video-assisted monitoring remain at acceptable levels under the proposed method, consistent with the fairness results in Table 5.
6.3 Energy-Efficiency–Performance Trade-Off Analysis
A major contribution of the paper is the explicit treatment of the trade-off between infrastructure energy consumption and communication performance.
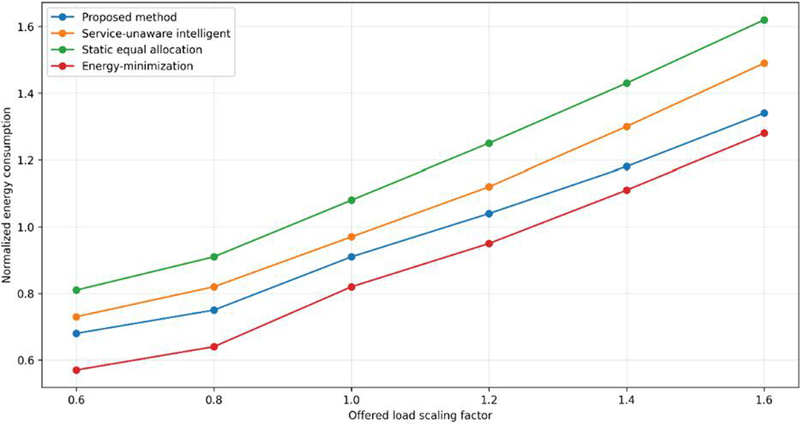
Figure 7 Infrastructure energy consumption under varying traffic load.
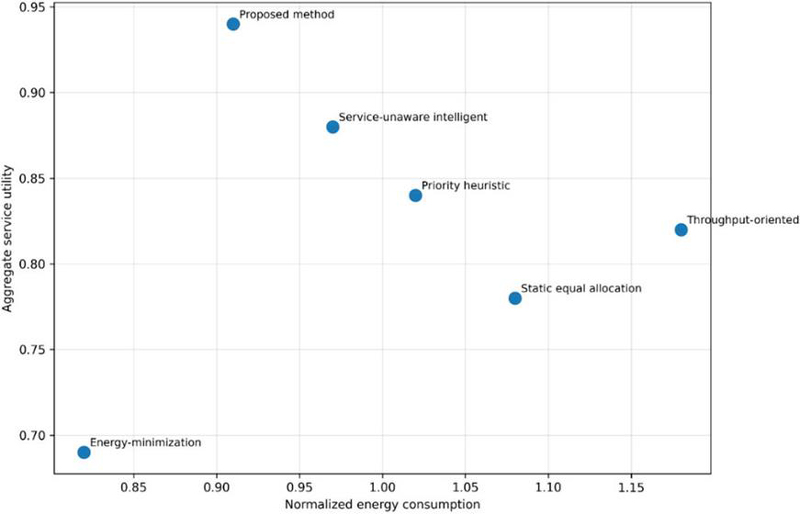
Figure 8 Energy-utility trade-off across compared scheduling methods.
Figure 7 shows that the proposed method consistently maintains lower normalized energy consumption than most performance-oriented baselines across the evaluated load range. Although the pure energy-minimization scheduler achieves the lowest energy usage overall, it does so at a major cost in delay, SLA satisfaction, and resilience.
Figure 8 further clarifies the trade-off structure by plotting normalized energy consumption against aggregate service utility. The proposed method occupies the most favorable region among the compared strategies, combining high service utility with relatively low energy expenditure. This indicates that the method improves the Pareto-like operating balance between efficiency and service value by adaptively deciding when additional resource activation is justified and when energy-saving actions are acceptable.
6.4 Dynamic Response Under Demand-Response Events
To test adaptability under nonstationary conditions, the next Section examines the scheduler’s behavior during a demand-response event window.
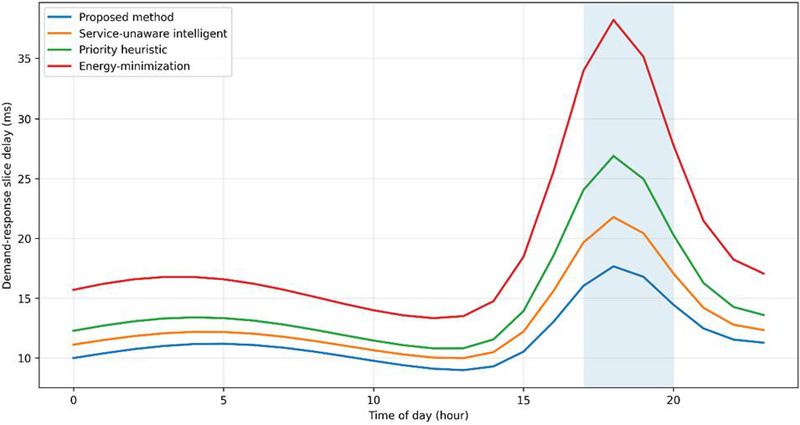
Figure 9 Dynamic delay response during a demand-response event window.
Figure 9 shows that all schedulers experience some increase in delay during the event window, but the proposed method exhibits the smallest delay spike and the fastest return toward the pre-event regime. The service-unaware intelligent scheduler performs second best, indicating that adaptive scheduling is valuable, but its delay peak remains higher than that of the proposed method.
Table 6 confirms this quantitatively. Under event conditions, the proposed method achieves the lowest demand-response event delay, the highest critical-slice SLA satisfaction, and the strongest event utility score, while still avoiding excessive energy escalation. This suggests that the scheduler can temporarily relax efficiency-oriented decisions and reallocate support to event-critical services when required.
Table 6 Results under demand-response event conditions
| DR Event | Critical-Slice | Event | Energy | |
| Method | Delay (ms) | SLA (%) | Utility (norm.) | (norm.) |
| Static equal allocation | 22.8 | 91.1 | 0.71 | 1.11 |
| Priority heuristic | 18.6 | 94.2 | 0.8 | 1.06 |
| Throughput-oriented scheduler | 19.9 | 92.4 | 0.77 | 1.2 |
| Energy-minimization scheduler | 31.4 | 85 | 0.58 | 0.84 |
| Service-unaware intelligent scheduler | 15.4 | 96.1 | 0.86 | 1 |
| Proposed method | 12.9 | 98.3 | 0.92 | 0.95 |
6.5 Resilience Under Degraded-Capacity Conditions
Normal-operation efficiency is not sufficient for critical infrastructures. The communication system must also continue to operate acceptably when resource availability is reduced.
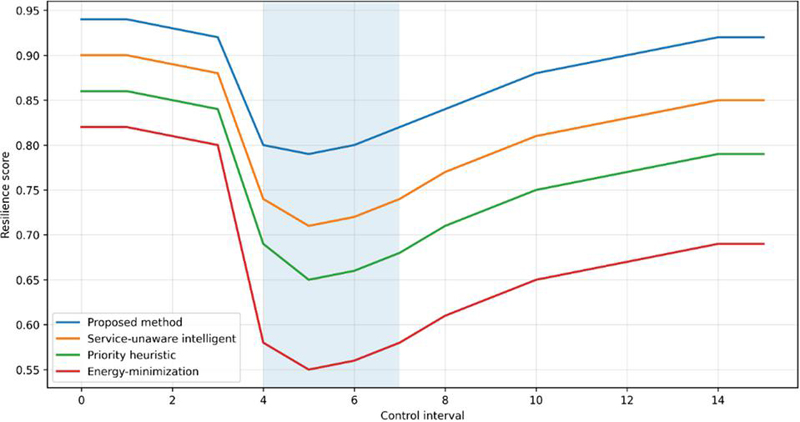
Figure 10 Resilience behavior under degraded-capacity operation.
Table 7 Results under degraded-capacity conditions
| Worst | Energy During | |||
| Resilience | Recovery | Critical-Service | Recovery | |
| Method | Score | Interval | SLA (%) | (norm.) |
| Static equal allocation | 0.77 | 6 | 88.5 | 1.13 |
| Priority heuristic | 0.72 | 7 | 91.4 | 1.11 |
| Throughput-oriented scheduler | 0.68 | 8 | 86.7 | 1.19 |
| Energy-minimization scheduler | 0.55 | 10 | 79.9 | 0.88 |
| Service-unaware intelligent scheduler | 0.71 | 7 | 93.6 | 1.05 |
| Proposed method | 0.79 | 5 | 96.8 | 1.01 |
The degraded interval begins at interval and lasts for scheduling intervals. During this window, the resource capacity available to all schedulers is reduced according to the degraded-capacity setting described in Section 5.3. Recovery interval is defined as the number of scheduling intervals required after capacity restoration for the resilience score and critical-service SLA satisfaction to return to the normal operating range.
Figure 10 shows that all methods experience a decline in resilience score when the degraded interval begins, but the proposed method suffers the smallest drop and recovers more rapidly than the alternatives. The difference is especially clear relative to the energy-minimization scheduler, whose resilience score falls substantially and remains low for longer.
Table 7 provides further evidence. The proposed method achieves the best worst-case resilience score, the shortest recovery interval, and the highest critical-service SLA satisfaction during degraded operation. Although its energy usage during recovery is somewhat higher than that of the pure energy-minimization scheduler, this increase is justified because the scheduler deliberately activates additional support to preserve system integrity.
6.6 Ablation Study
To isolate the contribution of the key components of the proposed framework, an ablation study is conducted by removing one major mechanism at a time. Each ablated variant keeps the same traffic traces, resource capacities, baseline parameters, and scheduling horizon as the full proposed method. The only difference is the removal of one functional component. In the “without energy-awareness” variant, the activity-state benefit-cost rule is disabled and resource activation is not penalized by energy cost. In the “without utility-awareness” variant, service-specific utility weights are replaced by generic communication performance terms, so the scheduler no longer distinguishes smart-grid operational value across slices. In the “without resilience adaptation” variant, disturbed-mode weighting, critical-service protection enhancement, and recovery-transition logic are disabled. Therefore, the ablation study isolates the contribution of each design component under otherwise identical simulation conditions.
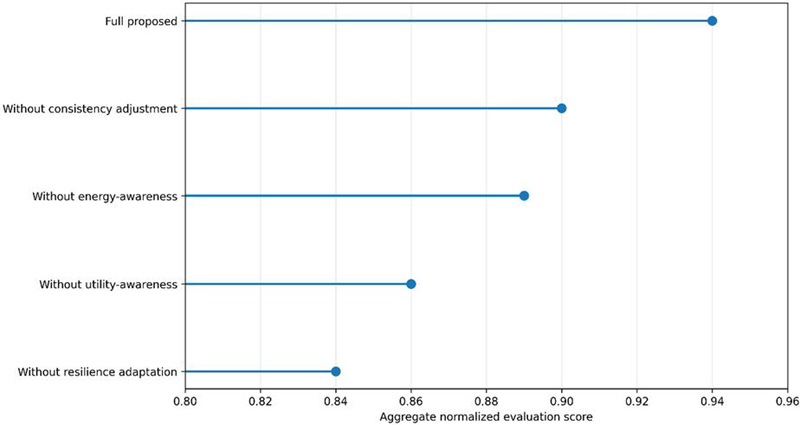
Figure 11 Ablation study of the proposed scheduling framework.
Table 8 Ablation and sensitivity summary
| Setting | Aggregate Score | Key Observation |
| Full proposed method | 0.94 | Best overall balance across energy, QoS, fairness, and resilience |
| Without energy-awareness | 0.89 | Higher energy use with modest utility gain |
| Without utility-awareness | 0.86 | Critical-service differentiation weakens |
| Without resilience adaptation | 0.84 | Recovery and degraded-mode protection degrade most strongly |
| Without consistency adjustment | 0.9 | Some imbalance and unstable decisions remain |
| High-load + high-energy-weight regime | 0.79 | Expected trade-off tightening under stressed configuration |
Figure 11 shows that the full proposed method achieves the highest aggregate evaluation score. Removing energy-awareness causes a clear decline, demonstrating that infrastructure-activity control is an integral component. Removing utility-awareness produces a larger decline, indicating that explicit modeling of smart-energy service value improves decision quality. The most severe degradation occurs when resilience adaptation is removed, which is consistent with the degraded-capacity results. Removing the consistency-adjustment stage also reduces performance, though less dramatically, suggesting that this stage improves stability and fairness.
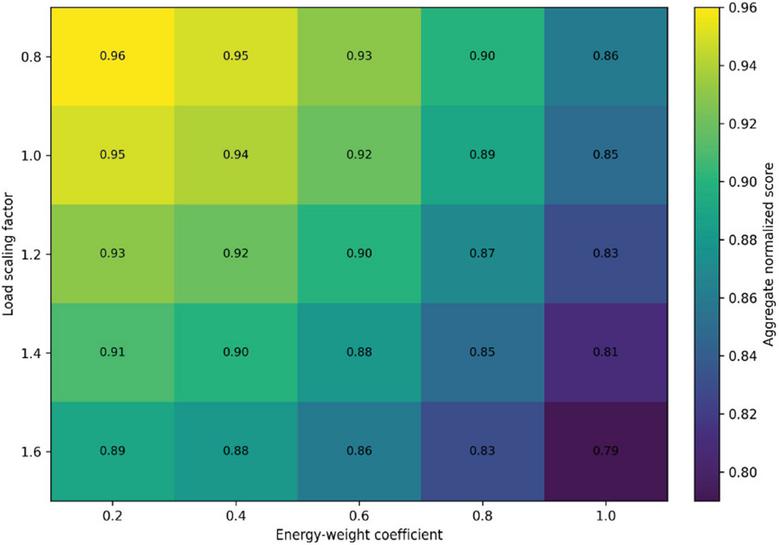
Figure 12 Sensitivity of aggregate score to load and energy-weight settings.
As shown in Table 8, the largest performance reduction occurs when resilience adaptation is removed, indicating that disturbed-mode protection is particularly important for degraded-capacity and event-driven smart-grid communication scenarios. These results strengthen the novelty claim by showing that the proposed framework’s major components each contribute distinct value.
6.7 Sensitivity Analysis
To examine robustness, the final result perspective evaluates how the proposed method behaves under changes in offered load and in the weighting assigned to energy efficiency within the objective.
Figure 12 shows that the aggregate normalized score gradually declines as either traffic load or the energy-weight coefficient increases. This behavior is consistent with the expected tightening of the energy-efficiency–performance trade-off. Importantly, the decline is gradual rather than abrupt, indicating that the method remains stable and tunable across a reasonably broad parameter range.
This result suggests that the method is promising for further validation in practical edge-assisted or controller-assisted orchestration environments and also provides engineering guidance: operators can tune the scheduler toward stronger efficiency or stronger performance protection depending on operational priorities, but overly aggressive energy weighting under high load should be avoided.
6.8 Engineering Significance and Practical Deployment Considerations
Taken together, the results show that the proposed method improves the balance among delay, reliability, energy consumption, utility, fairness, and resilience in mixed-critical smart-grid communication environments. It protects highly critical services more effectively than the benchmark methods while maintaining acceptable performance for less critical traffic, and it responds well to demand-response bursts and degraded-capacity conditions.
In a practical deployment, the scheduler could reside in the network slice orchestrator, an edge-assisted control function, or a utility communication management platform. The required inputs are aggregate slice-level measurements, including traffic arrival intensity, queue/backlog state, delay and reliability indicators, resource utilization, node activity states, and service descriptors such as criticality class and SLA target. The scheduler output would include slice admission decisions, radio-resource allocation, edge-resource allocation, priority adjustment, and activity-state control commands. Because the method operates at the slice-control interval rather than at the packet-scheduling timescale, it is more suitable for orchestration-level adaptation than for physical-layer scheduling.
From a deployment perspective, the framework is suitable for implementation at the slice orchestrator, edge controller, or utility communication management layer, where aggregate slice-level state information is available. Because the scheduler operates on interval-based observations rather than packet-level optimization, its computational burden is compatible with practical orchestration timescales. In addition, it relies primarily on communication-side measurements and service descriptors, such as backlog status, resource utilization, delay indicators, reliability estimates, and service criticality classes, which makes deployment more feasible without requiring full physical-grid co-optimization.
6.9 Limitations and Future Work
This study has several limitations. First, the evaluation is based on normalized system-level simulation rather than field deployment or hardware-in-the-loop testing. Second, PHY effects, packet-level retransmission, channel stochasticity, and vendor-specific radio behavior are abstracted into slice-level service-rate and reliability functions. Third, backhaul and transport-network effects are represented through aggregate service-support capacity rather than detailed topology modeling. Fourth, the energy model captures baseline, load-dependent, and switching-related energy costs, but it does not represent hardware-specific power behavior. Fifth, the traffic models are representative of smart-grid service classes rather than derived from large-scale operational utility traces. Finally, the framework focuses on communication-infrastructure scheduling and does not perform full co-simulation with physical-grid dynamics. Future work should address these limitations through realistic utility traffic traces, hardware-in-the-loop validation, pilot deployment, and tighter integration with standards-aligned slice-management procedures.
7 Conclusion
This paper investigated resource scheduling for 5G-Advanced network slicing in smart-grid communication infrastructures under energy-efficiency and performance trade-offs. The proposed framework maps heterogeneous smart-grid services, including protection and control, demand response, DER coordination, AMI, and video-assisted monitoring, to differentiated logical slices and coordinates admission control, radio-resource allocation, edge-resource allocation, activity-state control, and disturbed-mode adaptation.
Simulation results show that the proposed service-aware, energy-aware, and resilience-aware scheduler achieves a stronger balance among SLA satisfaction, normalized energy consumption, service utility, fairness, and resilience than the compared benchmark strategies. In particular, the method improves protection of critical services, reduces delay escalation during demand-response events, and supports faster recovery under degraded-capacity conditions.
These results suggest that smart-grid slice scheduling should not rely on a single objective such as throughput maximization or energy minimization alone. Instead, service criticality, communication performance, infrastructure energy use, and resilience behavior should be considered jointly. Future work will focus on validation with realistic utility traffic traces, more PHY and transport-network models, hardware-in-the-loop or pilot testing, and closer integration with Third Generation Partnership Project (3GPP)-aligned slice-management procedures and utility communication standards.
References
[1] Lin, X. (2022). An overview of 5G advanced evolution in 3GPP release 18. IEEE Communications Standards Magazine, 6(3), 77–83.
[2] Chen, W., Lin, X., Lee, J., Toskala, A., Sun, S., Chiasserini, C. F., and Liu, L. (2023). 5G-Advanced towards 6G: Past, present, and future. IEEE Journal on Selected Areas in Communications, 41(6), 1592–1619.
[3] Foukas, X., Elmokashfi, A., Patounas, G., and Marina, M. K. (2017). Network slicing in 5G: Survey and challenges. IEEE Communications Magazine, 55(5), 94–100.
[4] Zhang, S. (2019). An overview of network slicing for 5G. IEEE Wireless Communications, 26(3), 111–117.
[5] Barakabitze, A. A., Ahmad, A., Mijumbi, R., and Hines, A. (2020). 5G network slicing using SDN and NFV: A survey of taxonomy, architectures and future challenges. Computer Networks, 167, 106984.
[6] Su, R., Zhang, D., Venkatesan, R., Gong, Z., Li, C., Ding, F., Jiang, F., and Zhu, Z. (2019). Resource allocation for network slicing in 5G telecommunication networks: A survey of principles and models. IEEE Network, 33(6), 172–179.
[7] Banchs, A., de Veciana, G., Sciancalepore, V., and Costa-Pérez, X. (2020). Resource allocation for network slicing in mobile networks. IEEE Access, 8, 214696–214706.
[8] Subedi, P., Alsadoon, A., Prasad, P. W. C., Rehman, S., Giweli, N., Imran, M., and Arif, S. (2021). Network slicing: A next generation 5G perspective. EURASIP Journal on Wireless Communications and Networking, 102.
[9] Lorincz, J., Kukuruzović, A., and Blažević, Z. (2024). A comprehensive overview of network slicing for improving the energy efficiency of fifth-generation networks. Sensors, 24(10), 3242.
[10] Tipantuña, C., and Hesselbach, X. (2020). Adaptive energy management in 5G network slicing: Requirements, architecture, and strategies. Energies, 13(15), 3984.
[11] Matthiesen, B., Aydin, O., and Jorswieck, E. A. (2018). Throughput and energy-efficient network slicing. In Proceedings of the 22nd International ITG Workshop on Smart Antennas (WSA) (pp. 1–6). Bochum, Germany.
[12] Thantharate, A., Tondwalkar, A. V., Beard, C., and Kwasinski, A. (2022). ECO6G: Energy and cost analysis for network slicing deployment in beyond 5G networks. Sensors, 22(22), 8614.
[13] Li, Z., Wang, J., Wang, Y., Meng, S., Wu, S., Ding, H., and Wang, Z. (2021). Trade-off analysis between delay and throughput of RAN slicing for smart grid. Computer Communications, 180, 21–30.
[14] Saibharath, S., Mishra, S., and Hota, C. (2023). Joint QoS and energy-efficient resource allocation and scheduling in 5G network slicing. Computer Communications, 202, 110–123.
[15] Abidi, M. H., Alkhalefah, H., Moiduddin, K., Alazab, M., Mohammed, M. K., Ameen, W., and Gadekallu, T. R. (2021). Optimal 5G network slicing using machine learning and deep learning concepts. Computer Standards & Interfaces, 76, 103518.
[16] Tian, Y., Dong, Y., and Feng, X. (2023). Deep learning-based multi-domain framework for end-to-end services in 5G networks. Journal of Grid Computing, 21, 77.
[17] Botez, R., Pasca, A.-G., Sferle, A.-T., Ivanciu, I.-A., and Dobrota, V. (2023). Efficient network slicing with SDN and heuristic algorithm for low latency services in 5G/B5G networks. Sensors, 23(13), 6053.
[18] Chandrasekaran, Y. J., Gunamony, S. L., and Chandran, B. P. (2019). Integration of 5G technologies in smart grid communication – A short survey. International Journal of Renewable Energy Development, 8(3), 275–283.
[19] Hui, H., Zhou, C., An, S., and Lin, F. (2020). 5G network-based internet of things for demand response in smart grid: A survey on application potential. Applied Energy, 257, 113972.
[20] Sun, D., Ou, Q., Yao, X., Gao, S., Wang, Z., Ma, W., and Li, W. (2020). Integrated human-machine intelligence for EV charging prediction in 5G smart grid. EURASIP Journal on Wireless Communications and Networking, 139.
[21] Dorsch, N., Kurtz, F., and Wietfeld, C. (2018). On the economic benefits of software-defined networking and network slicing for smart grid communications. NETNOMICS, 19, 1–30.
[22] Chen, J., Zhu, H., Chen, L., Li, Q., Bian, B., and Xia, X. (2021). 5G enabling digital transformation of smart grid: A review of pilot projects and prospect. In 2021 IEEE/CIC International Conference on Communications in China Workshops (pp. 353–357).
[23] Almasarani, A., Kumar, C. R., and Majid, M. A. (2021). 5G-wireless sensor networks for smart grid – Accelerating technology’s progress and innovation in the Kingdom of Saudi Arabia. Procedia Computer Science, 191, 1094–1101.
[24] Hu, Y., Gong, L., Li, X., Li, H., Zhang, R., and Gu, R. (2023). A carrying method for 5G network slicing in smart grid communication services based on neural network. Future Internet, 15(7), 247.
[25] Overbeck, D., Kurtz, F., Böcker, S., and Wietfeld, C. (2022). Design of a 5G network slicing architecture for mixed-critical services in cellular energy systems. In 2022 IEEE International Conference on Communications, Control, and Computing Technologies for Smart Grids (SmartGridComm) (pp. 90–95).
[26] Carrillo, D., Kalalas, C., Raussi, P., Michalopoulos, D. S., Rodríguez, D. Z., Kokkoniemi-Tarkkanen, H., Ahola, K., Nardelli, P. H. J., Fraidenraich, G., and Popovski, P. (2023). Boosting 5G on smart grid communication: A smart RAN slicing approach. IEEE Wireless Communications, 30(5), 170–178.
[27] Jafary, P., Supponen, A., and Repo, S. (2022). Network architecture for IEC61850-90-5 communication: Case study of evaluating R-GOOSE over 5G for communication-based protection. Energies, 15(11), 3915.
[28] Boeding, M., Scalise, P., Hempel, M., Sharif, H., and Lopez, J., Jr. (2024). Toward wireless smart grid communications: An evaluation of protocol latencies in an open-source 5G testbed. Energies, 17(2), 373.
Biography

Zhang Xianyang is affiliated with the School of Automation, Huazhong University of Science and Technology. His research interests include multi-agent collaborative decision-making, reinforcement learning, intelligent optimization algorithms, and network resource management. His work centers on resource scheduling and performance optimization in complex dynamic environments, with particular emphasis on the application of artificial intelligence technologies in next-generation communication networks and intelligent systems.
Journal of ICT Standardization, Vol. 14_3, 461–506
doi: 10.13052/jicts2245-800X.1437
© 2026 River Publishers