Policy Making in Smart Cities:
Standardizing City’s Energy Efficiency with Task-Based Modelling
L. Anthopoulos1,*, G. Giannakidis2
- 1Associate Professor, University of Applied Science (TEI) of Thessaly, Greece
- 2Center for Renewable Energy Sources and Saving, Greece
E-mail: lanthopo@teilar.gr; ggian@cres.gr
*Corresponding Author
Received 20 January 2017;
Accepted 8 March 2017
Abstract
Several competitive standards have been introduced, which define smart city’s development framework, architecture and components or city’s key performance indicators. However, these standards have not introduced specifications for smart services, nor for policy making process modelling, although standardization assists in achieving process automation by introducing “best practices” as standard process models. Policy making mainly follow non-standardized procedures, even if it is supported by various typical methodologies (i.e., Multi-Criteria Decision Methods (MCDM)). This paper is inspired by the Task-Based Modelling method (TBM) and focuses on policy making process standardization for smart cities. More specifically, in introduces a TBM schema for policy making regarding city’s energy efficiency, which an important smart city aspect. This TBM is based on the outcomes of the case-study of the Integrative Smart City Planning (InSmart) coordination action in the smart city of Trikala, Greece.
Keywords
- Standardization
- smart city
- policy making
- decision making
- case study
- TBM
1 Introduction
Smart city has evolved since its initial appearance in 1996 to an emerging market and to a multidisciplinary scientific domain. Quite recently, most standardization bodies around the globe have introduced several competitive standards in their attempt to clarify the smart city and corresponding industrial products. However, standardization has left out so far smart service modelling as well as corresponding policy making. For instance, smart city owners (e.g., municipalities and project coalitions etc.) claim that smart urban solutions address significant challenges (i.e., climate change and local growth etc.) and in this respect, they plan corresponding policies that deal with city’s energy efficiency and sustainability. Such policy making is mainly supported by decision making tools (i.e., Multi-Criteria Decision Methods (MCDM)) and has not been modelled yet. This lack in standardization mainly occurs due to the broad context of city policy making and due to the extensive scope of smart services.
This paper addresses the above problem and aims to discuss the policy making process that deals with one of the most important smart city challenges: city’s energy efficiency. In this regard, this paper aims to provide with answers the following research questions:
- RQ1: do existing smart city standards provide guidelines for city’s energy efficiency policy making?
- RQ2: how can policy making for smart city’s energy efficiency be modelled and standardized?
Both the above questions are very important to be answered, since smart cities and corresponding standards are being evolved, while several energy efficiency solutions appear to deal with city’s sustainability. In this respect, it is important for standards to cover important smart city issues that have not been addressed yet. Moreover, recent studies [1] show that the urban system is so complex that existing eco-friendly solutions can succeed only temporarily in their objectives and in this regard a long-term and standardized policy making has to be performed.
In order to provide with answers the above research questions, this paper focuses on standardization of the policy making process for city’s energy efficiency. It utilizes the Task-Based Modelling (TBM) method [2] as a means to map the corresponding policy making process. Moreover, it uses findings from the city of Trikala that have been extracted for the purposes of the project InSmart (Integrative Smart City Planning). This project is a European Coordination Action and it is being implemented with the collaboration of 10 partners (4 of which are cities and 2 universities) coming from 4 European countries. More specifically, it uses the results from experiments that took place in the city of Trikala with regard to city’s energy efficiency.
The remainder of this paper is organized as follows: Section 2 concerns the background section, where the smart city standardization and the process standardization topics are investigated, accompanied by the definition of city’s energy efficiency. Next, Section 3 contains this paper’s research methodologies, which result to the Task-Based process model, which is presented in Section 4. Finally, Section 5 contains this paper’s conclusions and some future thoughts.
2 Background
2.1 Standardization and Smart City
Standardization refers to the consistent use of methodologies, procedures, tools, and techniques specified above the level of individual projects [3, 4]. Standards contain specification documents, rules and guidelines for product or process development [3], while they establish technological convergence in different industrial sectors [5]. Smart city on the other hand, has been quite recently defined as innovation -not necessarily but mainly based on information technologies-, which aims to enhance urban living in terms of people, governance, economy, mobility, environment and living [6]. Moreover, standardization bodies have also given corresponding definitions: International Telecommunications Union (ITU) [7] emphasizes on information and communications technologies (ICT) and considers a smart sustainable city as an innovative city that uses ICT and other means to improve quality of life, efficiency of urban operation and services, and competitiveness, while ensuring that it meets the needs of present and future generations with respect to economic, social and environmental aspects. Similarly, International Standards Organization (ISO) [8] recognizes smart city to be a new concept and a new model, which applies the new generation of information technologies, such as the internet of things, cloud computing, big data and space/geographical information integration, to facilitate the planning, construction, management and smart services of cities. Furthermore, the British Standards [34] concerns smart city as the effective integration of physical, digital and human systems in the built environment to deliver a sustainable, prosperous and inclusive future for its citizens. Finally, International Electrotechnical Commission (IEC) defines the smart city as a system of systems, which enables vertical integration from sensors, to low cost communication, real time analysis and control, and horizontal integration of historically isolated systems up to citizen based services [43]. This definition’s diversity -even at the standardization level- shows that smart city remains an ambiguous term, which however emphasizes on ICT innovation at the urban level.
Literature regarding “smart city” and “standardization” is poor (Table 1): a crawl in ScienceDirect for “smart city” AND “standard” returned only 16 journal articles on June 2016, all of which are irrelevant to developing standards for smart cities. Only some (i.e., [2]) discuss the determinants for smart service use, which have some relevance with the context of this paper. Scopus on the other hand, returned the triple size (43 articles), some of which investigated particular standards in the smart city nexus (i.e., Machine-To-Machine (M2M) Communications and Internet-of-Things (IoT) [9, 10], socio-economic issues [11, 12], ubiquitous networks [13], wireless sensor networks [14] etc.).
Table 1 Literature findings from “smart city” and “standard”
| Source | Results | Articles after Screening |
| Scopus | 43 | [9–14] |
| ScienceDirect | 16 | [2] |
Nevertheless, several competitive smart city standards have been introduced quite recently, (Table 2): ISO -with the support of the American National Standards Institute (ANSI)- developed several standards and specifications for community infrastructure and sustainable development. ITU composed 21 technical reports and specifications for smart sustainable cities (SSC) and provided details for corresponding technologies (i.e., open data, cloud computing etc.) in 2015. Since then, ITU has transferred its SSC activities to the Study Group 20 (SG20)1, which works to address standardization requirements of the Internet of things (IoT) and smart cities and communities (SC&C) and to Study Group 5 (SG5)2, which works on Environment and climate change. IEC reviewed existing standards and drafted a reference architecture, generic use cases and a corresponding implementation roadmap. The identified system consists of connected components that deal with energy, transportation, water, buildings and city services.
Table 2 Smart city standards
| Standardization Body | Standard |
| ISO [8, 35–38] |
|
| ITU [7] |
|
| IEC [42, 43] |
|
| ANSI [44] |
|
| NIST [15, 16] |
|
| CEN/CELENEC/ETSI4,5 [17, 39] |
|
| BSI6 [18, 34] |
|
| AENOR7 |
|
| DKE/DIN [40] |
|
| PKN8 |
|
| NITS [36, 41] |
|
National Institute of Standards and Technology (NIST) in the U.S.A. has focused on Internet-of-Things (IoT) standardization in smart city. The European standardization organizations CEN/CELENEC/ETSI is in the process of defining a common European smart city standard, which considers smart city as a system. BSI has defined several specifications, while from the remainder European States, the German Standards (DIN/DKE) defined a standardization roadmap; the Spanish Standards (AENOR) adopted ISO specifications and initiated 13 corresponding standardization projects; and the Polish Standards (Polish Committee for Standardization (PKN)) work on corresponding terminology and requirements definition. Finally, several national standardization committees have started developing smart city standards in China, including China National IT Standardization TC (NITS).
2.2 Process Standardization
Process standardization has attracted scientific attention since the late 1970s (Table 3). ScienceDirect returned 246 journal articles on June 2016, with the keywords “process” AND “standardization”, with no time limits but with a focus on the topics combining “standard, model, process, system, project, technology and company”. This focus attempted to leave out articles that discuss biology and health, as well as food and agriculture. A screening process followed and left out articles discussing standardization or process alone, as well as articles irrelevant to the context of this paper, such as the ones that discuss the standardization process. Furthermore, Scopus returned 4,332 journal articles on June 2016. After the application of filters to demonstrate works regarding Engineering, Computer Science, Environmental Science and Mathematics, this number decreased to 447 journal articles, on which a similar screening process was followed. Screening left out irrelevant articles, like the ones discussing processing in general (i.e., textile processing).
Process standardization is defined in alternative ways [20], all of which agree to the identification and unification of variants and the establishment of information interchange between different systems or components. Moreover, process standardization describes the extent to which the organization follows recurrent processes and adheres to established standards [5]. Process standardization enables performance measurement and sets the basis for continuous improvement. Different process modelling approaches are located in literature, which have been applied on different sectors (i.e., construction [20, 21]; car industry [22], business and management [23, 24], Information Technology (IT) [25–27] and Health [28] etc.). In fact, software process standardization appears to have positive impact on software flexibility and project performance [5]. Some important models that were discovered during this literature review concern the TBM [2] and the Plan-do-check-act-cycle [29, 30].
The above literature analysis returned useful findings: the competitive standards presented on (Table 2) indicate the existence of a “race” regarding smart city clarification and the standardization of corresponding solutions, while standardization bodies appear to focus on smart city and IoT. However, this evidence shows that smart service and policy making standardization have been left out so far. ITU alone [7] defines a set of primary smart services, but there’s still much work to be done in this regard [31]. On the other hand, policy making standardization has not been modelled according to literature findings and to the existing smart city standards. These findings provide with answer the research question RQ1.
Table 3 Literature findings from “process” and “standardization”
| Source | Results | Citations after Screening |
| Scopus | 447 | [20–28] |
| ScienceDirect | 246 | [3–19] |
2.3 City’s Energy Efficiency
With regard to the term efficiency, Cambridge Dictionary9 defines it as the good use of time and energy in a way that does not waste any of them. Moreover, according to the Business Dictionary10, efficiency concerns the comparison of what is actually produced or performed with what can be achieved with the same consumption of resources (money, time, labour etc.). Both these definitions are more likely to relate efficiency with productivity or performance, while the term has also been associated with economics, for which economic efficiency is attained when individuals in society maximise their utility, given the resources available in the economy [45]. Economic efficiency requires satisfaction of productive -goods and services are produced at the lowest possible cost-, allocative -the set of goods and services that consumers value most- and dynamic -these tests are met for investments, as well as for production for current consumption- efficiency [45].
According to the above definitions, city’s energy efficiency could be defined as the optimal or minimum energy use for city’s operational needs. In this regard, efficiency can be associated with “sufficiency” and with “sustainability”, since both money can be saved and negative externalities associated with energy use can be minimized [46]. The primary energy consumers concern the major urban activities that come from industrial, transportation, residential and commercial procedures [46], while water treatment processes [47] and telecommunications [48] follow.
Urban sustainability coming from energy consumption depends much on city’s physical characteristics (i.e., city size, population density etc.), solid waste management and greenhouse gas (GHG) emission control [1, 49]. For instance, dense compared to sparse cities have lower transport and higher buildings’ energy demands and vice versa [49].
In order to model city’s energy efficiency, Tsolakis and Anthopoulos [1] defined a System Dynamics model that interrelates energy demand and supply users, and emission producers, with which they identified that existing energy efficiency policy making in Eco- or Green cities is estimated to fail in its objectives by 2050. Hu & Wang [50] introduced the total-factor energy efficiency (TFEE) model, which associates sustainable growth with energy efficiency. This model uses local labour size, capital, farming areas and energy use as inputs and local Gross Development Product (GDP) as the output. In this respect, energy demands come mainly from economic activities (industry and farming), which contribute to local economic growth and the adopted technology.
With regard to corresponding policy making, Radulovic et al. [51] identified the interconnection of energy consumption and emission control; the potential of cities in the emissions trading economy; and that public lighting, urban transportation or public buildings’ energy performance are the targets of corresponding local governments’ policy making. Finally, Anthopoulos et al. [52] concluded that corresponding policy making is mainly defined at a national level and it can be specialized in cities, while it can easily affect transportation and lighting upgrades but it is harder to influence buildings’ energy performance.
All the above literature findings show that city’s energy efficiency mainly concerns urban energy performance, which is based on energy suppliers (e.g., renewable sources, gas, electricity etc.) and consumers (buildings, transportation, waste management, water treatment and telecommunications), while it is associated with technology and local economic activities. These factors synthesize the city’s energy model, which can be affected by corresponding policy making.
3 Research Methodology
Defining a policy making process is not a simple procedure, since it varies according to the context of the drafted policy. This paper focuses on policy making regarding transforming a city to a more energy efficient one. Energy efficiency is one of the primary smart city challenges and many solutions have been suggested for cities [1] like smart buildings, renewable energy units and smart grids etc., which seem to generate only a temporary effect on their mission achievement [1]. This argument obliged the authors to look for alternatives in an attempt to define a proper policy making process.
In this respect, this paper uses the case study of the project InSmart (Integrative Smart City Planning) (http://www.insmartenergy.com/), which is a coordination action that is funded by the 7th European Framework Program (FP7). This project started in the early 2014 and will last until the mid-2017, and it is being developed with the contribution of 10 partners from 4 countries (UK, Italy, Portugal and Greece). Four (4) representative and different European cities participate in the consortium (Nottingham (UK), Cesena (Italy), Evora (Portugal) and Trikala (Greece)). Each of these cities has special needs, while each has installed different types of smart technologies: Nottingham has emphasized on renewable energy; Cesena on smart public lighting; Evora on smart grids; and Trikala on smart transportation. The aim of this project is multi-dimensional and its tasks concern the following: (a) it investigates the potentially different sources of energy supply and demand within the involved cities; (b) it defines a reference framework (baseline) for energy demand calculation, with the use of data coming from 2012; (c) it collects scenarios from all the involved cities regarding policy making for energy efficiency; (d) it develops a model for energy demand prediction by 2030, which can test the contributed scenarios; (e) it involves city stakeholders in all the city-partners, in order to execute an MCDM methodology for scenarios’ prioritization; (f) it calculates scenarios’ effect on policy targets. Today, this project finalizes the outcomes from the final calculation in all the involved cities (task f). All the above tasks are being executed in all the involved cities and the outcomes are being summarized.
3.1 City’s Energy Model
The analysis of the future behaviour of the energy system of each city was performed with the use of an Energy System Model (ESM), which is based on the TIMES model generator [53]. TIMES (The Integrated MARKAL-EFOM System) is a linear programming, bottom-up energy model generator which offers the possibility of an integrated modelling of the entire energy system [32]. The TIMES model is demand driven, which means that hypothesis definition is required for the estimation of future behaviour regarding drivers, which may impact energy demand, like for space heating and street lighting.
The TIMES model provides the optimal technology mix, which can satisfy the energy demand, minimise the total system’s cost or equivalently maximise the net social surplus. The model calculates both the energy flows (materials and environment) and the corresponding prices, with the assumption that the energy suppliers produce exactly the energy amounts that the consumers are willing to buy. Furthermore, the model can include several constraints like environmental, resource availability, technological, capital availability etc. Another feature of TIMES is its ability to synthesize regional models, by dividing the investigated geographic area in smaller regions (city zones in the examined case), which can exchange energy commodities (e.g., natural gas, heat etc.) through the interconnection of alternative technologies (i.e., natural gas grid, district heating grid etc.). In this respect, future increase of the grids’ capacity that interconnect city zones can be estimated.
Under the lens of the sustainable development of a city’s energy system, the TIMES model can be applied both with a simulation mode and with a full optimisation mode. However, one of the common conclusions that was extracted by the project concerns that the simulation mode seems to be more appropriate for a city-scale. The local policymakers are more interested in viewing the effect of specific actions, which can be implemented through concrete projects, instead of trying to analyse an optimum pathway that would most probably require interventions that they cannot control. As such, the scenarios defined for the development of the city’s energy system include concrete actions/projects/programmes that have to be analysed and ranked.
The data that are required to setup the ESM, address all the local demand and supply users:
- Residential buildings: existing building stock’s features were collected through surveys. The detailed residential buildings analysis provided the energy demand for the existing environment and the potential energy savings from alternative interventions.
- Municipal and Commercial Buildings: the corresponding energy demand was collected from the municipality and national energy statistics.
- Transport: a transportation analysis within the city was performed with a purpose made transport model, which is presented in the following section. The existing situation was assessed through transportation surveys. Moreover, snapshots of the estimated transportation demand’s change by 2020 and by 2030 were calculated and structured the baseline scenario and alternative mobility scenarios. The calculated demand of vehicle trips (Km) per city zone was used as an input to the ESM.
- Other energy demand sources within the city: water pumping and treatment, waste management and municipal vehicle fleet’s consumptions were considered as additional energy demand sources.
- Energy suppliers: all existing energy suppliers within the city were identified. Moreover, an analysis of the renewable energy potential within the city scale was performed and was accounted by the ESM too.
The residential sector has been classified in flats; detached houses; and semi-detached houses. This classification was performed due to the alternative energy demand that each of these classes (building typologies) has for space heating, cooling and hot water. Each dwelling is considered to have a set of inputs (i.e., flats in Figure 1), while the number of dwellings per class is used to calculate the energy demand for the entire residential sector. Furthermore, in order to estimate the transportation demand, each dwelling is associated with the demand for each transportation mode from one urban zone to another. Space heating, space cooling and heating water energy demand was based on separate calculations for each building class (typology). Different technological options satisfy each of the above energy demands regarding the residential sector. The base-year technologies represent the existing situation, while the set of estimated future technologies has been defined in detail (efficiency, cost, year of availability, life etc.). As an example, the technological options for space heating in flats can be seen in Figure 2.
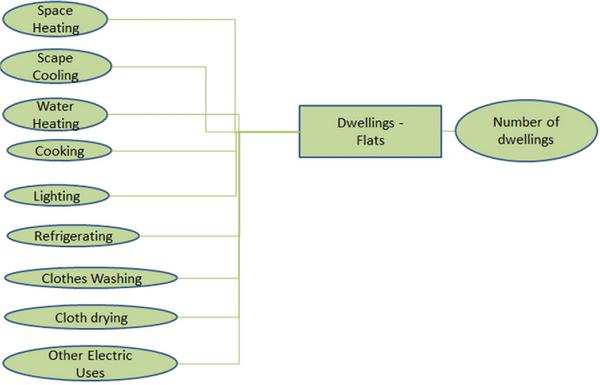
Figure 1 Demands in the residential sector.
Future refurbishment options are modelled with the use of four alternatives that can be implemented in the residential buildings, with a respect to the thermal properties that are defined by the national regulation system and for a specific climate zone:
- Installation of external insulation on the walls for typologies without insulation or insufficient insulation.
- Installation of external insulation on the roof for typologies without insulation or insufficient insulation.
- Energy-efficient windows and doors’ installation.
- All the above actions.
The implementation cost of each of the above options (which was calculated according to the existing market data) leads to space heating and cooling energy demand decrease. The ESM has the flexibility to choose among these alternative options, according to the relative costs, the resulted energy savings and the alternative options in the energy system.

Figure 2 Technology and energy commodity options for space heating in flats. Dotted lines represent future technological options.
3.2 Transport Model
A particular transport model was developed for the purposes of the project, in order to simulate the transportation demands between the city zones [54]. The model splits each city in N geographical zones (typically between 10 to 20). The inputs and outputs are NxN matrices that represent trips, which are being performed by residents from zone of row i to the remainder zones in column j. Corresponding surveys were performed in each city, in order to define the existing travel patterns of city inhabitants, while all the transportation modes were incorporated in the model. The temporal disaggregation is a typical day, without accounting different week-days or peak traffic times. Calculations were performed for a short-term (by 2020) and medium-term (by 2030) period. The types of future interventions (scenarios), which were tested by the model concern:
- Changes regarding the distribution of population, employment, retail and/or the trip destinations;
- Changes of time and/or money values of specific sub-modes of some/all the trips;
- Introduction of ‘New Modes’ (new public transportation and/or new cycle lanes);
- Changes of vehicle types’ proportion in addition to vehicle fleets’ renewals.
Alternative interventions/scenarios that were tested concern:
- New road facilities or public transportation updates;
- Alternative public transportation or parking charging regimes;
- Traffic management and vehicle restrictions by the highway network;
- Travel planning and publicity regimes.
3.3 The Multi-Criteria Decision Making (MCDM) Methodology
The decision-making methodologies that have been followed during the project concern the resistance-to-change grid method and PROMETHEE, which belong to the Multi-Criteria Decision Making (MCDM) methodology. The MCDM methodology is based on the definition of multiple criteria, which are used by a decider/decision maker in his attempt to select the optimal among alternative choices. The relative importance of each criterion is expressed with values that are called weights. The resistance-to-change method is based on the principle that when a criterion A is compared to a criterion B, the decider is most reluctant to change the most important criterion from its desirable state to an undesirable one. The weighting method is based on the pairwise comparison of the identified criteria. For example, when criterion g1 is compared to the criterion g2, the decider is asked if he wants to change one of these two criteria from the desirable state to the undesirable one; then the decider defines which would be the criterion that would be reluctant to change. The desirable and the undesirable states of the criteria are being considered by the decider in order to perform the comparison.
The PROMETHEE method is quite a simple MCDM one, which was developed by Brans and Mareschal [55]. This method is appropriate for problems where a limited number of alternative actions have to be ranked according to specific criteria. The problem for the cities under the InSmart project concern the prioritization of policies (projects) that can be applied within the urban space. This prioritization has to be performed according to energy, environmental, economic, social and technological considerations that synthesize the evaluation criteria, while preference thresholds and weights are taken by a systematic application of the Hinkle’s method [55] that involves the deciders. The method was applied in all the cities and prioritized alternative policies (scenarios), with the following process:
- Define the evaluation criteria for holistic smart-city planning;
- Define alternative scenarios;
- Document the stakeholders’ preferences over the recognized criteria;
- Execute the PROMETHEE method and prioritize the scenarios.
The evaluation criteria that were followed under the project concern the following (Table 4):
Table 4 Stakeholder-oriented matrix
| Criteria | Code | Brief Description | Desirable State | Non-Desirable State |
| Implementation Cost (€) | C1 | What is the implementation cost (€), of the intervention over the period 2013–2030, compared to the implementation cost of the Business as Usual (BAU) case? | Low Cost | High Cost |
| Implementation Cost’s Efficiency (KWh/(€)) | C2 | How efficient in terms of energy is the investment? How much energy in KWh is saved for each Euro (€) of investment spent during the period 2015–2030? | High efficiency | LowEfficiency |
| Energy savings (MWh) | C3 | What is the total energy amount that will be saved by 2030, expressed in MWh? | High Energy Savings | LowEnergy Savings |
| Operation and Maintenance Cost (€) | C4 | What is the total operational and maintenance costs of the intervention by 2030 (€)? | Low Cost | High Cost |
| Revenue Production (€) | C5 | What is the annual revenue generated by the intervention (€) for the period 2015–2030? | High Revenue | Low Revenue |
| Ease of Implementation | C6 | Does the implementation contain any technological risks? Does the scenario comply with existing laws, environmental regulation, etc.? Has it received approval from the involved authorities? Is the licensing process complex? | The implementation is simple and easy to complete | The implementation is complex and difficult to complete |
| City’s Quality of Life Improvement | C7 | Does the intervention improve local: Thermal Comfort, Lighting Comfort, Traffic Conditions, Living Conditions, etc.? | Improvement of City’s Quality of Life | No Improvement of City’s Quality of Life |
| City’s Economic Development Improvement | C8 | Does the intervention result to: labour or economic growth? | Improvement of City’s Economic Development | No Improvement of City’s Economic Development |
| Social Acceptance | C9 | Is the intervention accepted by the local community? | High Societal Acceptance | Low Societal Acceptance |
The Hinkle’s method was applied to calculate the weights. Initially, the evaluation criteria were organized into a stakeholder-oriented matrix, in order to engage and facilitate deciders properly and to collect their preferences. The matrix is presented in Table 4 and it essentially describes the evaluation criteria considered and their respective desirable and non-desirable states.
3.4 The Case Study of the City of Trikala
Trikala is a city with a long history, located in central Greece and has a population of 81,355 inhabitants, while it is governed by a municipality (http://www.trikalacity.gr). The project tasks resulted to the following outcomes for the city of Trikala:
- Reference framework: the baseline accounted that Trikala is organized in 20 zones, inhabited by a smoothly increasing population, while the majority of buildings are mainly used for housing purposes.
- Energy demand sources: buildings (organized in 4 typologies); water and sewage process; waste chain; and transportation.
- Energy supply sources: heating oil; transportation diesel and gasoline, natural gas; solar panels; and biomass.
- Scenarios definition: 14 alternative interventions (scenarios) were tested by the model and the calculated outcomes were compared with the reference framework (baseline). These scenarios concerned alternative energy savings policies that are being considered or being developed by the Municipality of Trikala, in order to comply with the Covenant of Mayors for Climate & Energy objectives, which had signed. This set of scenarios (Table 5) concerns various activities that address all the 5 energy demand sources and result to energy savings.
- Scenarios execution: calculations regarding the estimated cost and the energy efficiency’s outcome of each scenario were performed with the use of the project’s models (Figure 3), accompanied by maintenance costs and potential income. The analysis was performed according to the ESM that was based on the TIMES model generator [32]. The model results were used to calculate the quantitative criteria (first five criteria in Table 5) of the MCDM analysis. These results show that each policy result to different outcomes, which have to be evaluated and selected properly. The calculation functions’ presentation is beyond the purposes of this paper and are explained in-detail in the InSmart project deliverables.
- Scenarios’ prioritization: the MCDM process that was explained in the previous section was executed with the contribution of the city stakeholders (Municipality, Commercial Chamber, Technical Chamber and Commercial Association), which play significant economic roles within the city. After explaining the methodology and communicating the criteria to the stakeholders, the participants contributed their preferences in grid-tables. Then, the PROMETHEE method compared the alternatives in pairs, according to each criterion and to each decider’s preferences. The results obtained from each stakeholder were used to calculate normalized values and are presented on the following Figures 4, 5, 6 and 7.
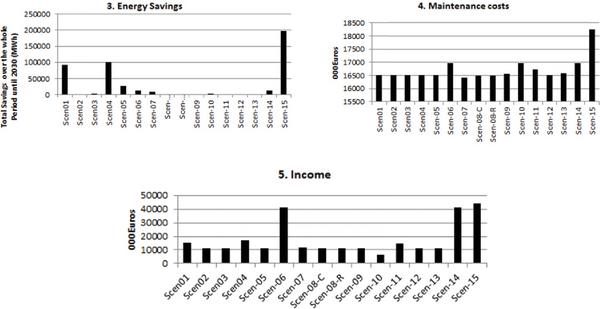
Figure 3 Scenarios simulation.
Table 5 Scenarios definition
| Group | Scenario |
| Buildings |
|
| Public lighting |
|
| Renewable Energy |
|
| Green Spaces |
|
| Transportation |
|
| Water and sewage |
|
| Systemic |
|
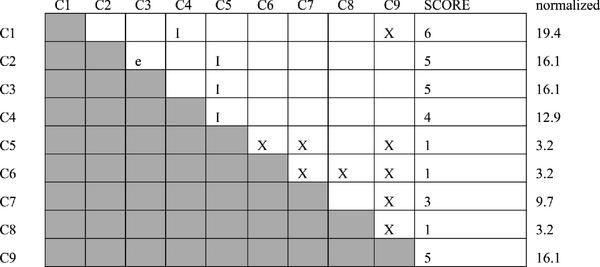
Figure 4 Evaluation criteria scores and corresponding weights – Municipality.
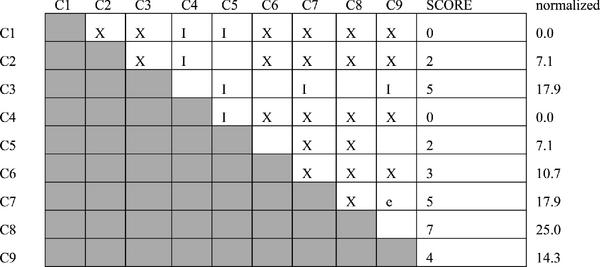
Figure 5 Evaluation criteria scores and corresponding weights – Technical Chamber.
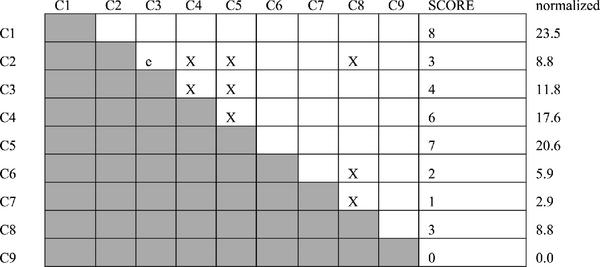
Figure 6 Evaluation criteria scores and corresponding weights – Commercial Association.
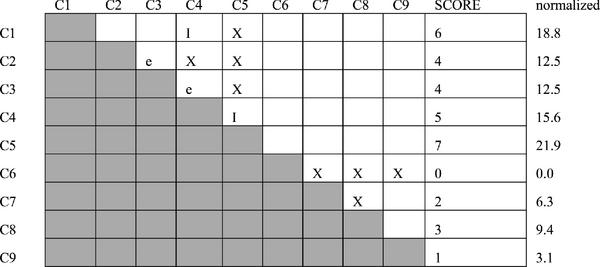
Figure 7 Evaluation criteria scores and corresponding weights – Trikala Chamber.
Then, the preference functions were used, which consist of the preference P and indifference Q (Q expresses the maximum acceptable difference from the ideal (max or min) value for the criterion) and were calculated from their replies. The values obtained for preference P and indifference Q and for each stakeholder are shown in Table 6.
The last 4 criteria, are qualitative and express the level of preference for each of them with a Likert scale as follows:
- –2: very bad or very low
- –1: bad or low
- 0: average or moderate
- 1: good or high
- 2: very good or very high
The calculated PROMETHEE results for each stakeholder were ranked by means of the total cost-function value (Phi value) obtained for each scenario. A Rainbow Diagram (Figure 8) was extracted to depict these results. The Rainbow Diagram prioritizes the scenarios from the highest to the lowest Phi value in its scaled form, ranging from –1 (worst solutions) to +1 (best solutions), meaning that actions with positive Phi could be considered acceptable. Criteria with positive and negative contributions (Phi+ and Phi-) for each scenario are illustrated in the rainbow’s bars by means of their colour pre-set for criteria’ categories. In this respect, the colours present a clear view of the level of achievement of optimal values for each criterion in relation to the preference defined for each stakeholder. Finally, Table 7 presents the total ranking of the interventions for each of the stakeholders, while the last column contains the “compromised” solution, which is based on a special PROMETHEE algorithm that balances the results of each separate scenario/stakeholder.
Table 6 Preference functions and thresholds for Preference (P) and Indifference (Q)
| Criteria | ||||||
| Stakeholder | Preference Parameter | Cost (k€) | Cost Efficiency (kWh/€) | Energy Savings (MWh) | OM Cost (Until 2030) (k€) | Revenues (2015–30) (k€) |
| Municipality | Pref. Function | Linear | Linear | Linear | Linear | Linear |
| P value | 1,035,393.48 | 0.25 | 100027.55 | 9,514.89 | 12,079.74 | |
| Q value | 702,113.49 | 0.03 | 59,208.49 | 6,653.69 | 6,705.69 | |
| Technical Chamber | Pref. Function | Linear | V-shape | V-shape | Linear | Linear |
| P value | 1,035,393.48 | 0.25 | 100027.55 | 9,514.89 | 12,079.74 | |
| Q value | 702,113.49 | – | 0 | 6,653.69 | 6,705.69 | |
| Commercial Association | Pref. Function | V-shape | Linear | Linear | V-shape | Linear |
| P value | 1,035,393.48 | 0.25 | 100027.55 | 9,514.89 | 12,079.74 | |
| Q value | – | 0.03 | 59,208.49 | – | 6,705.69 | |
| Commercial Chamber | Pref. Function | Linear | Linear | Linear | Linear | Linear |
| P value | 1,035,393.48 | 0.25 | 100027.55 | 9,514.89 | 12,079.74 | |
| Q value | 702,113.49 | 0.03 | 59,208.49 | 6,653.69 | 6,705.69 | |
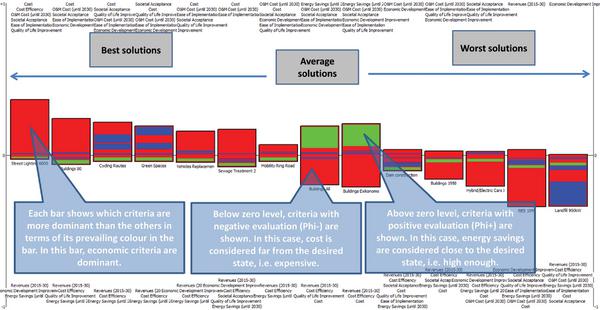
Figure 8 Assessing MCDM results in a “rainbow fashion”.
Table 7 Stakeholders’ decision matrix
| Stakeholders’ Decisions Matrix | Municipality | Technical Chamber | Commercial Association | Trikala Chamber | Compromised |
| Acceptable solutions in descending order of Phi (Phi > 0) | Cycling lane development (S8R) | Cycling lane development (S8R) | Mobility Ring road (S8C) | Cycling lane development (S8R) | Cycling lane development (S8R) |
| Green spaces (S7) | Green spaces (S7) | Cycling lane development (S8R) | Mobility Ring road (S8C) | Mobility Ring road (S8C) | |
| Buildings Connected to Natural Gas Network (S2) | Mobility Ring road (S8C) | Buildings Connected to Natural Gas Network (S2) | Buildings Connected to Natural Gas Network (S2) | Green spaces (S7) | |
| Mobility Ring road (S8C) | Buildings All (S4) | Buildings All (S4) | Green spaces (S7) | Buildings All (S4) | |
| Buildings All (S4) | Buildings Connected to Natural Gas Network (S2) | Green spaces (S7) | Buildings All (S4) | Buildings Connected to Natural Gas Network (S2) | |
| Street lighting (S5) | Street lighting (S5) | Sewage treatment (S12) | Sewage treatment (S12) | Street lighting (S5) | |
| Vehicles’ fleet renewal (S9) | Vehicles’ fleet renewal (S9) | Street lighting (S5) | Vehicles’ fleet renewal (S9) | ||
| Sewage treatment (S12) | Sewage treatment (S12) | ||||
| Hybrid/electric cars (S10) | |||||
| Worst solutions (lowest negative Phi’s) | Municipal Buildings’ renovation (S1) | Buildings before 1950 energy performance upgrade (S3) | Buildings before 1950 energy performance upgrade (S3) | Buildings before 1950 energy performance upgrade (S3) | Buildings before 1950 energy performance upgrade (S3) |
| Renewable energy production by 10% of total demand (S6) | Renewable energy production by 10% of total demand (S6) | Renewable energy production by 10% of total demand (S6) | Municipal Buildings’ renovation (S1) | Renewable energy production by 10% of total demand (S6) | |
| Biomass landfill (S11) | Biomass landfill (S11) | Biomass landfill (S11) | Biomass landfill (S11) | Biomass landfill (S11) |
Si: the scenario i presented in Table 7
Solutions in green color express the ones acceptable by all stakeholders, also appearing in the compromised solution; in blue are solutions acceptable by at least 2 stakeholders also appearing in the compromised solution; in red are actions among the three worst ones for all stakeholders and for the compromised solution; in orange are worst actions being accepted by at least two stakeholders, also appearing in the compromised solution.
In conclusion, the MCDM provided the following results (Table 8) (compromised among all stakeholders):
Table 8 Stakeholders’ decision matrix
| Acceptable Actions | Worst Actions |
|
|
Similar to Trikala outcomes have been generated for all the involved cities, but their presentation is beyond the purposes of this paper. The followed policy making method has significant advantages: it calculates policy in terms of its expected efficiency. In the examined case, policy had to do with city’s energy efficiency. Since there are several alternatives with different impacts, scenarios have to be calculated with regard to their estimated impact, in terms of several criteria (mainly in terms of money and potential outcome). Moreover, policy success has to do with outcomes’ adoption. In this regard, an important contribution of the above methodology is that community’s engagement occurred in practice with a bottom-up method, since the most important city’s stakeholders contributed with their perspectives and prioritized policy options. To this end, they affected policy making and the selected policies are more likely to be adopted.
4 Energy Efficiency Policy Making with TBM
According to the Task-Based Modelling method (TBM) [2] a process is analysed in key management tasks and each task is accompanied by an execution method and by detailed attributes. Instead of trying to standardize a business process, TBM intends to focus on standardizing lower-level management tasks. TBM enables the clear definition and the outcome’s measurement of a process. A management task represents a management action or a series of actions to be taken in order to achieve a specific object or function. To this end, each management task has the following features, regardless its complexity [2]:
- Action: it takes an action or a series of related actions to execute a task. An action is characterized by a “verb”;
- Method: it may be conducted with certain methods;
- Object: the action may work on an object that affects the means of executing a task.
Management tasks can be fully or semi-automated or fully manual [2]. Fully automated tasks can be conducted by computers via the appropriate software (i.e., the action send_email[what, whatElse] sends an e-mail message with content “what” to recipients “whatElse”). Semi-automated tasks on the other hand, require the interaction between a decider and the computer during a task (i.e., retrieving historical spending data with adjustments made by a human). Finally, manual tasks concern complex decision making tasks, which can be only performed by qualified humans.
A management process is driven by a request -which is a question, a process or a need- and it is executed with the following steps [2]: (a) raise a request; (b) create an instance of a process model; and (c) execute the model -task by task-, and trace the dynamic status of the model.
All the above information can be adjusted with the process that was presented in the previous Section 3, where policy making was analysed in 6 specific tasks (a–f). The extracted TBM consists of 17 tasks, it is depicted on (Figure 9) and may vary between cities. Although this model has been defined for energy efficiency purposes in smart cities, it is quite generic and it may be applicable in other corresponding policy making problems too, since it incorporates MCDM and defines decision options and corresponding criteria. In (Table 9) an analysis of all the steps is demonstrated. In this process model, there are 10 different tasks as follows:
- DefineBaselineStructure: a manual task. It requires a manager to define the structure of the baseline.
- SearchDataBase: an automated task. It searches records from a given database;
- UpdateDatabase: an automated task. It updates a database with new records.
- Search_Manual: a manual task. It involves a manual process to search for a list of qualified items;
- DefineScenarios: a manual task. It requires a manager to define the alternative scenarios.
- ExecuteScenarios: an automated task. It uses the model and the energy data to calculate policies’ efficiency.
- DefineScenarioSelectionCriteria: a manual task. It requires a manager to define the selection criteria.
- RankCriteriaWeights: a manual task. It requires stakeholders to rank the importance of the selection criteria.
- ScenariosPrioritization: an automated task. It uses MCDM methodology to evaluate the scenarios according to the criteria and to their ranking.
- SelectScenario: a manual task. It requires a manager to select the optimal scenario.
The identified TBM provides with answer RQ2 and can standardize a typical decision making process.
Table 9 The analysis of the proposed TBM process
| ID | Action | What | WhatElse | Description of Action |
| 1. | DefineBaseline Structure |
DefinedBaseline Structure |
Policy maker or an expert | Policy maker or an expert defines the baseline structure |
| 2. | SearchDatabase | 6. BaselineData Exist = yes 4. BaselineData Exist = no |
BaselineDatabase – a database name | Select a route based on whether or not baseline information is found |
| 3. | Search_Manual | City, Population, Energy Suppliers, Energy Consumers, Traffic Data, Emission Production, Water and Sewage, Waste Management | Policy maker or an expert | Policy maker investigates the city for the required information for the baseline |
| 4. | UpdateDatabase | ID#|City |Baseline Parameter |BaselineValue |
BaselineDatabase – a database name | Automated task: Update the database with the Baseline data |
| 5. | SearchDatabase (5.1, 5.2) | 9: Suppliers Exist = yes AND Consumers Exist = yes 7: Suppliers Exist = no OR Consumers Exist = no |
EnergySource – a database name EnergyDemand – a database name |
Select a route based on whether or not energy suppliers and consumers are found |
| 6. | Search_Manual | Energy Demand, Energy Production Source |
Nil | Policy maker or an assigned expert identifies a set of energy suppliers (sources) and energy consumers (demands) |
| 7. | UpdateDatabase (7.1, 7.2) | ID#|EnergySource ID#|Energy Demand |
EnergySource – a database name EnergyDemand – a database name | Automated tasks: Update the first database with the identified energy supplier sources and the second database with the identified energy demands |
| 8. | DefineScenarios | DefinedScenarios | Policy maker or an expert | Policy maker or an assigned expert defines a set of scenarios (policy options) |
| 9. | ExecuteScenarios | EnergyModel, baseline | Nil | Automated task: the identified scenarios are tested regarding their efficiency with the identified model |
| 10. | SearchCriteria | 15: Criteria Exist = yes 12: Criteria Exist = no |
Nil | Select a route based on whether or not selection criteria are found |
| 11. | DefineScenario SelectionCriteria |
DefinedCriteria | Policy maker or an expert | Policy maker defines a set of criteria, for scenario selection |
| 12. | RankCriteria Weights |
RankedCriteria | Stakeholders | The stakeholders rank the MCDM criteria |
| 13. | UpdateDatabase | ID#|Criterion | CriterionWeight |
Stakeholders Criteria – a database name |
Automated task: Update the selected criteria database |
| 14. | RankCriteria Weights |
RankedCriteria | Stakeholders | The stakeholders rank the MCDM criteria |
| 15. | Scenarios Prioritization |
RankedCriteria | Nil | Automated task: scenarios are prioritized according to criteria weights |
| 16. | SelectScenario | Top ranked Scenario | Policy maker | The policy maker makes decision based on the optimal scenario according to MCDM results |
| 17. | UpdateDatabase | ID#|Scenario| Rank |
PolicyDatabase – a database name | Automated task: Update the selected scenario database |
5 Conclusions – Future Thoughts
This paper focused on the problem of policy making in smart cities and more specifically, it focused on policies that impact city’s energy efficiency. It stated 2 research questions (RQ1 and RQ2) and followed different methodologies to provide them with answers. More specifically, it used literature evidence to answer RQ1, which show that existing smart city standards do not provide with rules or guidelines policy making, but they contain specifications for parts of energy efficiency components (i.e., buildings, smart grids etc.). In order to answer RQ2, the case study research methodology was followed for defining the policy making process and the TBM was utilized for modelling the resulted this process. Using the task components as the basic modelling elements and the experimentation that took place in the city of Trikala in Greece for the purposes of the project InSmart, a process model was created by connecting the needed tasks. The identified model has been tested in all the city partners of the project InSmart. Such a standardized process can become a guide for similar tasks that deal with smart city energy efficiency policy making. Some future thoughts concern the identification of similar process models for other decision making procedures in smart cities.
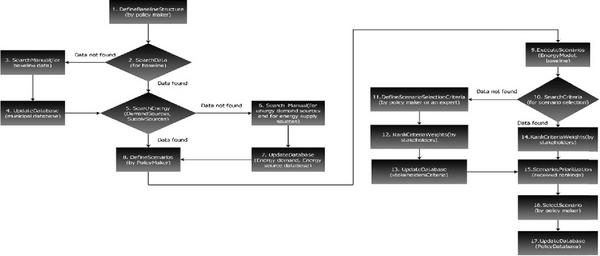
Figure 9 The policy making process model.
Acknowledgements
This project has received funding from the European Union’s Seventh Framework Programme for research, technological development and demonstration under grant agreement no 314164. Parts of this paper were presented at the 8th ITU Kaleidoscope Academic Conference “ICTs for a SustainableWorld”, Bangkok, Thailand, November 14–16, 2016.
References
[1] Tsolakis, N., and Anthopoulos, L. (2015). Ecocities: an integrated system dynamics framework and a concise research taxonomy. Sustain. Cities Soc. 17, 1–14.
[2] Shi, J. J., Lee, D-E., and Kuruku, E. (2008). Task-based modelling method for construction business process modelling and automation. Automat. Construct. 17, 633–640.
[3] Gauch, S., and Blind, K. (2015). Technological convergence and the absorptive capacity of standardisation. Technol. Forecast. Soc. Change 91, 236–249.
[4] Wettig, J. (2002). New developments in standardisation in the past 15 years – product versus process related standards. Saf. Sci. 40, 51–56.
[5] Moore, G. E. (1979). Standardization. Microelectronics J. 10, 30–34.
[6] Anthopoulos, L. and Reddick, C. H. (2015). Understanding electronic government research and smart city. Inform. Polity 21, 99–117.
[7] International Telecommunications Union [ITU] (2014). Smart Sustainable Cities: An Analysis of Definitions. Rome: International Telecommunications Union.
[8] International Standards Organization [ISO] (2016). Smart cities Preliminary Report 2014. Available at: http://www.iso.org/iso/smart_cities_report-jtc1.pdf
[9] Belanche, D., Casaló, L. V., and Orús, C. (2016). City attachment and use of urban services: benefits for smart cities. Cities 50, 75–81.
[10] Verma, P. K., Verma, R., Prakash, A., A. Agrawal, K. Naik, R. Tripathi, M. Alsabaan, T. Khalifa, T. Abdelkader and A. Abogharaf, Machine-to-Machine (M2M) communications: A survey, Journal of Network and Computer Applications, 66, 83–105, 2016.
[11] Neisse, R., Steri, G., Fovino, I. N., and Baldini, G. (2015). SecKit: a model-based security toolkit for the internet of things. Comput. Security 54, 60–76.
[12] Marsal-Llacuna, M.-L. (2015a). Building universal socio-cultural indicators for standardizing the safeguarding of citizens rights in smart cities. Soc. Indicat. Res. 2015, 1–117.
[13] Marsal-Llacuna, M.-L. (2015b). City indicators on social sustainability as standardization technologies for smarter (citizen-centered) governance of cities. Soc. Indic. Res. 128, 1193–1216. doi: 10.1007/s11205-015-1075-6.
[14] Lee, C. S., Lee, G. M., and Rhee, W. S. (2013). Standardization and challenges of smart ubiquitous networks in ITU-T. IEEE Commun. Magaz. 51, 102–110.
[15] National Institute of Standards and Technologies (NIST) (2016). IoT–Enabled Smart City Framework. Available at: https://s3.amazonaws.com/nist-sgcps/smartcityframework/files/IoT EnabledSmartCityFrameworkWP.pdf
[16] National Institute of Standards and Technologies (NIST) (2015). Framework for Cyber-Physical Systems: Draft Release 0.8. Available at: https://pages.nist.gov/smartcitiesarchitecture/community/consensusppi/
[17] CEN-CENELEC-ETSI (2016). Smart and Sustainable Cities and Communities: A Role for European Standardization. Riga: CEN-CENELEC-ETSI.
[18] British Standards Institute (BSI) (2014). PAS 181 Smart City Framework Standard. London: British Standards Institute (BSI).
[19] Watteyne, T., and Pister, K. S. J. (2011). Smarter cities through standards-based wireless sensor networks. IBM J. Res. Dev. 55, 1–10.
[20] Villalba-Diez, J., and Ordieres-Mere, J. (2015). Improving manufacturing performance by standardization of interprocess communication. IEEE Trans. Eng. Manag. 62, 351–360.
[21] Ngai, E. W. T., Chau, D. C. K., Poon, J. K. L., and To, C. K. M. (2013). Energy and utility management maturity model for sustainable manufacturing process. Int. J. Prod. Econ. 146, 453–464.
[22] Herrmann, S., Rogers, H., M Gebhard and Hartmann, E. (2015). Co-creating value in the automotive supply chain: an RFID application for processing finished vehicles. Prod. Plann. Control 26, 981–993.
[23] Chou, T-H., Lee, C-C., and Lin, C-W. (2015). Using ontological e-services framework to orchestrate e-business process services. Int. J. Enterp. Inf. Syst. 11, 65–89.
[24] Hahn, R. (2013). ISO 26000 and the standardization of strategic management processes for sustainability and corporate social responsibility. Bus. Strategy Environ. 22, 442–455.
[25] Egyedi, T., and S., Muto. (2012). Standards for ICT: a green strategy in a grey sector, source of the document international. J. IT Stand. Stand. Res. 10, 34–47.
[26] Teachout, P. (2009). Process standardization. Flexo 34, 28–32.
[27] Reyneri, C. (1999). Operational building blocks for business process modelling. Comput. Ind. 40, 115–123.
[28] Young, J., Rinner, C., and Patychuk, D. (2010). “The effect of standardization in multicriteria decision analysis on health policy outcomes,” in Advances in Intelligent Decision Technologies, 4 of the Series Smart Innovation, Systems Technologies, eds G. Phillips-Wren, L. C. Jain, K. Nakamatsu, and R. J. Howlett (Berlin: Springer), 299–307.
[29] Russel, J. P. (2003). How to implement and audit the process approach. Qual. Prog. 35, 71–73.
[30] Yu-Chih Liu, J., Chen, V., J., Chan, C-L and Lie, T. (2008). The impact of software process standardization on software flexibility and project management performance: control theory perspective. Inf. Softw. Technol. 50, 889–896.
[31] Anthopoulos, L., Janssen, M., and Weerakkody, V. (2005). “Smart service portfolios: do the cities follow standards,” in Proceedings of the WWW2016 ACM 25th World Wide Web International Conference, Montreal, QC. doi: 10.1145/2872518.2888618
[32] Loulou, R., Remne, U., Kanudia, A., Lehtila, A., and Goldstein, G. (2005). Documentation for the TIMES Model, Part I. Available at: http://iea-etsap.org/docs/TIMESDoc-Intro.pdf
[33] Brans, J. P., and Vincke, P. H. (1985). A preference ranking organization method: the PROMETHEE method for multiple-criteria decision-making. Manag. Sci. 31, 647–656.
[34] British Standards Institute (BSI) (2014). PAS 180 Smart City Framework Standard. London: British Standards Institute.
[35] International Standards Organization (ISO) (2016). Sustainable Development in Communities. Available at: http://www.iso.org/iso/iso_37101_sustainable_development_in_communities.pdf
[36] International Standards Organization (ISO) (2015). Smart Community Infrastructures – Principles and Requirements for Performance Metrics. Available at: https://www.iso.org/obp/ui/#iso:std:iso:ts:37151:ed-1:v1:en
[37] International Standards Organization (ISO) (2014). ISO 37120:2014: Sustainable Development of Communities – Indicators for City Services and Quality of Life. Available at: https://share.ansi.org/ANSI%20Network%20on%20Smart%20and%20Sustainable%20Cities/ISO%2B37120-2014_preview_final_v2.pdf
[38] International Standards Organization (ISO) (2014). Smart Community Infrastructures. Available at: http://www.iso.org/iso/executive_summary_iso_37150.pdf
[39] CEN-CENELEC-ETSI (2015). Smart and Sustainable Cities and Communities Coordination Group Final Report. Available at: http://www.cencenelec.eu/standards/Sectors/SmartLiving/smartcities/Pages/SSCC-CG.aspx
[40] DKE/DIN (2014). The German Standardization Roadmap – Version 1.0. Available at: https://www.dke.de/de/std/documents/nr_smart%20city_en_version%201.0.pdf
[41] China Academy of Information and Communications Technology (CAICT) and EU-China Policy Dialogues Support Facility II (PDSF) (2014). Comparative Study of Smart Cities in Europe and China 2014. Berlin: Springer.
[42] International Electrotechnical Commission (IEC) (2016). Smart Cities. Available at: http://www.iec.ch/about/brochures/pdf/technology/smartcities.pdf
[43] International Electrotechnical Commission (IEC) (2016). Orchestrating infrastructure for sustainable Smart Cities. Available at: //www.iec.ch/whitepaper/pdf/iecWP-smartcities-LR-en.pdf
[44] American National Standards Institute (ANSI) (2016). ANSSC Directory of Smart and Sustainable Cities Standardization Initiatives and Related Activities Report. Availabe at: https://share.ansi.org/ANSI%20Network%20on%20Smart%20and%20Sustainable%20Cities/ANSSC-Directory-of-Initiatives.pdf
[45] Australian Government Productivity Commission (2012). On Efficiency and Effectiveness: Some Definitions. Available at: http://www.pc.gov.au/research/supporting/efficiency-effectiveness/efficiency-effectiveness.pdf
[46] Allcott, H., and Greenstone, M. M. (2013). Is there an energy efficiency gap? J. Econ. Perspect. 26, 3–28.
[47] Otterpohl, R., Grottker, M., and Lange, J. (1997). Sustainable water and waste management in urban areas. Water Sci. Technol. 35, 121–133.
[48] Zhang, Y., Chowdhury, P., Tornatore, M., and Mukherjee, B. (2010). Energy efficiency in telecom optical networks. IEEE Commun. Surveys Tutor. 12, 441–458.
[49] Steemers, K. (2003). Energy and the city: density, buildings and transport. Energy Build. 35, 3–14.
[50] Hu, J.-L., and Wang, S.-C. (2006). Total-factor energy efficiency of regions in China. Energy Policy. 34, 3206–3217.
[51] Radulovic, D., Skok, S., and Kirincic, V. (2011). Energy efficiency public lighting management in the cities. Energy 36, 1908–1915.
[52] Anthopoulos, L., Giannakidis, G., and Sakkas, S. (2016). Realizing, modeling and evaluating citys energy efficiency: the case of In Proceedings of the Smart in the city of Trikala, Greece, in the Proceedings of the 3rd International Conference for E-Democacy and Open Government, Asia CEDEM ASIA 2016.
[53] Giannakidis, G., Siakkis, P., and Nychtis, C. (2016). INSMART project report D.5.1. Optimum Sustainable pathways for Trikala. Available at: http://www.insmartenergy.com/wp-content/uploads/2014/12/D5.2-Optimum-Sustainable-Pathways-Trikala.pdf
[54] Irons, D., Stephenson, C., Connolly, D., and Khan, A. (2014). INSMART Internal Report No. 9 Description of Transport Model (WP3. T3.1). Available at: http://www.insmartenergy.com/wp-content/uploads/2014/12/I.R.9-WP3-T3.1-Description-of-Transport-Model.pdf
[55] Brans, J. P., and Mareschal, B. (1992). PROMETHEE V: MCDM problems with additional segmentation constraints. INFOR 30, 85–96.
Biographies

L. Anthopoulos is an Associate Professor at the Business School of the TEI of Thessaly and Director of the Postgraduate Program in Project and Programme Management. Dr. Anthopoulos has extensive IT research, planning and Management experience with regard to the development and deployment of complex IT projects. He is a member of various committees, worth mentioning the ITU Smart City Focus Group, Associate Editor of the IJPADA journal (IGI-GROUP) and editor of book collections. Some of his articles can be found on Government Information Quarterly, Information Polity, Transforming Government etc. His research interests concern, among others, Smart City, e-Government, Enterprise Architecture, Strategic Management, etc.

G. Giannakidis holds a Degree in Mechanical Engineering from the Aristotle University of Thessaloniki, Greece and a Ph.D. from the Department of Aeronautics, Imperial College of Science Technology and Medicine, Univ. of London, UK. He worked initially as a senior consultant and then as the Head of Energy Systems Analysis Laboratory in the Centre for Renewable Energy Sources and Saving (CRES), Greece for nineteen years. He has more than 20 years of professional experience in the sectors of renewable energy analysis, energy efficiency, energy planning, energy modelling, energy systems analysis and energy statistics. He has been Team leader/Senior expert in a number of projects concerning Mediterranean countries, projects funded by the European Commission and projects funded by the Greek state on the issues of Energy planning and Energy modeling, Renewable Energy integration, Energy Efficiency and Energy Statistics.
Journal of ICT, Vol. 4_2 111–146.
doi: 10.13052/jicts2245-800X.422
© 2017 River Publishers. All rights reserved.
1https://www.itu.int/en/ITU-T/studygroups/2017-2020/20/Pages/default.aspx
2http://www.itu.int/en/ITU-T/studygroups/2013-2016/05/Pages/default.aspx
3http://www.nist.gov/public_affairs/releases/nist-global-city-teams-challenge-aims-to-create-smart-cities.cfm
4http://www.cencenelec.eu/standards/Sectors/SmartLiving/smartcities/Pages/default.aspx
5https://ec.europa.eu/research/participants/portal/desktop/en/opportunities/h2020/topics/353-scc-03-2015.html
6http://www.bsigroup.com/en-GB/smart-cities/Smart-Cities-Standards-and-Publication/
7https://eu-smartcities.eu/content/new-set-smart-cities-standards-spain
8http://www.pkn.pl/sites/default/files/annual_report_2013.pdf
9http://dictionary.cambridge.org/dictionary/english/efficiency
10http://www.businessdictionary.com/definition/efficiency.html