Improving Spectrum Sensing as a Method for White Space Identification through Design Principles
Hope Mauwa1, Antoine Bagula1 and Marco Zennaro2
- 1University of the Western Cape, ISAT Lab, Dept. of CS, Bellville, South Africa
- 2International Centre for Theoretical Physics, ICT4D Laboratory, Trieste, Italy
E-Mail:{mhope; bbagula}@uwc.ac.za, mzennaro@ictp.it
Received 15 March 2016;
Accepted 6 June 2016
Abstract
Spectrum sensing’s inability to provide maximum protection to primary users operating in television white spaces summarizes the technical challenges associated with it. Building upon “WhiteNet”, a white space network management platform for campus connectivity, this paper proposes design principles that can be incorporated in a white space identification system based on a cooperative spectrum sensing model that both minimizes the probability of causing interference to primary users due to false negatives and reduces false positives thereby increasing the amount of white spaces identified. Real-world indoor measurements of a TV transmitter signal were used to evaluate the proposed principles. The results reveal the relevance of using these design principles in white space networking using the emerging White-Fi protocol.
Keywords
- White-Fi
- cooperative spectrum sensing
- detection threshold
- spectrum sensing principles
1 Introduction
So far, geo-location and spectrum sensing are two main approaches that have been proposed and accepted as possible methods of accessing unused spectrum in the TV frequency band (television white spaces) for secondary use. Geo-location database approach guarantees more protection from interference to spectrum incumbents or primary users than the spectrum sensing approach. It is therefore not surprising that geo-location database approach is the preferred method of access in the US and Europe [1] at the moment. Protocols that have been developed so far for television white space(TVWS) access both in the US and Europe by telecommunications regulatory authorities there support the use of geo-location database. Example of such protocols include Protocol to Access White Space (PAWS) [2] by the Internet Engineering Task Force (IETF), the IEEE 802.11af standard [3] and the IEEE 802.22 standard [4]. However, the use of a geo-location database has been questioned as the best approach to accessing TV white spaces (TVWSs) [5] in some regions of Africa due to its limitations and the abundance of TVWSs that nullify the need for stringent constraints on primary user (PU) protection. Therefore, in such regions, spectrum sensing is expected to play a key role as an alternative method of accessing TVWSs.
Technical challenges of accessing TVWSs through spectrum sensing without causing interference to PUs have not been solved completely. Spectrum sensing is still haunted by spectrum sensing problems such as fading, shadowing, noise uncertainty just to mention a few. The Federal Communications Commission (FCC) may have been influenced by these spectrum sensing problems to remove the mandatory requirement that WS devices should include sensing technology to detect the signals of TV stations and low-power auxiliary service stations (wireless microphones) in its second Memorandum Opinion and Order (MO&O) [6], which determines the final rules for the use of WS devices (WSDs) in TVWS. However, the FCC continue to believe that spectrum sensing will continue to develop and improve and anticipate that some form of spectrum sensing may very well be included in television band devices (TVBDs) on a voluntary basis [1]. With this view in mind, this paper proposes some design principles for improvement on spectrum sensing as a method for TVWS access.
New design principles that can be incorporated in a WS identification system based on cooperative spectrum sensing model to further minimize probability of causing interference to the PUs are beign proposed in this paper. The proposed principles minimise probability of interference to Pus that may come due to false negatives. The proposed principles also reduce false positives in addition to reducing the probabilty of interference due to false negatives. The proposed principles include: i) use of multi-detection threshold values to identify WSs; ii) group WSs based on the threshold used; iii) deployment of virtual WSs pricing and iv) sequential access of WSs by WSDs based on threshold groups and virtual WSs pricing. These principles add an additional layer of interference protection to PUs after the cooperative spectrum sensing layer. The block diagram depicting the hierarchical flow of how the principles work is depicted in Figure 1.
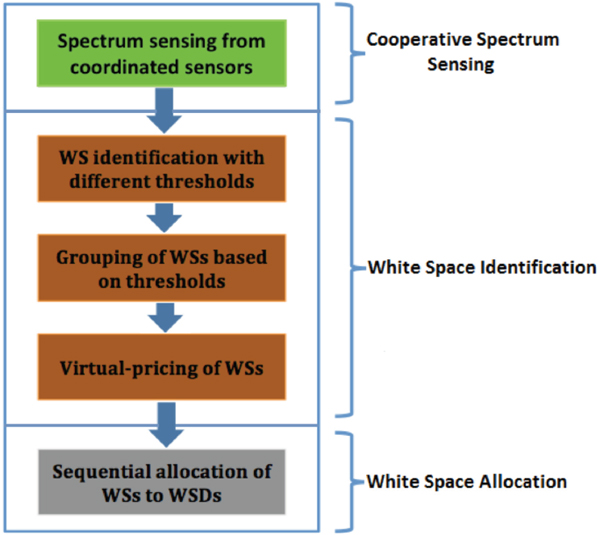
Figure 1 Hierarchical flow of how the principles work.
The main contributions of the paper are as follows:
- We propose three new principles that minimize further the probability of interference to incumbents by WS devices in a cooperative spectrum sensing model for identifying WSs. The principles have been evaluated through experimentation with real TV transmitter-allocation scheme and the results show better performance in both the number of white spaces identified and interference protection to PUs than any of the existing proposed spectrum sensing principles for either indoor or outdoor environment.
- Out of the three spectrum sensing WS identification principles being proposed in this paper, we follow them up with another proposal to allocate the WSs identified to WS devices using sequential allocation.
- We propose the first design step of WhiteNet, a WS network management platform for university campus networking that uses the proposed principles to boost the current capacity of Wi-Fi networks with bandwidth acquired through safe secondary access to WS frequencies.
The rest of the paper is structured as follows: Section 2 gives a background to some of the challenges of spectrum sensing as a method for identifying TVWSs; Section 3 introduces the principles and discusses how they foster protection of PUs; Section 4 discusses some major existing principles that can be included in a spectrum sensing-based WS identification system; Section 5 discusses how the proposed principles can be implemented; Section 6 is a discussion of the experimental evaluation of the principles and Section 7 concludes the paper.
2 Challenges of Spectrum Sensing Explained
There are several spectrum-sensing methodologies available but the most commonly used in WS identification is the energy detector-based sensing. Energy detector-based sensing works by measuring the energy contained in a spectrum band and comparing it with a set threshold value [7, 8]. If the energy level is above the threshold value, then the signal is considered present otherwise the spectrum band is considered vacant. This technique reigns superior over the other spectrum sensing techniques because of several factors: i) it is simple as it has low computational and implementation complexities [8, 9], ii) it has good performance [10–12] and iii) it is more generic as recei- vers do not need any knowledge on the PUs’ signals [7, 8].
Much as the energy detector-based sensing has these advantages over the other spectrum-sensing methodologies, it has some inherent challenges that make it less desirable as a means of accessing TVWSs, which can be summed up into inability to provide maximum protection to PUs from interference. One of its major challenge in relation to identifying TVWSs is that there is no standardized way of selecting the signal detection threshold that gives optimal performance, i.e., simultaneously giving low false positives and low false negatives. As a result, it is extremely difficult to come up with a single detection threshold that simultaneously give low false positives and low false negatives. The value chosen as the detection threshold has a major impact on the performance of the spectrum sensing equipment. If the value is too high, the technique fails to detect the presence of a TV signal in a channel thereby causing harmful interference, and if the value is too low, it gives false detection when there is actually no TV signal in the channel.
Another challenge of this technique is that it suffers from multi-path fading or shadowing that results into the hidden user problem [9]. In this scenario, a WS device is unable to detect the presence of a PU service in a channel due to obstacles that block the PU’s signal path as it propagates through the wireless medium. This leads to misinterpretation of measured data by the WS device where it thinks the channel is available and start to transmit, causing interference to the PU.
3 Proposed Principles
Design paradigm underlying any suggested model based on spectrum sensing aims at eliminating the technical challenges of spectrum sensing. This section discusses the proposed principles that are being incorporated in the cooperative spectrum sensing-based WS identification component of WhiteNet; a white space networking platform under development at the University of the Western Cape (UWC) in South Africa with the expectation of resolving some of the technical challenges associated with this method of identifying WSs.
3.1 Use of Multi-Detection Thresholds
Deciding on the threshold to be used in spectrum sensing is a challenging issue that has been at the heart of debates concerning an absolute value to be used. The sensitivity threshold of –114 dBm for Advanced Television Systems Committee (ATSC) TV signal detection as mandated by the FCC is too conservative as shown by several measurement studies [13–16]. –114 dBm is said to be conservative because it leads to significant loss of WSs [16], i.e., leads to too many false positives. For example, [13] found no TVWSs in all the locations where the studies were done in China when a sensing sensitivity threshold of –114 dBm was used. However, relaying on the analog terrestrial television (ATT) database as ground-truth data for the ATT channel occupancy situation in Beijing, setting the sensitivity threshold to –97 dBm was enough to find WS ATT channels in indoor scenarios. On the other hand, different signal detection thresholds have been used by different studies. These studies have claimed that their thresholds led to low false positives and/or low false negatives. Therefore, to compromise the two extremes, many false negatives or many false positives, the likely results when a single threshold is used, we are proposing to use more than one threshold value, which seem to be logical. The threshold values can range from –114 dBm to a value that is dependent on a country’s TV transmitter allocation scheme for transmitting sites. The FCC’s mandated detection threshold of –114 dBm is being proposed as the start threshold because it is conservative and also able to find WSs in some environments.
3.2 Group WSs Based on Thresholds Used
Instead of putting the WSs identified in one pool as is in the case where one threshold value is used, we are proposing to put them in different groups based on the thresholds values used. Assume that probability of interference to incumbents due to false negative has not been eliminated completely after cooperative spectrum sensing and use of more than one threshold principle has been applied, grouping of WSs based on the thresholds used to identify them and sequential allocation of the groups that starts with the group of WSs identified with the lowest threshold provides some level of protection to incumbents from interference due to false negative. Groups of WSs identified with lower threshold values are safer in terms of causing interference to incumbents than those WSs identified with higher threshold values; lower threshold values are conservative than higher threshold values. Assuming that at each point in time when there is a demand for WS use from WSDs, the demand is met well before using WSs identified with higher threshold values, then the proposed approach minimizes chances of interference to PUs than using random or haphazard allocation of WSs identified with a single threshold value. This assumption seem to be logical because the demand for WS use comes from local Wi-Fi devices where the demand is normally not expected to be higher than the number of WSs that may exist at a location.
3.3 Virtual Pricing of White Spaces
Up to this level, channels within any WS group as in WS groups discussed in Subsection 3.2 can only be randomly allocated to WSDs as they have not been ranked in any way in terms of probability of causing interference to incumbents. Even though one threshold is used to identify WS channels within a group, the WS channels have different probabilities of causing interference to incumbents if allocated to WSDs because of their differences in energy levels or signal strengths recorded in each channel. Consequently, random allocation of WS channels within a group is also not safe as some channels may have higher probabilities of causing interference than others. A common quantity to all WS channels within a group, for example, their energy levels/signal strengths, can be used to rank or virtual-price them in terms of probability of causing interference to the incumbents. Once they are ranked or virtual-priced, they can be sequentially allocated to WSDs. Those WS channels with higher energy levels/stronger signal strengths are virtual-priced higher than WS channels with lower energy levels/weaker signal strengths. The allocation starts with the WS channel virtual-priced lowest, i.e., one with the lowest probability of causing interference to the incumbents. It is logical to expect a channel which is not WS but has been identified as WS to have higher energy level/stronger signal strength than a channel which is actually WS on the ground; the signal measured in a channel that is not WS is a resultant signal from the incumbent’s broadcast signal plus some channel interference while that from a channel that is actually WS on the ground, the measured signal is only from channel interference. So channels that are not WSs on the ground but have been identified as WSs are expected to have higher virtual-prices than those that are actually WSs on the ground. With this approach to virtual price the WS channels within a group and sequentially allocating them to WS devices, channels with missed detection can never be allocated to any WS device unless all the channels that are actually WSs in a particular WS channel group are exhausted.
4 Existing Spectrum Sensing Design Methods
This section discusses existing spectrum sensing design methods that this work considers relevant to the implementation of a spectrum sensing-based WS identification system.
4.1 Cooperative Spectrum Sensing
Cooperation among sensing equipment is vital for the optimal performance of spectrum sensing when used as a method of identifying TVWSs because a network of spectrum sensors that share sensing information obtained from their individual locations with each other has a better chance of detecting the PU compared to local spectrum sensing [9] by a single spectrum sensor. Cooperative spectrum sensing is proposed in the literature as the solution to the hidden user problem [14, 15, 17–19] that may arise due to multi-path fading or shadowing. As mentioned in the introduction, our proposed principles rely on the results generated from cooperative spectrum sensing model as the first step to minimizing chances of interference to PUs that may arise due to multi-path fading or shadowing. If a hidden user problem still exists after cooperative spectrum sensing, then the proposed principles help to protect it further from interference.
4.2 Channel-Clustering and Location-Clustering
In their experiment, Ying et al. [20] observed that there is strong correlation in signal strength across multiple indoor locations from a single channel and that there is also strong correlations in multiple channels in their signal strengths and white space availability patterns across all locations. The observations suggest that it is possible to focus on monitoring representative channels at representative indoor locations and infer the availability of other channels at other locations by exploiting the location and channel correlations [20]. In order to do that, both channels and locations need to be clustered. Clustering both the channels and locations helps to avoid random placement of the energy detectors, which may results into waste of energy detectors, i.e., many unnecessary detectors deployed or not guarantee coverage, i.e., insufficient detectors deployed. Once the channel clustering and location clustering is done, the algorithm proposed in [20] can be used to determine placement positions for the energy detectors. Implementing the clustering principle on both channels and locationd means WSs are calculated according to location clusters. Therefore, secondary users are required to be equiped with a geographical positioning system (GPS) to enable them identify their positions before sending a request for white space use. For detailed discussion of these principles and how they can be implemented, consult [20].
5 Algorithm Implementation
The proposed principles and the existing methods that have been discussed are not environment specific, i.e., they are general principles and methods that can be implemented in a spectrum sensing-based WS identification system meant for outdoor or indoor environment. This section shows how the proposed principles can be implemented algorithmically.
5.1 WS Identification Using Multi-Thresholds and Grouping of the WSs
The method for computing TVWSs using different signal detection thresholds and grouping of the WSs identified is presented in Algorithm 1. The algorithm also shows how cooperative spectrum sensing is implemented with the two principles.
Algorithm 1: Identify white space channels using different thresholds
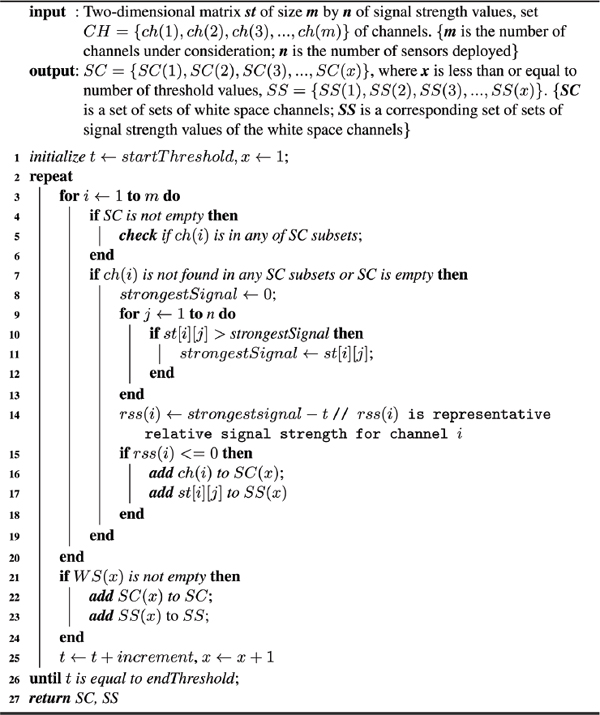
The inputs to the algorithm are signal strength values of all the channels from the frequency spectrum sensors deployed and the channels under consideration. The algorithm first checks if a channel under consideration is an already identified WS using any of the previously used threshold values if any. This is done in lines 4 to 6. This helps to make sure that each channel is not identified as WS more than once as the threshold values keep changing. Once the algorithm finds that a channel is not an already WS channel, it then compares the signal strength values for that channel from all the sensors deployed from line 9 to 13 to find the representative signal strength value, which is the strongest signal measured in that channel from all the sensors deployed. The strongest signal is used to calculate the relative signal strength for that channel by subtracting the current threshold from it in line 14. Then the algorithm checks if the channel is WS by checking if its relative signal strength is less than or equal to zero in line 15. If it is found to be WS, it is added to the set of WSs for that detection threshold in line 16. The process is repeated for all the channels using the current threshold value (lines 3 to 20). Once all the channels are considered using the current threshold value, the next threshold value is considered (line 24) and the process is repeated from the beginning (from line 2). This process is repeated until all the threshold values have been considered. The output from this algorithm is the set of sets of WS channels SC identified using different thresholds and the set of sets of signal strength values SS corresponding to the set of sets of all WS channels SC.
5.2 Compute Virtual Prices of WS Channels
Once WSs channels have been identified using the different threshold values and put into groups based on the thresholds, Algorithm 2 follows to compute their virtual prices based on signal strength recorded in each channel.
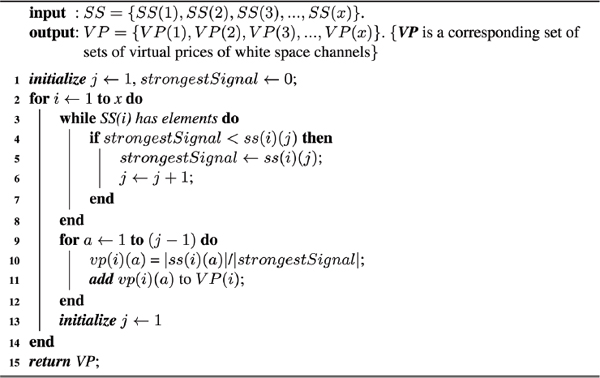
The input to the algorithm is SS, the output from Algorithm 1. The algorithm first searches through the set of signal strength values SS(i) to find the strongest signal in that set in lines 2 to 7. Then algorithm calculates the virtual price of each WS channel by dividing its absolute signal strength with the absolute strongest signal in lines 9 to 12. The process is repeated for each WS channel group SS(i) using the strongest signal in that group and the signal strengths of WS channels in the group until all WS channel groups are considered. The output of the algorithm is the set of sets of virtual prices VP corresponding to the set of sets SS of signal strength values for the WS channels.
Algorithm 2: Compute virtual prices of white space channels identified
5.3 Implementation of Proposed Principles
As mentioned in Section 3, the propsed principles have been incorporated in the cooperative spectrum sensing-based WS identification component of a white space networking platform under development at UWC in South Africa. As an example of how the principles can be implemented, the identification component of the platform is explained briefly. It consists of a central database where Algorithm 1 and Algorithm 2 are implemented. The database is connected to a number of spectrum sensors through some intermediate processing units like Raspberry Pi, which send summarised sensing information, e.g., signal strength recorded in each channel, to the dababase. Using the summarised sensing information recorded from each spectrum sensor, the database compute the available WSs and virtual-price by running Algorithm 1 and Algorithm 2 respectively. The database compute the WSs based on the detection thresholds hard-coded into Algorithm 1.
6 Experimental Evaluation
To have a better understanding of how the principles can work in real spectrum sensing-based WS identification system and evaluate their performance, we conducted short time indoor measurements at the University of the Western Cape in Cape Town, South Africa in the ultra-high frequency (UHF) band used for TV broadcasting and used the measurement data in the spectrum sensing-based WS identification component of WhiteNet. The Department of Computer Science, occupying the ground floor of Mathematical Sciences Building, was used as the experimental site. It has a floor area of approximately 560 m2. The layout of the ground floor of the building and the measurement points are shown in Figure 2. The environment for the measurement locations was regarded as the same since all the locations were on the same floor of the building and the locations covered a small area. We assumed that the spectrum sensors detected similar signal strengths from all the locations such that the same WS channels were identified from each location. That simplified the experiment since WSs did not have to be calculated based on location.
The hand-held RF Explorer model WSUB1G was used in the measurement process, which has a measurement frequency range of 240 MHz to 960 MHz. The complete technical specification of the model can be found in [21]. The model was fitted with a Nagoya NA-773 wideband telescopic antenna with vertical polarization, which has wide band measurement capability. The RF Explorer was connected to an Android phone installed with an android code that starts to measure signals as soon as the RF Explorer is connected using an OTG cable.
6.1 Detection Thresholds Used
No WSs were detected when –114 dBm was used. Therefore, different threshold values were tried by incrementing the –114 dBm sequentially with 0.5 dBm each time. The first WS was detected with –103 dBm threshold and it was taken as the start threshold. For the final detection threshold, an adequate criterion had to be used to select it to ensure maximum protection of PUs. We looked at the Draft Terrestrial Broadcasting Plan 2013 document [22] from the Independent Communications Authority of South Africa (ICASA) to see how the UHF TV channels are arranged in the band. According to the document, UHF ATT frequency band (470 MHz and 854 MHz) contains 48 channels of each 8 MHz bandwidth. The 48 channels are arranged into 12 groups of 4 channels each, which mean that 4 channels are available for assignments at any transmitting site on a national basis. In areas of great demand, 7 to 11 channels are assigned to a particular area by either combining lattice node points or using both VHF and UHF channels. The measurement site is a typical urban area, and as such, we considered it an area of great demand. This was confirmed when we examined the Tygerberg transmitting site in [22], which is the closest ATT transmitting site to UWC. There are 6 UHF channels being used by different TV stations at the site with the first TV station broadcasting from channel 22. A close examination of how these channels are allocated in the band shows that each allocated channel is spaced by at least 4 channels before the next allocated channel. We believe this allocation scheme was done to reduce interference between the allocated channels. Based on this allocation scheme, we concluded that at least the first 24 channels could not be detected as WSs at the measurement site. That was achieved with the maximum detection threshold of –102 dBm, and was considered the end detection threshold. Since small variations in threshold values have a very big impact on the amount of white spaces found [23], our detection thresholds were spaced by an absolute value of 0.5 dBm difference, resulting into the following detection thresholds; –103 dBm, –102.5 dBm and –102 dBm.
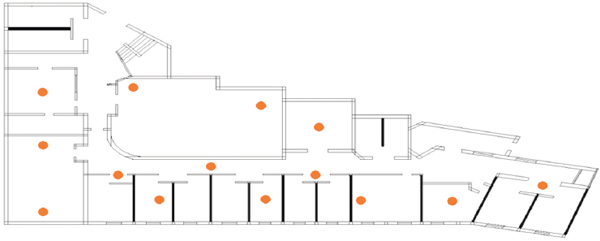
Figure 2 Layout of the building and measurement points.
6.2 Measurement Results
Since we were interested with the temporal distribution of WSs, the signal measurements were taken for only 120 seconds at each location. The 120 seconds included the signal amplitude stability time. Observation of the data showed that after about 90 seconds into the measurement, the signal amplitude stabilised to within +/- 5 dBm. Therefore, only the data recorded in the last 30 seconds of the measurement at each location was used for calculating the average received signal strength, which was regarded as the temporal signal strength for that channel at that location.
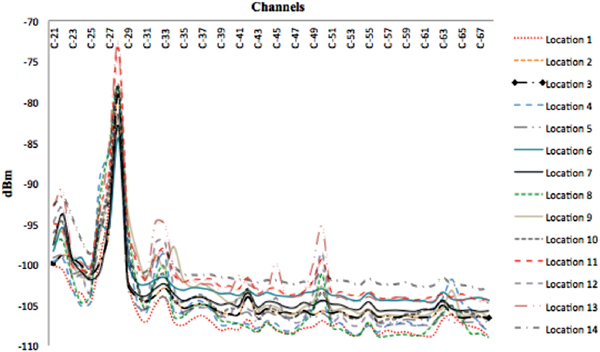
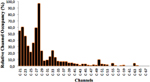
Figure 3 Signal strengths recorded from all locations.
Figure 3 shows the temporal signal strengths recorded in each channel from the 14 locations. The standard deviation of the signal strength for each channel recorded from the 14 locations is shown in Table 1. It is easy to see from the table that the standard deviation of the signals for most of the channels was below 2 dBm. The largest standard deviation was 3.8 dBm from channel 27. The small standard deviations signify that the signals collected in a particular channel from the 14 locations varied very little from one location to another. The results confirm the validity of our assumption that the spectrum sensors detect similar signal strengths for each channel under consideration from the locations.
The temporal signal strength recorded in each channel from each of the 14 locations was fed into the Algorithm 1 to calculate the WSs. Table 2 shows the WS channels that were found with the three thresholds. The relative spec trum occupancy for all the channels for each of the three threshold is shown from Figure 4 to Figure 6. The relative spectrum occupancy for each channel was defined by the following three equations:
Table 1 Standard deviation of signal strengths collected from the 14 measurement locations (+/- dBm)
| Channel | 21 | 22 | 23 | 24 | 25 | 26 | 27 | 28 | 29 | 30 | 31 | 32 |
| STDEV | 2.6 | 3.0 | 2.2 | 2.2 | 1.8 | 3.4 | 3.8 | 3.4 | 3.2 | 2.2 | 1.9 | 2.9 |
| Channel | 33 | 34 | 35 | 36 | 37 | 38 | 39 | 40 | 41 | 42 | 43 | 44 |
| STDEV | 2.7 | 2.7 | 2.0 | 1,6 | 1.5 | 1.7 | 1.9 | 1.9 | 2.0 | 2.0 | 1.9 | 1.6 |
| Channel | 45 | 46 | 47 | 48 | 49 | 50 | 51 | 52 | 53 | 54 | 55 | 56 |
| STDEV | 2.3 | 1.9 | 1.8 | 1.7 | 2.1 | 3.3 | 1.7 | 1.7 | 1.9 | 1.9 | 1.7 | 1.9 |
| Channel | 57 | 58 | 59 | 60 | 61 | 62 | 63 | 64 | 65 | 66 | 67 | 68 |
| STDEV | 1.7 | 1.8 | 1.7 | 1.7 | 1.7 | 1.6 | 1.4 | 1.5 | 1.4 | 1.5 | 1.6 | 1.8 |
Table 2 White spaces identified with different thresholds
| Threshold (dBm) | No. of WSs Identified | Channel (s) |
| –103 | 1 | 67 |
| –102.5 | 8 | 54, 57, 60, 61, 62, 65, 66, 68 |
| –102 | 11 | 43, 46, 47, 48, 49, 52, 53, 56, 58, 59, 64 |
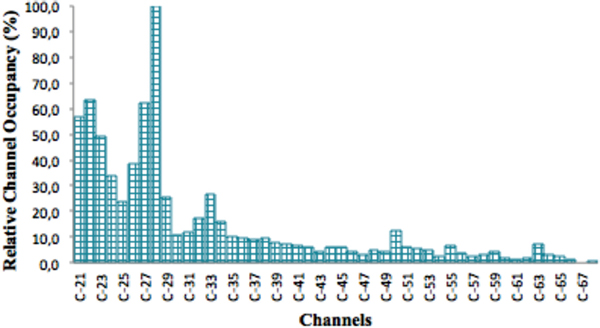
Figure 4 Spectrum occupancy with –103 dBm threshold.
where ORS(i) is the relative spectrum occupancy in channel i, RSS is the relative signal strength collected in channel i using threshold Tj, SS(i) is the representative signal strength in channel i, which is equal to the strongest signal measured in channel i out of the 14 locations and M(i,Tj) is the maximum relative signal strength in the band collected in channel i using threshold Tj.
The WS channels groups and the corresponding signal strengths of WS channels groups were fed into Algorithm 2 to calculate their virtual prices, which are shown in Table 3.

Figure 5 Spectrum occupancy with –102.5 dBm threshold.
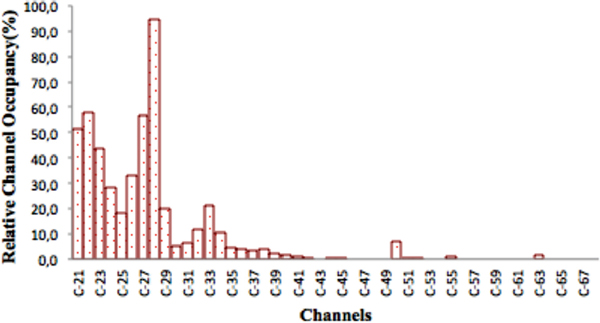
Figure 6 Spectrum occupancy with –102 dBm threshold.
Table 3 Prices for white space channels
| WS Channel Group | WS Channels with Their Prices |
| –103 dBm | 67:1.000 |
| –102.5 dBm | 54:0.997, 57:0.996, 60:0.998, 61:0.998, 62:0.997, 65:0.997, 66:0.998, 68:1.000 |
| –102 dBm | 43:0.998, 46:0.997, 47:1.000, 48:0996, 49:0.998, 52:0.995, 53:0.996, 56:0.999, 58:1.000, 59:0.997, 64:1.000 |
Table 4 Statistical analysis of current and proposed methods based on thresholds used
| Method Type | Threshold(s) | Allocation Type | No. of WSs Generated | Probability Interference |
| 103 or | random | 1 | 0 | |
| Current Methods | 102.5 or | random | 9 | 0 |
| 102 | random | 20 | > 0 | |
| Proposed Methods | 103, 102.5, 102 | sequential | 20 | 0 |
6.3 Simple Evaluation of Proposed Design Principles Against Existing Proposals
Based on the thresholds used and the WSs generated, an evaluation is made between the current spectrum sensing methods for identification and allocation of the WSs to WSDs and our proposed methods for identification and allocation of WS to WSDs based on the number of WSs identified and the probability of causing interference to incumbents. Table 4 shows the results of the evaluation. The following assumptions are made:
- Some thresholds are conservative leading to identification of channels which are indeed WSs on the ground while other thresholds are not conservative leading to identification of some channels which are not WSs on the ground, and these channels only appear in the last group, i.e., 102 dB threshold.
- Demand for WS use is local and the actual WSs available at a location are enough to met the local demand.
6.4 Discussion
The grouping of WS channels as show in Table 2 helps to start allocating them to WSDs with the safest group, which is the one detected with –103 dBm in this case. The least safest group of WSs out of the three groups is the one identified with –102 dBm threshold. WSs in this group are allocated only if the demand for WS use is not met after using the WSs in the first two groups. If there are any missed detections from some channels in the group and the demand for WS use is met before using the channels in that group, then the PUs in those channels are protected from interference. It is different if the WS channels are identified using one threshold and they are also allocated randomly to WSDs as it can be seen from Table 4. Note that the number of WSs identified using one threshold is always less than or equal to the number of WSs identified using more than one threshold. For example, the current methods can use either of the three thresholds; –103 dBm or –102.5 dBm or –102 dBm. If –103 dBm is used, only 1 WS is found and if –102.5 dBm is used, only 9 WSs are found and if –102 dBm is used, 20 WSs. As seen fro the table, when the number of WSs identified with one threshold is equal to the number of WSs identified with more than one threshold, the probability of causing interference to incumbents is greater than zero with the current methods. This is so because channels which are not WSs but have been identified so, can be allocated to a WS device because of the random allocation used by current methods although there are still some channel, which are actually WSs on the ground that have not been allocated.
An additional layer of security is provided within a group of WSs if the channels are virtual-priced based on the signal strengths in the channels. Channels with stronger signals are priced higher than channels with weaker signals as shown in Table 3 because channels with stronger signals are the ones that are more likely to have PUs in them than channels with weaker signals. For example, looking at WS channel group identified with –102 dBm in Table 3, allocating the cheapest channels such as 52, 53, 48 first to WS devices adds some protection to the expensive channels such as 47, 58 and 64, which are the most likely channels to result into false negatives in that group. In this case, allocating the channels sequentially based on the lowest prices, starting with channel 52, provides some level of protection to the expensive channels such as channel 47 or channel 58 if there was missed detection in them.
7 Conclusion and Future Work
In this paper, we proposed three design principles that have been included in a spectrum sensing-based white space identification system to reduce further chances of interference to PUs due to false negatives after cooperative spectrum sensing. The principles were experimented in the white space network platform for campus connectivity at the University of the Western Cape in South Africa using real measurement data in the UHF band used for ATT broadcasting. The results show that the application of the principles can reduce the probability of interference to PUs to some extent.
As a first design step of WhiteNet; a white space network management platform for campus networking, spectrum sensing design principles have been proposed and implemented using real TV-transmitter signal measurements. For the proposed principles to work efficiently, they require redesigning existing network management techniques to manage white spaces. Cost-based traffic engineering techniques such as proposed in [24, 25] will also need to be redesigned as PU protection mechanisms using cost metrics to reflect the white space availability under primary and secondary usage. The integration of parallel path models [26, 27] in white space bonding deployments and the use of white space for long distance wireless deployments [28, 29] are other avenues for future work. The design of market pricing mechanisms to protect PUs while managing white spaces to meet quality of service (QoS) agreements between the offered traffic and the available spectrum is another avenue for future research. The design of low cost white space gateway devices building around the emerging Raspberry pi hardware and the flexibility and robustness principles proposed in [30, 31] is another direction for future research.
References
[1] V. Gonçalves and S. Pollin. The value of sensing for TV white spaces. New Frontiers in Dynamic Spectrum Access Networks (DySPAN), 2011 IEEE Symposium on, 231–241, 2011.
[2] L. Zhu and V. Chen and J. Malyar and S. Das and P. McCann. Protocol to Access White-Space (PAWS) Databases. 2015.
[3] IEEE Standards Association. 802.11af – IEEE Standard for Information technology – Telecommunications and information exchange between systems – Local and metropolitan area networks - Specific requirements – Part 11: Wireless LAN Medium Access Control (MAC) and Physical Layer (PHY) Specifications Amendment 5: Television White Spaces (TVWS). IEEE, 2013, http://standards.ieee.org/getieee802/download/ 802.11af-2013.pdf.
[4] IEEE Standards Association. 802.22-2011 – IEEE Standard for Information technology – Local and metropolitan area networks – Specific requirements – Part 22: Cognitive Wireless RAN Medium Access Control (MAC) and Physical Layer (PHY) specifications: Policies and procedures for operation in the TV Bands. IEEE, 2011, http://standards.ieee.org/getieee802/download/802.22-2011.pdf.
[5] E. Pietrosemoli and M. Zennaro. TV White Spaces. A pragmatic approach. ISTB, 35–40, 2013.
[6] Federal Communications Commission and others. Second memorandum opinion and order in the matter of unlicensed operation in the tv broadcast bands and additional spectrum for unlicensed devices below 900 Mhz and in the 3 Ghz band. 2010.
[7] H. Urkowitz. Energy detection of unknown deterministic signals. Proceedings of the IEEE 55(4):523–531, 1967.
[8] M. A. Abdulsattar and Z. A. Hussein. Energy Detector with Baseband Sampling for Cognitive Radio: Real-Time Implementation. Wireless Engineering and Technology, 3(04):229, 2012. Scientific Research Publishing.
[9] T. Yücek and H. Arslan A survey of spectrum sensing algorithms for cognitive radio applications. Communications Surveys & Tutorials, IEEE, 11(1):16–130, 2009.
[10] P. Lingeswari and K. J. Prasanna Venkatesan and V. Vijayarangan. Legacy User Detection in OFDM based Cognitive Radio. International Conference on Recent Trends in Computational Methods, Communication and Controls (ICON3C 2012), 2012. http://research.ijcaonline.org/icon3c/number7/icon3c1053.pdf.
[11] N. Yadav and S. Rathi. A comprehensive study of spectrum sensing techniques in cognitive radio. International Journal of Advances in Engineering & Technology, 1(3):85, 2011. IAET Publishing Company.
[12] Z. Sun. Design and Implementation of Sequence Detection Algorithms for Dynamic Spectrum Access Networks. University of Notre Dame, 2010.
[13] L. Yin and K. Wu and S. Yin and J. Li and S. Li and L. M. Ni. Digital dividend capacity in China: A developing country’s case study. Dynamic Spectrum Access Networks (DYSPAN), 2012 IEEE International Symposium on, 121–130, 2012.
[14] T. Zhang and N. Leng and S. Banerjee. A vehicle-based measurement framework for enhancing white space spectrum databases. Proceedings of the 20th annual international conference on Mobile computing and networking, 17–28, 2014. ACM.
[15] G. Naik and S. Singhal and A. Kumar and A. Karandikar. Quantitative assessment of TV white space in India. Communications (NCC), 2014 Twentieth National Conference on, 1–6, 2014. IEEE.
[16] S. M. Mishra and A. Sahai. How much white space has the FCC opened up? IEEE Communication Letters, 2010.
[17] Y. Zeng and Y. C. Liang and A. T. Hoang and R. Zhang. A review on spectrum sensing for cognitive radio: challenges and solutions. EURASIP Journal on Advances in Signal Processing 2, 2010. Hindawi Publishing Corp.
[18] P. G. Scholar. An overview of cognitive radio architecture. Journal of Theoretical and Applied Information Technology 41(1):2012.
[19] J. Milanović and S. Rimac-Drlje and I. Majerski. Radio wave propagation mechanisms and empirical models for fixed wireless access systems. Tehnički vjesnik: znanstveno-stručni časopis tehničkih fakulteta Sveučilišta u Osijeku 17(1):43–52, 2010. Hrvatska znanstvena bibliografija i MZOS-Svibor.
[20] X. Ying and J. Zhang and L. Yan and G. Zhang and M. Chen and R. Chandra. Exploring indoor white spaces in metropolises. Proceedings of the 19th Annual International Conference on Mobile Computing & Networking, 255–266, 2013. ACM.
[21] RF Explorer: Handheld Spectrum Analyser. RF Explorer Combo Devices Specification Chart. Nuts About Nets, http://rfexplorer.com/combo-specs/.
[22] ICASA. Draft Terestrial Broadcasting Frequency Plan 2013. Independent Communications Authority of South Africa (ICASA).
[23] M. Lopez-Benitez and F. Casadevall Spectrum usage in cognitive radio networks: from field measurements to empirical models. IEICE Transactions on Communications 97(2):242–250, 2014. The Institute of Electronics, Information and Communication Engineers.
[24] A. B. Bagula. Hybrid routing in next generation IP networks. Computer Communications 29(7):879–892, 2006. Elsevier.
[25] A. B. Bagula. On Achieveing Bandwidth-Aware LSP//spl lambda/SP Multiplexing/Separation in Multi-layer Networks. Selected Areas in Communications, IEEE Journal on 25(5):987–1000, 2007.
[26] A. B. Bagula and A. E. Krzesinski. Traffic engineering label switched paths in IP networks using a pre-planned flow optimization model. Modeling, Analysis, and Simulation of Computer and Telecommuni- cation Systems, 2001. Proceedings. Ninth International Symposium on, 70–77, 2001. IEEE.
[27] A. B. Bagula. Modelling and implementation of QoS in wireless sensor networks: a multiconstrained traffic engineering model. EURASIP Journal on Wireless Communications and Networking, 2010. Hindawi Publishing Corp.
[28] M. Zennaro and A. Bagula and D. Gascon and A. B. Noveleta. Planning and deploying long distance wireless sensor networks: The integration of simulation and experimentation. Ad-Hoc, Mobile and Wireless Networks 191–204, 2010. Springer.
[29] M. Zennaro and A. Bagula and D. Gascon and A.B. Noveleta. Long distance wireless sensor networks: simulation vs reality. Proceedings of the 4th ACM Workshop on Networked Systems for Developing Regions, 2010. ACM.
[30] M. Zennaro and A. B. Bagula. Design of a flexible and robust gateway to collect sensor data in intermittent power environments. International Journal of Sensor Networks 8(3–4):172–181, 2010. Inderscience Publishers.
[31] A. Arcia-Moret and E. Pietrosemoli and M. Zennaro. WhispPi: White Space Monitoring with Raspberry Pi Global Information Infrastructure Symposium, 2013, 1–6, 2013. IEEE.
Biographies

H. Mauwa received his M.Sc. degree in Information Technology in 2007 from Nelson Mandela Metropolitan University (NMMU) in South Africa and is presently studying towards his Ph.D. in Computer Science at the University of the Western Cape (UWC) also in South Africa. His Ph.D. research focuses on methods for accessing TV white spaces in developing countries.

A. Bagula obtained his doctoral degree in 2006 from the KTH-Royal Institute of Technology in Sweden. He held lecturing positions at Stellenbosch University (SUN) and the University of Cape Town (UCT) before joining the Computer Science department at the University of the Western Cape in January 2014. Since 2006, he has been a consultant of UNESCO, the World Bank and other international organizations on different telecommunication projects. His research interest lies on the Internet-of-Things, Big Data and Cloud Computing, Network security and Network protocols for wireless, wired and hybrid networks.

M. Zennaro received his M.Sc. degree in Electronic Engineering from University of Trieste in Italy. He defended his Ph.D. thesis on Wireless Sensor Networks for Development: Potentials and Open Issues at KTH-Royal Institute of Technology, Stockholm, Sweden. His research interest is in ICT4D, the use of ICT for development. In particular, he is interested in Wireless Networks and in Wireless Sensor Networks in developing countries. He has been giving lectures on Wireless technologies in more than 20 countries.
Journal of ICT, Vol. 3, 177–200.
doi: 10.13052/jicts2245-800X.331
© 2016 River Publishers. All rights reserved.