Focal and Non-Focal EEG Signal Classification by Computing Area of 2D-PSR Obtained for IMF
R. Krishnaprasanna1,* and V. Vijaya Baskar2
- 1Research scholar, Department of ECE, Sathyabama University,Chennai, Tamil Nadu-600119, India
- 2Professor, Department of ETCE, Sathyabama University,Chennai, Tamil Nadu-600119, India
E-mail: krish.ece87@gmail.com; v_vijaybaskar@yahoo.co.in
*Corresponding Author
Received 04 January 2018;
Accepted 18 January 2018
Abstract
The Electroencephalogram (EEG) signals are typically used indicators for the detection of epileptic seizures in the human brain by placing sensors in the scalp of the brain. In this paper, we classify focal (F) and non-focal (NF) EEG signals by computing the area of 2D-PSR obtained for intrinsic mode functions (IMFs). IMFs are obtained by disintegrating the EEG signals using Empirical mode decomposition (EMD). The main objective of this work is to classify the focal and non-focal EEG signal for the medical purpose. The proposed technique namely area of 2D-PSR method has provided promising class accuracy for classification of focal and non-focal EEG signals which gives 98.95% accuracy with polynomial and RBF kernal.
Keywords
- Focal and Non-Focal EEG signal
- Empirical mode decomposition (EMD)
- Intrinsic mode function (IMF)
- 2D-PSR (phase space representation)
1 Introduction
Epilepsy is the neurological sickness of the human brain which can have an effect on people of all ages. The electroencephalogram (EEG) signals are normally used for detection of epileptic seizures. EEG signals are classified into two types namely Focal and non-Focal EEG signals, the proposed method uses the pattern entropies and variances of the intrinsic mode functions (IMFs) obtained by empirical mode decomposition (EMD) of EEG signal. The average sample entropy (ASE) of IMFs and average variance of instantaneous frequencies (AVIF) of IMFs for separate EEG signal have been used as functions for classifying type of Focal and non-Focal EEG signals. (Rajeev sharma, Ram bilas pachori & shreya gautam, 2014). Electroencephalogram (EEG) is broadly utilized signals for the scientific analysis of
In this case, about 20% of patients are with primary generalized epilepsy and about 60% of patients who have Focal epilepsy in increase of drug resistance (S. Pati and A.V. Alexopoulos, 2010). Focal epilepsy is a type of epilepsy where onset of epilepsy takes place within the constrained location of brain. Recording of signals from the brain wherein the primary ictal EEG signal adjustments are detected may be defined as “Focal EEG signals. Other signals recorded from other regions of brain, which is not participating in seizure onset, referred to as “Non-Focal EEG signals (R.G. Andrzejak, K. Schindler, and C. Rummel, 2012). Enormous studies primarily based on the signal processing approach has been finished for computerized analysis, detection and classification of epileptic seizure EEG signals. One of the essential characteristics of seizure is presence of spikes in EEG signals used to detect the onset of seizure (S. Mukhopadhyay & G.C. Ray, 1998; L.D. Iasemidis, et al., 2003). The parameters extracted from EEG signals are very beneficial for seizure detection and discrimination. Assuming the character of EEG signals such as stationary, time-domain parameters and spectral parameters based on fourier transform, have been employed for automatic detection and diagnosis of epileptic seizure EEG signal (V. Srinivasan, C. Eswaran, & N. Sriraam, 2005; K. Polat and S. Günes, 2007). Numerous strategies evolved for epileptic seizure detection are based on linear prediction (lp) (S. Altunay, Z. Telatar, and O. Erogul, 2010) and fractional linear prediction (flp)
Empirical mode decomposition (EMD) is proposed (N.E. Huang et al. in 1998) that is suitable for analysis of non-linear and non-stationary signals. These days’ new strategies were proposed for evaluation and classification of epileptic seizure EEG signals based on EMD (R.B. Pachori, 2008; Y. Xia & D.P. Mandic, 2010). The suggest frequency of each intrinsic mode function (IMF) has been proposed as a feature to perceive distinction among ictal and seizure free EEG signals (R.B. Pachori, 2008). Normal and seizure EEG signals are in comparison on the premise of Hilbert weighted frequencies of various IMFs (R.J. Oweis and E.W. Abdulhay, 2011). Area computed from the hint of analytic signal illustration of IMF, is located to be useful parameter for analysis of normal and epileptic seizure EEG signals. (R.B. Pachori and V. Bajaj, 2011). Fourier-bessel expansion has been used to calculate mean frequency of IMFs and region of analytical imf has been computed using modified vital tendency degree (CTM) (V. Bajaj and R.B. Pachori, 2011). These computed area and mean frequency of IMFs are used to perform class of seizure EEG signals. The coefficient of variation and fluctuation index of IMFs were proposed as features for recognition of ictal EEG signals (S. Li et al., 2013). Detection of epileptic seizure has been performed using immediate vicinity computation of IMFs (V. Bajaj & R.B. Pachori, 2013). The amplitude modulation (AM) bandwidth and frequency modulation (FM) bandwidths of IMFs were used as features to categorise seizure and non-seizure EEG signals (V. Bajaj & R.B. Pachori, 2012). For detection of seizure in EEG signals, multivariat EMD has been utilized in (Y. Xia, and D.P. Mandic, 2010). Currently area of elliptical pattern, received from 2nd order distinction plot of IMF has been used as feature for seizure type (R.B. Pachori and S. Patidar, 2014). The signal processing technique can be evolved for discrimination between Focal and non-Focal EEG signals, for epilepsy diagnostics before surgical operation. Detection of Focal and non-Focal channel might also resource in localizing the area of Focal epilepsy. It should be cited that the localizing the area of Focal epilepsy may be useful in pre-surgical analysis of epilepsy. Consequently, we provide a new method based totally on EMD and sample entropy (J.S. Richman & J.R. Moorman, 2000; V. Bajaj and R.B. Pachori, 2011) for discrimination among Focal and non-Focal EEG signals. Firstly, EMD has been used because the technique for decomposing EEG signal into IMFs for each signal of EEG signal pair (R.G. Andrzejak, K. Schindler, and C. Rummel, 2012). Average sample entropy (ASE) and average variance of instantaneous frequencies (AVIF) of IMFs have been computed and proposed as capabilities to classify two types of EEG signals.
2 Methodology
2.1 Dataset
The EEG dataset used in this paper is available publicly in Andrzejak et al. (2012) has been used. The dataset includes intracranial EEG recordings from five epilepsy patients who had longstanding drug resistant temporal lobe epilepsy thereby making them candidates for surgical operation. The sampling of EEG alerts has been completed at 512 or 1024 Hz sampling frequency relying on range of channels being much less or more than 64. Focal EEG channels are described as all those channels that detected first ictal EEG sign changes as judged through at the least two neurologists who are certified electroencephalographers. There are 3750 pairs of randomly selected signals to be had in dataset, for each focal and non-focal EEG signal. Every pair incorporates two EEG alerts Specifically x and y which might be recorded from adjoining channels. The area of 2D-PSR method approach has been applied over first 50 focal and 50 non-focal EEG alerts available
2.2 Empirical Mode Decomposition
The empirical mode decomposition (EMD) is developed from the assumption that any signal consists of different simple intrinsic mode of oscillations. It is an adaptive signal decomposition technique which represents any
The IMFs of a signal must satisfy the following conditions:
- In the whole data set, the number of extrema and the number of zero-crossings must either equal or differ at most by one and
- At any point, the mean value of the envelopes defined by the local maxima and the local minima is zero.
The EMD algorithm for the signal x(t) can be summarized by the following steps:
- Extract all the extrema of x(t)
- Interpolate between respective minima and maxima to obtain two envelopes em(t) and el(t)
Compute the average as:
Extract d(t) (decomposed signal) from m(t) as:
- Check, if the d(t) satifies the above mentioned conditions for IMF or not.
- Repeat steps 1–5, for d(t) until it satisfies the conditions for IMF.
Once the IMF is obtained, define the IMF1(t) = d(t). Now calculate a residual signal r(t). r(t) can be obtained by
Which acts as the new signal to extract the next IMF by applying shifting process. The sifting technique is repeated till the residual r(t) will become monotonic characteristic from which, similarly no extra imf may be mined. Finally, the signal m(t) is given by the sum of IMFs and a residual
Where M is number of extracted IMFs and r(t) is residual. Figure 1 depicts an example of seizure free EEG signal with its 12 imfs and Figure 2. Depicts an example of seizure EEG signal with its 10 imfs.
2.3 Computation of Area of 2D-PSR
The imfs are symmetric am-fm components and might offer precious diagnostic functions for the classification of epileptic seizure and seizure free EEG signals. The signal X(n) can be delayed by one by one unit
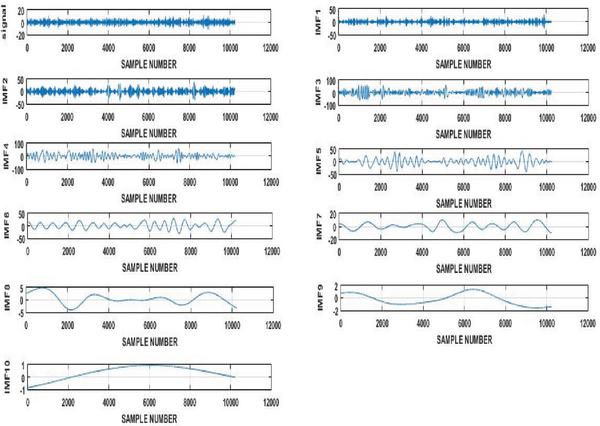
Figure 1 Empirical mode decomposition of Focal EEG signal.
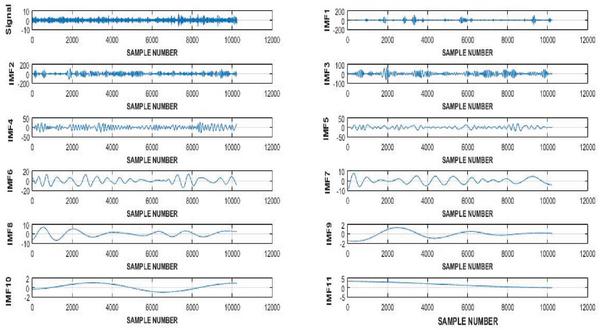
Figure 2 Empirical mode decomposition of Non-Focal EEG signal.
and denoted as X(n+1) and X(n+2). X(n) can be defined by the difference between X(n+1) and X(n) by time delay method which is frequently used (Takens, 1981) also the signal Y(n) can be defined by the difference between X(n+2) and X(n+1) in the same way. For phase space reconstruction, which is given by equation as
Now the X(n) is plotted against Y(n) that gives us the 2D-PSR for the IMFS of Seizure free and Seizure signals.
Computing the mean values of X(n),Y(n) as:
From the above parameters Major axis (Maj), Minor axis (Min), the area of 2D-PSR is computed as:
Area of 2D-PSR = π * Maj*Min
2.4 Support Vector Machine (SVM)
An SVM classifies statistics with the aid of locating the first-class hyperplane that separates all data points of one class from the ones of the alternative class. The best hyperplane for an SVM means the one with the largest margin between the two classes. Margin means the maximal width of the slab parallel to the hyperplane that has no interior data points. It is a machine learning method based totally on statistical learning concept and useful for pattern recognition problem. The radial basis function (RBF) kernel can be defined as
In this work, the kernel such as Linear, RBF, polynomial is used in the SVM as the classifier to classify the focal and non-focal EEG signal. The effectiveness of the classifier can be evaluated the usage of unique parameters. If TP and TN are the total number of correctly identified true positive samples and true negative samples respectively and FP and FN are the total number of correctly identified false positive samples and false negative samples respectively then the performance parameters can be defined as: Sensitivity is a degree which suggests the proportion of the high quality samples from take a look at set, efficaciously diagnosed as positive samples. Specificity is a degree of potential of classifier to as it should be perceive share of negative samples successfully recognized from the bad samples. Accuracy is described as the proportion of the samples successfully categorized out of total number of samples. Positive predictive value is the ratio of genuine fine values to the full range of fantastic samples identified by using classifier. Negative predictive value is the ratio of genuine negative values to the whole range of negative samples identified with the aid of classifier. All these parameters can be calculated by the formula given in the Table 1.
Table 1 Statistical parameters for performance evaluation
| Sensitivity | |
| Specificity | |
| Accuracy | |
| Positive predictive value | |
| Negative predictive value | |
| Mathews Correlation Coefficient | |
| Error rate prediction |
3 Results and Discussion
The difference equation (5 and 6) is plotted among them to identify the exact point where the sudden spike occurs. Figures 1 and 2 shows the Empirical mode decomposition of Focal and Non-focal EEG signal. Figures 3 and 4 shows two dimensional phase space representation of Focal and Non-Focal EEG signal. Figure 5 shows the comparison of area of 2D-PSR for first 4 imfs of focal and non-focal EEG signals for a window length of 10000. The obtained feature vector is given as input to Linear, RBF, and Polynomial kernal SVM classifier to evaluate the performance for the whole dataset in both the cases. Five-fold cross validation process has been employed to make sure the reliability and balance of the overall performance assessment of linear,
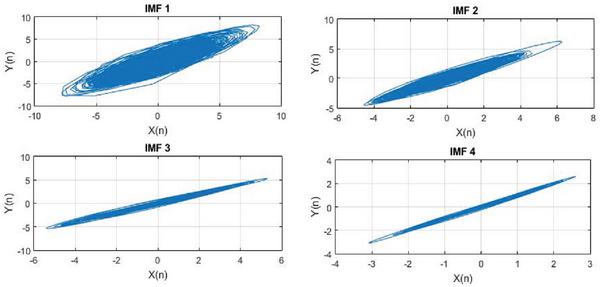
Figure 3 2D-PSR of Focal EEG signal.
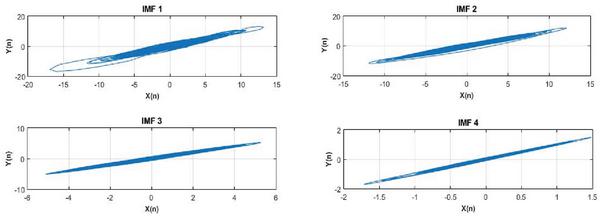
Figure 4 2D-PSR of Non-Focal EEG signal.
RBF and Polynomial kernal classifier. The Different statistical parameters are measured to show the effectiveness of the classifier which are: Sensitivity, Specificity, Accuracy, Positive predictive value, Negative predictive value, Matthews correlation coefficient and Error rate prediction which are calculated as shown in the Table 1. The statistical parameters such as sensitivity, specificity, accuracy, positive predictive value, Negative predictive value, Matthews correlation coefficient and Error rate prediction are calculated for 10000 window size from the area of 2D-PSR method which is shown in Table 2.
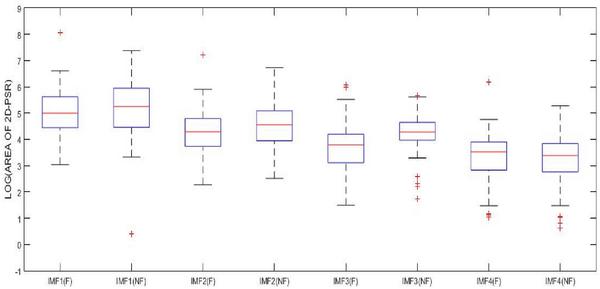
Figure 5 Comparison of area of 2D-PSR for first 4 imfs of focal and non-focal EEG signals for a window length of 10000.
Table 2 Statistical parameter values obtained
| Performance Parameters (10000 window size) |
Linear | Polynomial | RBF |
| Sensitivity (%) | 93.6 | 97.9 | 97.9 |
| Specificity (%) | 93.6 | 97.9 | 97.9 |
| Accuracy (%) | 96.8 | 98.95 | 98.95 |
| Positive predictive value (%) | 93.98 | 97.94 | 97.94 |
| Negative predictive value (%) | 93.6 | 97.9 | 97.9 |
| Mathews Correlation Coefficient | 0.938 | 0.979 | 0.979 |
| Error rate prediction (%) | 6.4 | 2.1 | 2.1 |
The experimental results have been found promising indicating significant discrimination ability for the classification of Focal and Non-focal classes. The highest overall classification accuracy obtained 98.95% in the case of Polynomial and RBF kernal.
4 Conclusion
This research shown that the area of 2D-PSR method is better in the classification of the focal and non-focal EEG signal with better accuracy than the existing methods. The empirical mode decomposition (emd) technique is a beneficial and promising technique to decompose EEG signal into a hard and fast of imfs. The emd is based totally at the nearby characteristic time scale of signal and relevant to nonlinear and non-motionless processes. The obtained IMFs are shifted by a time variant and plotted against the future shifting sequence which gives an ellipse structure that paves the way to calculate the area of two dimensional PSR. The experimental results show that the extracted features of focal and non-focal EEG signal are effective and satisfying statistical parameters such as sensitivity, specificity etc. as given in Tables 1 and 2 can be achieved with linear, polynomial and RBF kernal. The area of 2D-PSR set of rules will be useful for discriminating seizures from seizure unfastened durations for intracranial or scalp EEG recordings, and warn seizure inception for medical doctors, caretakers and patients. From our type results, it’s far virtually indicated that the RBF and polynomial kernel had supplied 98.95% in the class of focal and non-focal EEG signals. In future, the area of 2D-PSR method may be studied for the category of sleep degrees of human brain, class of human emotions using EEG signals.
References
[1] Sharma, R., Pachori, R. B., and Gautam, S. (2014). Empirical mode decomposition based classification of focal and non-focal seizure EEG signals. In International Conference on Medical Biometrics, 135–140. IEEE.
[2] Pati, S., and Alexopoulos, A. V. (2010). Pharmacoresistant epilepsy: from pathogenesis to current and emerging therapies. Cleve. Clin. J. Med., 77(7), 457–567.
[3] Andrzejak, R. G., Schindler, K., and Rummel, C. (2012). Nonrandomness, nonlinear dependence, and nonstationarity of electroencephalographic recordings from epilepsy patients. Physical Review E, 86(4), 046206.
[4] Mukhopadhyay, S., and Ray, G. C. (1998). A new interpretation of nonlinear energy operator and its efficacy in spike detection. IEEE Transactions on Biomedical Engineering, 45(2), 180–187.
[5] Iasemidis, L. D., et al. (2003). Adaptive epileptic seizure prediction system. IEEE Transactions on Biomedical Engineering, 50(5), 616–627.
[6] Srinivasan, V., Eswaran, C., and Sriraam, A. N. (2005). Artificial neural network based epileptic detection using time-domain and frequency-domain features. J. Med. Sys., 29(6), 647–660.
[7] Polat, K., and Güneş, S. (2007). Classification of epileptiform EEG using a hybrid system based on decision tree classifier and fast Fourier transform. Applied Mathematics and Computation, 187(2), 1017–1026.
[8] Altunay, S., Telatar, Z., and Erogul, O. (2010). Epileptic EEG detection using the linear prediction error energy. Expert Systems with Applications, 37(8), 5661–5665.
[9] Joshi, V., Pachori, R. B., and Vijesh, A. (2014). “Classification of ictal and seizure-free EEG signals using fractional linear prediction,” Biomedical Signal Processing and Control, 9, 1–5.
[10] Tzallas, A. T., Tsipouras, M. G., and Fotiadis, D. I. (2007). Automatic seizure detection based on time-frequency analysis and artificial neural networks. Computational Intelligence and Neuroscience, 2007.
[11] Tzallas, A. T., Tsipouras, M. G., and Fotiadis, D. I. (2009). Epileptic seizure detection in EEGs using time–frequency analysis. IEEE Transactions on Information Technology in Biomedicine, 13(5), 703–710.
[12] Adeli, H., Zhou, Z., and Dadmehr, N. (2003). Analysis of EEG records in an epileptic patient using wavelet transform. Journal of Neuroscience Methods, 123(1), 69–87.
[13] Khan, Y. U., and Gotman, J. (2003). Wavelet based automatic seizure detection in intracerebral electroencephalogram. Clinical Neurophysiology, 114(5), 898–908.
[14] Ghosh-Dastidar, S., Adeli, H., and Dadmehr, N. (2007). Mixed-band wavelet-chaos-neural network methodology for epilepsy and epileptic seizure detection. IEEE Transactions on Biomedical Engineering, 54(9), 1545–1551.
[15] Ocak, H. (2009). Automatic detection of epileptic seizures in EEG using discrete wavelet transform and approximate entropy. Expert Systems with Applications, 36(2), 2027–2036.
[16] Adeli, H., Ghosh-Dastidar, S., and Dadmehr, N. (2007). A wavelet-chaos methodology for analysis of EEGs and EEG subbands to detect seizure and epilepsy. IEEE Transactions on Biomedical Engineering, 54(2),
[17] Subasi, A. (2007). EEG signal classification using wavelet feature extraction and a mixture of expert model. Expert Systems with Applications, 32(4), 1084–1093.
[18] Uthayakumar, R., and Easwaramoorthy, D. (2013). Epileptic seizure detection in EEG signals using multi-fractal analysis and wavelet transform. Fractals, 21(02), 1350011.
[19] Guo, L., Rivero, D., and Pazos, A. (2010). Epileptic seizure detection using multi-wavelet transform based approximate entropy and artificial neural networks. Journal of Neuroscience Methods, 193(1), 156–163.
[20] Huang, N. E., et al. (1998). The empirical mode decomposition and the Hilbert spectrum for nonlinear and non-stationary time series analysis. In Proceedings of the Royal Society of London A: Mathematical, Physical and Engineering Sciences (Vol. 454, No. 1971, pp. 903–995). The Royal Society.
[21] Pachori, R. B. (2008). Discrimination between ictal and seizure-free EEG signals using empirical mode decomposition. Research Letters in Signal Processing, 2008, 14.
[22] Oweis, R. J., and Abdulhay, E. W. (2011). Seizure classification in EEG signals utilizing Hilbert-Huang transform. Biomedical Engineering Online, 10(1), 38.
[23] Pachori, R. B., and Bajaj, V. (2011). Analysis of normal and epileptic seizure EEG signals using empirical mode decomposition. Computer Methods and Programs in Biomedicine, 104(3), 373–381.
[24] Bajaj, V., and Pachori, R. B. (2012). EEG signal classification using empirical mode decomposition and support vector machine. In Proceedings of the International Conference on Soft Computing for Problem Solving (SocProS), 623–635. Springer, India.
[25] Li, S., Zhou, W., Yuan, Q., Geng, S., and Cai, D. (2013). Feature extraction and recognition of ictal EEG using EMD and SVM. Computers in Biology and Medicine, 43(7), 807–816.
[26] Bajaj, V., and Pachori, R. B. (2013). Epileptic seizure detection based on the instantaneous area of analytic intrinsic mode functions of EEG signals. Biomedical Engineering Letters, 3(1), 17–21.
[27] Bajaj, V., and Pachori, R. B. (2012). Classification of seizure and nonseizure EEG signals using empirical mode decomposition. IEEE Transactions on Information Technology in Biomedicine, 16(6),
[28] ur Rehman, N., Xia, Y., and Mandic, D. P. (2010). Application of multivariate empirical mode decomposition for seizure detection in EEG signals. In Engineering in Medicine and Biology Society (EMBC), 2010 Annual International Conference of the IEEE, 1650–1653. IEEE.
[29] Pachori, R. B., and Patidar, S. (2014). Epileptic seizure classification in EEG signals using second-order difference plot of intrinsic mode functions. Computer Methods and Programs in Biomedicine, 113(2), 494–502.
[30] Richman, J. S., and Moorman, J. R. (2000). Physiological time-series analysis using approximate entropy and sample entropy. American Journal of Physiology-Heart and Circulatory Physiology, 278(6),
[31] Song, Y., and Liò, P. (2010). A new approach for epileptic seizure detection: sample entropy based feature extraction and extreme learning machine. J. Biomed. Sci. Eng., 3(6), 556.
[32] Bajaj, V., and Pachori, R. B. (2011). Application of the Sample Entropy for Discrimination between Seizure and Seizure-Free EEG Signals. In IICAI 1232–1247.
[33] Cortes, C., and Vapnik, V. (1995). Support-vector networks. Machine learning, 20(3), 273–297.
[34] Suykens, J. A., and Vandewalle, J. (1999). Least squares support vector machine classifiers. Neural Processing Letters, 9(3), 293–300.
[35] Khandoker, A. H., Lai, D. T., Begg, R. K., and Palaniswami, M. (2007). Wavelet-based feature extraction for support vector machines for screening balance impairments in the elderly. IEEE Transactions on Neural Systems and Rehabilitation Engineering, 15(4), 587–597.
[36] Zhu, G., Li, Y., Wen, P. P., Wang, S., and Xi, M. (2013). Epileptogenic focus detection in intracranial EEG based on delay permutation entropy. In AIP Conference Proceedings (Vol. 1559, No. 1, pp. 31–36). AIP.
[37] Takens, F. (1981). Detecting strange attractors in turbulence. In Dynamical systems and turbulence, Warwick 1980, 366–381. (Springer: Berlin, Heidelberg).
Biographies

R. Krishnaprasanna received the B.E. degree in Electronics and Communication Engineering from Anna University Chennai, Tamilnadu, India, in 2008, and M.Tech. degree in VLSI design from Sathyabama University Chennai, Tamilnadu, India, in 2013 and currently pursuing Ph.D. in the faculty of Electronics in Sathyabama University Chennai, Tamilnadu, India. He has published 4 papers in Journals and Conferences. His research area is Biomedical signal processing.

V. Vijaya Baskar received the B.E. degree in Electronics and Communication Engineering from Madras University, in 1998. He received the M.E. degree in Applied Electronics from Sathyabama University, Chennai in 2004. He received the Ph.D. in the faculty of Electronics from Sathyabama University, Chennai in 2013. He has published 35 papers in Journals and Conferences. His research area is underwater acoustic signal processing and Electronic nose. He is currently working as professor and Head of Electronics and Telecommunication department.
Journal of ICT, Vol. 5_2, 171–186.
doi: 10.13052/jicts2245-800X.523
This is an Open Access publication. © 2018 the Author(s). All rights reserved.