Towards the Standardization of Stereoscopic Video Quality Assessment: An Application for Objective Algorithms
Received: 11 November 2014; Accepted: 9 March 2015
José Vinícius de Miranda Cardoso, Carlos Danilo Miranda Regis and Marcelo Sampaio de Alencar
- Federal University of Campina Grande (UFCG)
- Federal Institute of Education, Science, and Technology of Paraíba (IFPB)
- Institute for Advanced Studies in Communications (Iecom)
Abstract
This article describes a Qt-based C++ application for full-reference stereoscopic video quality assessment, which is platform independent and provides a friendly graphical user interface. The stereoscopic video signals used in the application are based on a two-view model, such as the H.264/AVC standard in the Multiview Video Coding (MVC) profile. In addition, several spatial resolutions are available. The application provides objective video quality algorithms, such as PSNR, SSIM, and PW-SSIM and also incorporates a recently published technique for stereoscopic video quality assessment called Disparity Weighting (DW), which comprises the following algorithms: DPSNR, DSSIM and DPW-SSIM. Numerical results corresponding to the performance of the objective measurements, acquired using the proposed application, are presented. The application aims to contribute to the standardization and development of objective algorithms for stereoscopic content. As an open-source tool to be used by the academia and the industry, the application is used to evaluate impairments in stereoscopic video signals, caused by processing, compression and transmission techniques.
Keywords
- Stereoscopic Video
- Video Quality Assessment
- Objective Algorithms
1 Introduction
The diversity of the digital multimedia content available in a wide range of services requires the use of different schemes to distribute the signals over a variety of digital transmission technologies. Furthermore, the multimedia streams must be adjusted to fulfill the requirements of applications, such as, IPTV, mobile TV, digital broadcasting, video on demand and video surveillance, which already include stereoscopic video content. It is important to consider the parameters that have a significant impact on the consumer electronics, such as, bandwidth, bit-rate, storage space and power consumption.
The visualization of stereoscopic video content requires more storage space and processing capacity from the devices. Moreover the power consumption is a critical parameter for mobile devices. Equally important are compression, transmission, coding, quantization and techniques to accommodate the multimedia signals, which can cause impairments that degrade the quality of the content. The Video Quality Assessment (VQA) is used to establish the performance of a video processing system and to obtain optimal parameters that maintain the Quality of Service (QoS) in a pre-determined condition [1]. Therefore, it is necessary to evaluate the quality of stereoscopic video signals in a fast, accurate and reliable way.
The approaches to evaluate the video quality can be subjective or objective. The subjective assessment involves psycho-visual experiments with humans, which provide adequate accuracy. The complete methodologies of the subjective experiments are described in Recommendations ITU-T P.910 [2] and ITU-R BT.500-13 [3]. However, this approach is time-consuming and less practical for real-time applications. On the other hand, the objective assessment is a fast and low cost alternative. Objective algorithms use statistical data of the video, combined with specific characteristics of the Human Visual System (HVS), to estimate the quality. It is classified according to the availability of the original signal as following: full reference, in which the original video is compared with the degraded video under test; reduced reference, whenever only characteristics of the original video are available for comparison with the video under test, and no reference, in which only the video under test is used for quality assessment.
Full-reference objective algorithms were developed to evaluate the 2D video quality, and were incorporated in Recommendation ITU-T J.144 [4]. Recent publications indicate that the perceptual characteristics increase the performance of the objective VQA algorithms [5–8]. However, stereoscopic video signals present the depth, which is a new component that can be considered in the design of the objective algorithms. The disparity has been used as a depth estimation in the development of objective algorithms [9, 10]. In addition, the recent development of objective stereoscopic video quality algorithms have encouraged the research in this subject [11–13], as well as the efforts to build standards for evaluation of subjective and objective stereoscopic video quality models [14].
This article presents a platform independent application, called Squales (Stereoscopic Video Quality Evaluation Software), with a graphical user interface for objective stereoscopic VQA. It was implemented using the Qt application framework and C++ programming language and can be used to implement important objective algorithms, such as, PSNR, SSIM, PW-SSIM, DPSNR, DSSIM, and DPW-SSIM. The performance of the objective algorithms was verified using the subjective data provided by the NAMA3DS1-COSPAD1 database [15, 16]. Statistical measures were used to compare the performance of the objective algorithms. Confidence intervals and hypothesis tests, for the Pearson correlation coefficient, are presented.
The article is organized as follows. Section 2 discusses applications. A review of the objective algorithms is presented in Section 3. Section 4 presents the Squales application. Numerical results, that validated the performance of the objective algorithms, are discussed in Section 5. Section 6 presents the conclusions and future work.
2 Related Applications
An application that implements image and video quality algorithms has a significant impact on academia and industry to enhance and to develop new video quality algorithms, as well as, to determine the performance of video processing techniques.
In particular, an image quality toolbox for MATLAB1® was implemented by Sprljan [17]. This toolbox does not present a Graphical User Interface (GUI) and the objective algorithms provided are limited to the error sensitivity approach, such as Mean Square Error (MSE), Peak Signal-to-Noise Ratio (PSNR), Normalized Absolute Error (NAE) and Average Difference (AD), which do not present good fitting with subjective scores.
Similarly, Gaubatz [18] provides a MATLAB package for image quality assessment. This application is command-line based, and its usage is not intuitive. Nevertheless, it provides image quality algorithms such as MSE, PSNR, SSIM, VIF (Visual Index Fidelity) and another algorithms based on the Human Visual System (HVS).
In the same way, a MATLAB-based framework for 2D image and video quality assessment was developed by Murthy and Karam [19]. This framework provides a GUI-based approach and it has various objective image and video quality algorithms, full-reference, reduced-reference and no-reference, and it supports different image and video formats. It also includes an interface for subjective evaluation, generation of simulated impairments, and correlation analysis between subjective and objective measures.
However, MATLAB is a high-cost application and time-consuming, for most devices, mainly to execute operations with large video files. MATLAB requires a robust hardware specification, which makes the analysis of stereoscopic video signals, in mobile devices scenario and real-time applications, almost impracticable.
Recently, Ucar et al. [20] proposed the Video Tester – a framework for video quality assessment over IP networks. It was implemented using Python programming language and it performs parameter extraction in packet, bit-stream, and picture level of the video processing and transmission in order to gather information for quality evaluation. The Video Tester is a Linux application and it depends of Open Source Computer Vision Library (OpenCV), GStreamer, Matplotlib, and another libraries, that are not optimized for multi-platform compatibility.
3 Objective Evaluation Algorithms – A Review
3.1 Notation
Let V= {vL (x, y, n), vR (x, y, n)} be a stereoscopic video signal, in which the scalar functions vL and vR correspond to left and right views respectively; such that in which X, Y, and N represent the number of lines, columns, and frames respectively. This model was chosen because it is similar to that used in the standard ISO/IEC 14496-10 – MPEG-4 Part 10 (H.264/AVC) in Stereo and Multiview High Profiles.
Let F and H be a stereoscopic reference video signal and a stereoscopic video signal under test respectively. A full reference objective algorithm for stereoscopic video quality assessment is a function G, such that its outcome (G(F, H)) represents the quality of H with respect to F.
Further, the following definition is used in this paper
since the importance of left and right views for quality assessment is the same.
3.2 Peak Signal-to-Noise Ratio
Let f(x, y, n) and h(x, y, n) be scalar functions that represent 2D video signals. The Mean Square Error (MSE) between them is computed as
The Peak Signal-to-Noise Ratio (PSNR) is computed as
in which MAX = 2b — 1, b is the number of bits used in the quantization of the gray value scale, and MSE(f, h) is the Mean Square Error between f and h. In this paper b = 8 was used.
3.3 Structural Similarity Index
The Structural SIMilarity (SSIM) [21] is a full-reference approach to image and video quality assessment based on the assumption that the HVS is highly adapted to recognize structural information in visual environments. Therefore, changes in structural information provide a good approximation to the quality perceived by the human visual system.
The SSIM(f, h) is computed as a product of three measures over the luminance plane: luminance comparison l(f, h), contrast comparison c(f, h) and structural comparison s(f, h):
in which μ is the sample mean, σ is the sample standard deviation, σfh is the covariance, C1 = (0.01 · 255)2, C2 = (0.03 · 255)2 and .
The structural similarity index is described as
in which usually α = β = γ = 1.
In practice the SSIM is computed for an 8 × 8 sliding squared window or for an 11 ×11 Gaussian-circular window. The first approach was used in the experiments. For two videos, which are subdivided into J windows, the SSIM is computed as
in which fj is the video signal observed in the j-th window.
3.4 Perceptual Weighted Structural Similarity Index
Regis et al. [22] proposed a technique called Perceptual Weighting (PW), which combines the local Spatial Perceptual Information (SI), as a visual attention estimator, with the SSIM, since experiments indicate that the quality perceived by the HVS is more sensitive for areas of intense visual attention [8].
The PW technique uses the local spatial perceptual information to weigh the most visually important regions. This weighting is obtained as follows: compute the magnitude of the gradient vectors in the original video using Sobel operator, then generate a perceptual map, in which the pixel values are the magnitude of the gradient vectors. The frame is partitioned into window 8 × 8 pixels, and the SI for each block is computed as
in which μj represents the sample average of the perceptual map in the j-th window, K is the number of gradient vectors in the j-th window and is the magnitude of the k-th gradient vector in the j-th window. For the case the frames are partitioned uniformly in squares 8 × 8, K = 64.
Finally, the Perceptual Weighted Structural Similarity Index (PW–SSIM) is computed as
3.5 Disparity Weighting Technique
The disparity presented in a stereoscopic video signal is an information related to the sense of the stereo perception [9]. This information is computed as the difference between two corresponding pixels on the left and on the right views. Indeed, the disparity should be considered in the development of objective algorithms to improve the correlation between objective prediction and subjective scores.
The disparity map, D(F), is computed as
Regis et al. [10] included the disparity information into objective algorithms by means of a weighted average of objective measurements with the values contained on disparity map. This approach was implemented into three objective algorithms, PSNR, SSIM, and PW-SSIM, developing DPSNR, DSSIM and DPW–SSIM.
The DMSEL, i.e., DMSE for left view, is computed as
and the DPSNRL is computed as
The DMSE and the DPSNR for right view (DMSER and DPSNRR are computed in the same manner. Then the overall DPSNR is the average between DPSNRL and DPSNRR.
The DSSIM is computed as
in which D(Fj) is the average disparity in the j-th window.
The DPW–SSIM is computed as
4 Proposed Application
This paper presents a platform independent application with an user-friendly GUI for objective stereoscopic VQA. The application was developed using C++ programming language with Qt2® 4.8.4 (64 bits) under the license LGPL v2.1, using Qt Creator® 2.6.2 as an integrated development environment and GNU C and C++ Compiler (GCC v4.7.2).
Qt is a multi-platform application framework, developed in C++ programming language, which is widely utilized for developing applications with GUI. For instance, Qt is used in applications such as Google Earth and KDE. The C++ programming language was chosen because it is more efficient than other programming languages such as MATLAB. In fact, MATLAB is time-consuming and requires large computational resources, which can be a problem for mobile devices. On the other hand, C++ is appropriate for mobile devices, because it is fast, even for limited computing resources.
The block diagram of the Squales application is depicted in Figure 1. The project architecture of the Squales application is shown in Figure 2, evidencing the facility to insert new objective algorithms into the project, which only requires their implementation in C++ programming language. Figure 3 depicts the GUI of the proposed application running on different platforms.
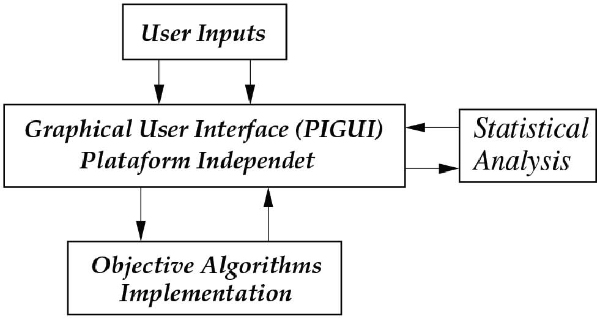
Figure 1 Squales block diagram
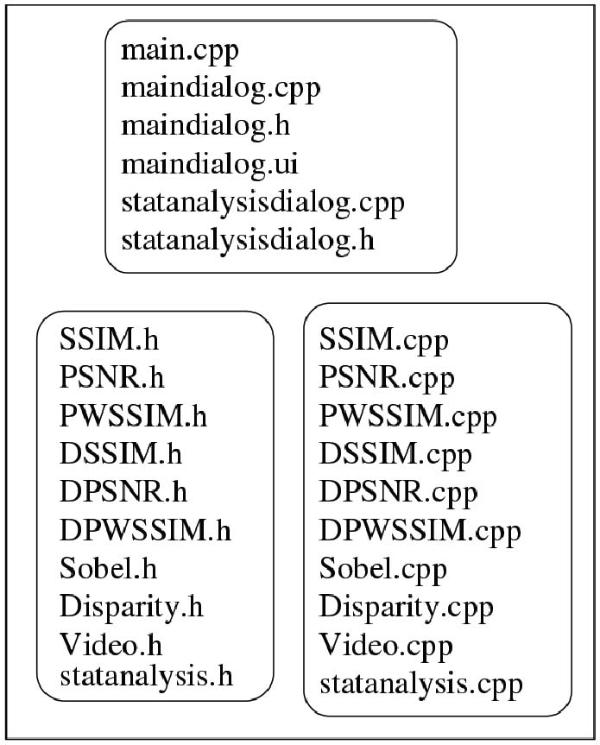
Figure 2 Squales project
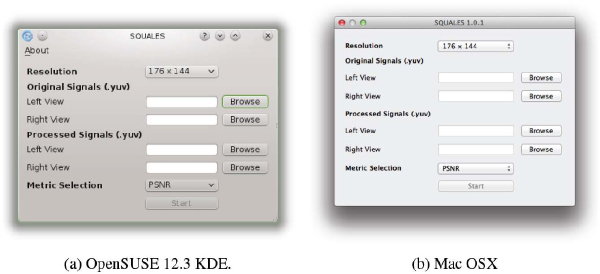
Figure 3 Main window of the Squales application
4.1 User Inputs
The application requires that the user indicates some input parameters, including: spatial resolution, video signals and metric selection.
- Spatial resolution: The resolutions available are: 176 × 144 (QCIF); 352 × 288 (CIF); 640 × 480; 704 × 480; 720 × 480; 768 × 576; 872 × 480; 1024 × 576; 1048 × 576; 1280 × 720 and 1920 × 1080.
- Video signals: The application supports video signals in YCbCr color space format, with 4:4:4, 4:2:2 and 4:2:0 chroma sub-sampling.
- Metric selection: The metrics available are those discussed in the previous section, namely: PSNR, SSIMPW-SSIM, DPSNR, DSSIM, and DPW-SSIM.
4.2 Objective Algorithms Implementation
The implementation of the objective algorithms available in the proposed application was made in C++ programming language, according to the description presented in the previous section. The output of the objective algorithms is a text file. The time consumed, in seconds, by the objective algorithm is also presented.
4.3 Statistical Analysis Tool
In order to evaluate the performance of an objective algorithm, Squales provides a basic statistical analysis tool that computes the Pearson correlation coefficient between the sets of objective results and subjective scores, and it also provides the fitted coefficients used to estimate a polynomial relation between those sets. In this sense, Squales requires that the user enter the sets of values in format of text files (.txt). It is important to highlight that the data in both files must be aligned. For instance, if an objective result correspondent to video# is in the first line of the text file of objective scores, then the subjective score correspondent to video#1 must be in the first line of the text file of subjective scores.
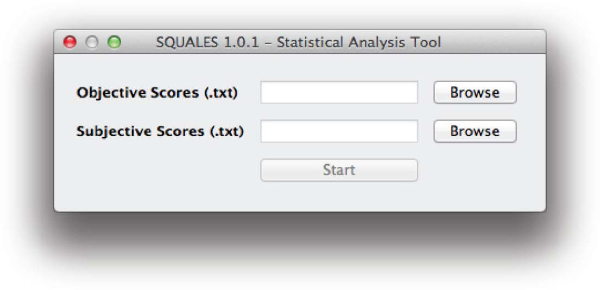
Figure 4 Squales statistical analysis tool
This statistical analysis tool was developed using Armadillo C++ Linear Algebra Library [23].
5 Numerical Results
The Squales application was validated using the stereoscopic video signals available from NAMA3DS1-COSPAD1 database. The NAMA3DS1-COSPAD1 stereoscopic video quality database [15, 16] provides subjective results, using the Absolute Category Rating with Hidden Reference (ACR-HR) method [2], considering scenarios restricted for coding and for spatial degradations including: H.264/AVC and JPEG2000 coding. Table 1 summarizes the coding conditions used in the subjective experiments performed by NAMA3DS1-COSPAD1 project.
Table 1 Coding conditions used in NAMA3DS1-COSPAD1
| Type | Parameter |
|---|---|
| Video Coding (H.264/AVC) | QP = 32 |
| QP = 38 | |
| QP = 44 | |
| Still Image Coding (JPEG2000) | Bit Rate = 2 Mbits/s |
| Bit Rate = 8 Mbits/s | |
| Bit Rate = 16 Mbits/s | |
| Bit Rate = 32 Mbits/s |
5.1 Statistical Measures
The statistical measures used to compare the performance of th e objective algorithms were: the Pearson Linear Correlation Coefficient (PLCC), the Spearman Rank-Order Correlation Coefficient (SROCC), the Kendall RankOrder Correlation Coefficient (KROCC) and the Root Mean Square Error (RMSE). In practice, PLCC evaluates the accuracy, SROCC and KROCC evaluate the monotonicity and the RMSE estimate the consistency of an objective model prediction with respect to human subjective scores available from NAMA3DS1-COSPAD1.
The statistical measures were computed after performing a non-linear regression on the objective video quality assessment algorithmic measures, using a four parameter monotonic cubic polynomial function to fit the objective prediction to the subjective quality scores. The function is as follows [4]
in which Ql represents the quality that an objective algorithm predicts for the l-th video in the NAMA3DS1-COSPAD1 Video Quality Database and is the fitted objective score. The β coefficients are determined using a simple non-linear least squares optimization.
The results of the statistical measures, to compare the performance of the objective algorithms, are presented in Table 2. The two best results are shown in boldface. It is noted that the inclusion of the disparity weighting technique enhance the performance of the objective algorithms. The DPW–SSIM achieved the best performance for all scenarios, indicating that the perceptual weighting combined with the disparity weighting presented a significant role for the prediction of quality assigned by the HVS.
Table 2 Performance measures of the objective algorithms
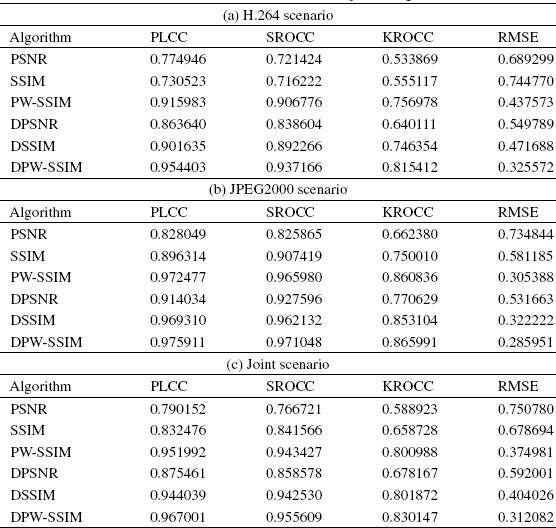
Figure 5 presents the trend between the set of subjective scores and the set of objective results. The scatter plots indicates a lower dispersion around of the prediction curve for the algorithms that use the disparity weighting.
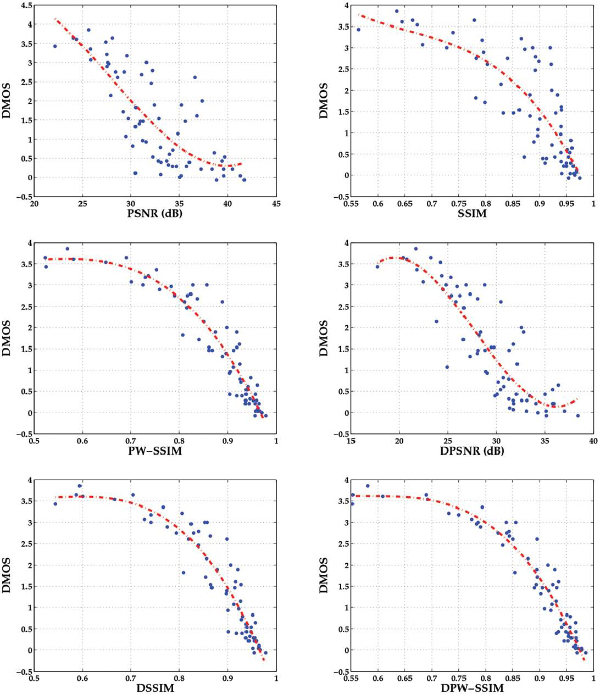
Figure 5 Scatter plots of subjective scores (DMOS) versus model prediction. Each sample point represents a 3D test video sample
5.2 Hypothesis Tests for ρ
A statistical analysis was performed under the following hypothesis
in order to verify whether the Pearson correlation coefficients have increased significantly.
Firstly, the Fisher’s Transformation was applied
in which r is the sample correlation coefficient (PLCC). Z follows approximately the Normal distribution N(μZ, σZ) with
Then, the Critical Region (CR) for Z, in the significance level of 95%, is
For each Pearson correlation coefficient presented (r) in Tables 2a, 2b and 2c, CR, and Z0 were computed according to the Formulas (20) and (18). If Z0 ∉ CR, the hypothesis is accepted, i.e., there is not evidence that the Pearson correlation coefficient has increased, otherwise the hypothesis is accepted meaning that the Pearson correlation coefficient has increased with a confidence level of 95%.
Table 3 Hypothesis test for the correlation coefficient (H.264 – JPEG2000 – Joint Scenario)
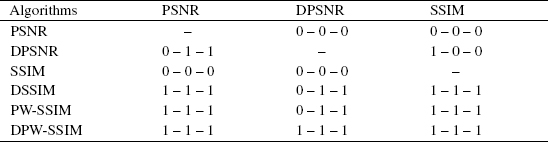
For instance, for ρ0 = 0.730523 (PLCC for SSIM in H.264 scenario), then ZCR is computed according to the Formula (20). The next step is to transform the another Pearson correlation coefficients in Zi (the index i meaning the i-th algorithm) according the Formula (18). If Zi > ZCR then the i-th algorithm presents a PLCC more significant than ρ0 with a confidence level of 95%.
In Table 4 the values ‘0’ and ‘1’ mean that one of the hypothesis or was accepted. In practice, a symbol value of ‘1’ indicates the statistical performance of the objective algorithm in the row is superior to that of the objective algorithm in the column. On the other hand, a symbol value of ‘0’ suggests the statistical performance of the objective algorithm in the row is equivalent to that of the objective in the column. The sequence of the values in a cell corresponds to the hypothesis test for H.264, JPEG2000, and Joint scenarios respectively.
5.3 Confidence Interval for ρ
Figure 6 presents a 95% confidence interval for ρ in the H.264 and in the JPEG2000 scenarios under the hypothesis :ρ = 0, : ρ ≠ 0. The Z Fisher’s transformation was applied to r to compute the confidence interval.
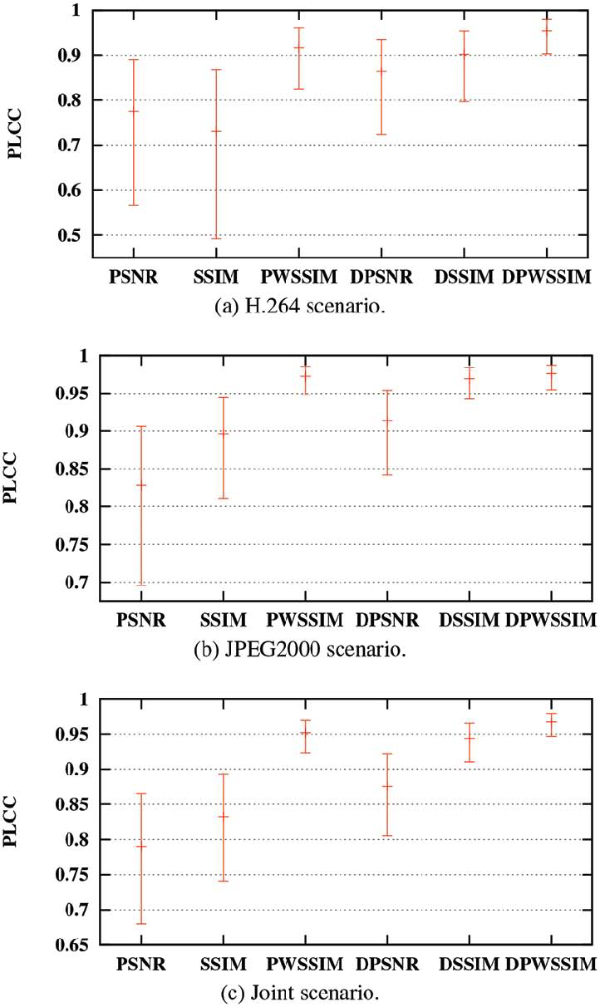
Figure 6 The 95% confidence intervals for the PLCC
Under that hypothesis, Z follows the Normal distribution with zero mean and with variance given by Formula (19). The confidence interval for this random variable is defined as
For α = 0.05, i.e., an interval with 95% of confidence, z0.95 =1.96. and the Formula (21) may be rewritten as
The inverse of the Z Fisher’s transformation is
and the confidence interval in terms of r is defined as
Figure 6 suggests that, besides an increase in the correlation coefficient, there is a reduction in the length of the PLCC confidence interval for the algorithms that use the disparity weighting technique.
6 Conclusions
An application that computes the stereoscopic video quality is important for the development and standardization of new objective stereoscopic video quality prediction models, and it also has a significant impact on academia and industry, because it can improve stereoscopic video processing techniques and stereoscopic video services. A platform independent application with GUI for objective stereoscopic video quality assessment was presented.
The main contributions of the application are: it is platform independent, it quickly computes the stereoscopic video quality, because the C++ programming language was used in the implementation, it presents a user-friendly GUI, and it presents a statistical analysis tool to compute the performance of objective algorithms. Squales is able to evaluate stereoscopic video signals in two-view model for several spatial resolutions with reliable objective algorithms specifically developed for stereoscopic video quality assessment.
The performance of the objective algorithms available in Squales was verified, using correlation coefficients, confidence interval for the PLCC and hypothesis test. These figures of merit validate the performance of the objective algorithms, evidencing the outstanding performance of the objective algorithms that include the disparity weighting technique, suggesting that Squales is an useful tool for be used by academia, industry, and standards organizations.
References
[1] K. Seshadrinathan, R. Soundararajan, A. C. Bovik, and L. K. Cormack. Study of Subjective and Objective Quality Assessment of Video. IEEE Transactions on Image Processing, pages 1427–1441, 2010.
[2] International Telecommunication Union. Recommendation ITU-T P.910: Subjective Video Quality Assessment Methods for Multimedia Applications. Technical report, ITU-T, 2008.
[3] International Telecommunication Union. Recommendation ITU-R BT.500-13: Methodology for the Subjective Assessment of the Quality of Television Pictures. Technical report, ITU-R, 2012.
[4] International Telecommunication Union. Recommendation ITU-T J.144: Objective Perceptual Video Quality Measurement Techniques for Digital Cable Television in the Presence of a Full Reference. Technical report, ITU-T, 2004.
[5] Z. Wang and Q. Li. Information Content Weighting for Perceptual Image Quality Assessment. IEEE Transactions on Image Processing, 20(5):1185–1198, 2011.
[6] C. D. M. Regis, J. V. M. Cardoso, and M. S. Alencar. Effect of Visual Attention Areas on the Objective Video Quality Assessment. In Proceedings of the 18th Brazilian Symposium on Multimedia and the Web, WebMedia '12, 2012.
[7] C. D. M. Regis, J. V. M. Cardoso, I. P. Oliveira, and M. S. Alencar. Performance of the Objective Video Quality Metrics with Perceptual Weighting Considering First and Second Order Differential Operators. In Proceedings of the 18th Brazilian Symposium on Multimedia and the Web, WebMedia '12, 2012.
[8] H. Liu and I. Heynderickx. Studying the Added Value of Visual Attention in Objective Image Quality Metrics Based on Eye Movement Data. In 16th IEEE International Conference on Image Processing, 2009.
[9] A. Benoit, P. Le Callet, P. Campisi, and R. Cousseau. Quality Assessment of Stereoscopic Images. EURASIP Journal on Image and Video Processing, 2008(1):659024.
[10] C. D. M. Regis, J. V. M. Cardoso, I. P. Oliveira, and M. S. Alencar. Objective Estimation of 3D Video Quality: A Disparity-based Weighting Strategy. In Proceedings of IEEE International Symposium on Broadband Multimedia Systems and Broadcasting (BMSB’13), 2013.
[11] J. Han, T. Jiang, and S. Ma. Stereoscopic Video Quality Assessment Model Based on Spatial-temporal Structural Information. In IEEE Visual Communications and Image Processing (VCIP), 2012.
[12] D. Kim, D. Min, J. Oh, S. Jeon, and K. Sohn. Depth Map Quality Metric for Three-dimensional Video. In Proceedings of XX SPIE Stereoscopic Displays and Applications, volume 7237, 2009.
[13] L. Jin, A. Boev, A. Gotchev, and K. Egiazarian. 3D-DCT Based Perceptual Quality Assessment of Stereo Video. In 18th IEEE International Conference on Image Processing (ICIP), 2011.
[14] Video Quality Experts Group. Evaluation of Video Quality Models for use with Stereoscopic Three-Dimensional Television Content. Technical report, VQEG, 2012.
[15] IRCCyN-IVC. Nantes-Madrid 3D Stereoscopic Database. http://www. irccyn.ec-nantes.fr/spip.php?article1052,2012.
[16] M. Urvoy, M. Barkowsky, R. Cousseau, Y. Koudota, V. Ricorde, P. Le Callet, J. Gutierrez, and N. Garcia. NAMA3DS1-COSPAD1: Subjective Video Quality Assessment Database on Coding Conditions Introducing Freely Available High Quality 3D Stereoscopic Sequences. In Quality of Multimedia Experience (QoMEX), 2012 Fourth International Workshop on, 2012.
[17] N. Sprljan. MATLAB XYZ Toolbox, 2012. http://www.sprljan.com/ nikola/matlab.
[18] M. Gaubatz. MeTriX MuX Visual Quality Assessment Package, 2007. http://foulard.ece.cornell.edu/gaubatz/metrix_mux/.
[19] A. V. Murthy and L. J. Karam. A MATLAB-based Framework for Image and Video Quality Evaluation. In Second International Workshop on Quality of Multimedia Experience (QoMEX), 2010.
[20] I. Ucar, J. Navarro-Ortiz, P. Ameigeiras, and J. M. Lopez-Soler. Video Tester – A Multiple-metric Framework for Video Quality Assessment Over IP Networks. In IEEE International Symposium on Broadband Multimedia Systems and Broadcasting (BMSB), 2012.
[21] Z. Wang, A. C. Bovik, H. R. Sheikh, and E. P. Simoncelli. Image Quality assessment: From Error Visibility to Structural Similarity. IEEE Transactions on Image Processing, 13(4):600–612, April 2004.
[22] C. D. M. Regis, J. V. M. Cardoso, and M. S. Alencar. Video Quality Assessment Based on the Effect of the Estimation of the Spatial Perceptual Information. In Proceedings of 30th Brazilian Symposium of Telecommunications (SBrT’12), 2012.
[23] C. Sanderson. Armadillo: C++ linear algebra library, 2014. http://arma. sourceforge.net.
Biographies

J. Vinícius de Miranda Cardoso was born in Campina Grande, Brazil in 1992. He is a senior-year student of Electrical Engineering at the Federal University of Campina Grande (UFCG), Brazil. Currently, he was awarded with a scholarship sponsored by the Brazilian Government to pursue his studies in the US. Since his first year in college, he has been engaged with research projects related to image and video processing. Such works were published in reputed conferences such as IEEE BMSB'13, IEEE BMSB'14, IEEE SSIAI'14, and ITU Kaleidoscope 2014. The paper published in the ITU Kaleidoscope 2014 was nominated for the Best Paper Awarded (one of the best six papers) and, in that occasion, he was awarded with an Young Author Recognition by ITU. He is a student member of the IEEE, Brazilian Telecommunications Society (SBrT), and Institute for Advanced Studies in Communications (Iecom).

C. Danilo Miranda Regis was born in Guarabira, Brazil. He received his Bachelor Degree in Electrical Engineering, in 2007, his Masters Degree, in 2009, and his Doctor Degree, in 2013, both in Electrical Engineering, from the Federal University of Campina Grande (UFCG), Brazil. He is with the Iecom Executive Staff of the Journal of Communication and Information Systems (JCIS), since 2006. Since 2009, he is a professor at the Federal Institute of Education, Science and Technology of Paraba (IFPB), Brazil. His current interests include video quality metrics, video processing, multimedia, Digital TV, mobile TV, video transmission and biomedical engineering.

M. Sampaio de Alencar was born in Serrita, Brazil in 1957. He received his Bachelor Degree in Electrical Engineering, from Universidade Federal de Pernambuco (UFPE), Brazil, 1980, his Master Degree in Electrical Engineering, from Universidade Federal da Paraiba (UFPB), Brazil, 1988 and his Ph.D. from University of Waterloo, Department of Electrical and Computer Engineering, Canada, 1994. He is Chair Professor at the Department of Electrical Engineering, Federal University of Campina Grande, Brazil, founder and President of the Institute for Advanced Studies in Communications (Iecom). He published over 350 engineering and scientific papers and 16 books. He is Emeritus Member of the SBrT. He is a Registered Professional Engineer and a columnist for the traditional Brazilian newspaper Jornal do Commercio. He is Vice-President External Relations of SBrT.
1MATLAB is a registered trademark under Copyright license with all rights reserved to MathWorks, Inc.
2Qt and Qt Creator are registered trademarks under Copyright license with all rights reserved to Digia Plc.
Journal of ICT, Vol. 2, 247–268.
doi: 10.13052/jicts2245-800X.233
© 2015 River Publishers. All rights reserved.