An Open Source Real-Time Data Portal
Received: 14 December 2014; Accepted: 9 March 2015
Sudesh Lutchman and Patrick Hosein
- Department of Computer Science, The University of the West Indies, Trinidad E-mail: sudesh.lutchman@gmail.com, patrick.hosein@sta.uwi.edu
Abstract
In the coming years there will be a rapid growth in the generation and processing of data from multiple sources. These sources, sometimes referred to as the Internet of Things (IoT), will consist of devices such as sensors, monitors and smartphones. This trend has been made possible because of (a) the adoption of IPv6 (allowing for such devices to be addressable), (b) enhancements in cellular technologies (in particular 5G) to better support short infrequent bursts of data transmissions and (c) the introduction of smartphones with a wide range of sensors and (d) the availability of easily deployed, low cost, low energy sensors (helped by the introduction of Raspberry Pi and Arduino processors). The real-time data generated by these devices can serve be used in several ways including being mined for important information and correlations, as well as use in web and mobile applications. This data, however, is often either proprietary or in a format that is not easily usable by real time applications. Furthermore, if an application developer needs to integrate (mash-up) data from multiple sources it is quite burdensome to develop interfaces. The present platforms for open data repositories are designed for static non real-time data. We propose a design and provide specifications for a platform that will accept real-time open data from multiple sources in multiple formats and make the data accessible in a standard format at user specified frequencies. The data is held for a finite period of time and digests made so that developers can also make use of historical data.
Keywords
- Open data
- Real-time systems
- Sensor networks
- Data repository
- Internet of Things
- IoT
- 5G
1 Introduction
Open data, as defined by the Open Knowledge Foundation, is data or content that is free to use, reuse, and redistribute subject only at most, to the requirement to attribute and/or share-alike [4]. The World Bank further defines openness as a combination of being both technically and legally open [2]. Many Governments worldwide are currently going through an open data revolution. The focus is currently on increasing transparency [10] such as in the case of the United States of America with its Open Government Directive [5] and the European Union’s Public Sector Information (PSI) directive [3]. As a result, many data portals and open data platforms have sprung up to accommodate the needs of these initiatives [7]. Examples include data.gov, data.gov.uk and data.tt. The World Bank has also been actively working with various countries and informing the Governments of the advantages of making their data open and available to the public.
These data platforms, such as CKAN (Comprehensive Knowledge Archive Network) and Junar, work well for processed, aggregated and summarized data but fall short of providing any efficient means of supporting raw real-time data. Furthermore, many institutions that deal with real-time data do so using proprietary methods. For example, CitySDK [1] is an open data portal that caters for a city’s data but has a separate module specifically designed for dealing with real- time transport data. This makes it extremely difficult, and most times impossible, to use multiple real-time data sources in a collaborative effort. The lack of a proper system designed for real-time data also discourages many people from publishing much needed real-time data even if they are willing to provide it to the public. Platforms have been created to use real-time data such as the systems designed in [11] and [9]. These platforms manipulate the data to create Linked Data. Linked Data, however, simply is not able to guarantee the open data principle of reuse [12]. For geo-spatial data, the platform of choice is GeoNode but this does not support real-time sources.
The ability for almost anyone to develop web and mobile applications with minimal training has resulted in an explosion of these applications, especially for the Android and IOS smartphone markets. Some of these applications depend on real-time information and so developers need to work closely with the providers of the required data in order to ensure compatibility and also to come to an agreement on usage policies. If an application requires data from several data sources then the time, complexity and cost of development can grow rapidly. We propose a platform that would significantly reduce this burden by allowing the application developer to focus on the application and simply assume that the required data can be obtained in a standard format at whichever frequency is desired. Note that we assume that both content providers and content consumers will work according to some agreed upon set of policies and licenses.
In the next section we provide an overview of the currently available platforms that were developed for open data. We then compare them with our proposed platform which we call the Real-Time Open Data repository (RTOD) platform. Next we present the requirements for a real-time repository and indicate how these are incorporated in our proposal. In particular, we discuss how received data is processed. If the data is requested faster than it is collected then extrapolation techniques are used to provide data when it is needed even if a new value has not been received. Similarly if data is requested at a slower rate than what is collected then filtering (e.g. simply skipping some samples) can be used. Finally we provide some more implementation details of how application developers can access data via standard APIs (Application Programming Interface) and describe some Use Cases.
2 Overview of Current Platforms
In this section we provide a brief overview of the leading open data platforms, CKAN, Junar, GeoNode and the SensorMasher system designed in [9]. We follow the approach used in [7] to compare these platforms and consider the properties that they considered. We focus on the ease of uploading, downloading, accessing and using data. Although the GeoNode platform is Open Source and heavily utilized for the storage of geo-spatial data (e.g., GIS data) it does not satisfy all requirements of an Open Data platform and so is not included in our comparison table provided in Table 1.
Table 1 Platform comparison
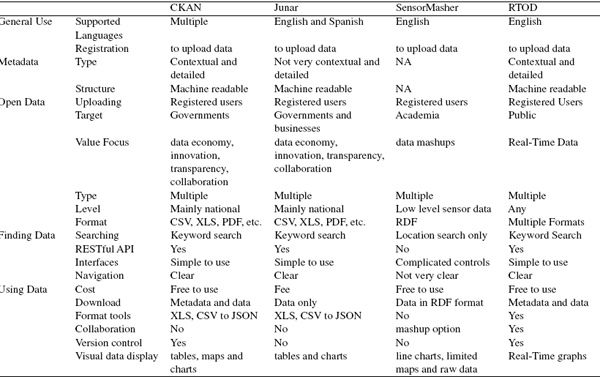
2.1 CKAN
As described on their website ckan.org, “CKAN is a powerful data management system that makes data accessible by providing tools to streamline publishing, sharing, finding and using data. CKAN is aimed at data publishers (national and regional governments, companies and organizations) wanting to make their data open and available.” CKAN is an open source open data platform streamlined for data publishers whether private or Government. CKAN allows registered users to upload data in many different formats including CSV, XLS and JSON. Each resource belongs to a parent dataset which contains metadata for the data. CKAN allows for entire datasets or single resources to be downloaded via the client web interface or through a semi-RESTful API. Data for select formats such as CSV and XLS can be retrieved as JSON, displayed as charts or even shown as tabular data. CKAN also has a geospatial component which allows for visualizing geospatial data on a map. CKAN has turned out to be the most popular Open Data platform and is used by many Governments worldwide (e.g., data.gov in the United States of America and data.gov.uk in the United Kingdom).
2.2 Junar
According to their web site www.junar.com “Junar provides everything you need to open data with confidence. Its built for massive scale and supports local and global data-driven organizations. With Junar, you can easily choose what data to collect, how you want to present it, and when it should be made publicly available. You can also determine which datasets are made available to the public and which datasets are available only for your internal use. Think of it as a next generation data management system for sharing information.”
Junar is a specialized data platform geared towards governments and organizations at a commercial price which varies based on the size of establishment. Junar provides similar services as does CKAN such as the uploading of data in many different formats. Junar’s service, being more tailored towards business needs, allows a user to enhance uploaded data by making custom charts. It also incorporates different analytic features for business and government use. Data in Junar can be downloaded via the web interface or programmatically retrieved through HTTP requests.
2.3 SensorMasher
According to the web site sensormasher.sourceforge.net, “SensorMasher is a platform which makes sensor data available following the linked open data principle and enables the seamless integration of such data into mashups.” According to Wikipedia, “In computing, linked data (often capitalized as Linked Data) describes a method of publishing structured data so that it can be interlinked and become more useful. It builds upon standard Web technologies such as HTTP, RDF and URIs, but rather than using them to serve web pages for human readers, it extends them to share information in a way that can be read automatically by computers. This enables data from different sources to be connected and queried.”
The SensorMasher system is quite different from both CKAN and Junar. SensorMasher gets its data through the Linked Open Data cloud in streams using the RDF format. It also does not provide any API to programmatically download the data. The data has to be manually downloaded through the web interface. SensorMasher allows a user to create interesting mashups between different streams of sensor data but the process is very difficult and not user friendly. The web interface, though unfriendly, does provide some data visualizations through maps and charts. The approach taken in [8] is also based on the RDF format.
2.4 GeoNode
According to their site geonode.org, “GeoNode is a web- based application and platform for developing geospatial information systems (GIS) and for deploying spatial data infrastructures (SDI). It is designed to be extended and modified, and can be integrated into existing platforms.” GeoNode is the most popular Open Source geospatial content management system. GeoNode is used through a web application. Using the web application users can upload different types of geospatial data as layers. This data is made public through the very same web application which allows viewing the data by wrapping the layers over maps. Despite GeoNode’s ability to upload, publish, download and view data, it was excluded from the open data platform comparisons because the system does not allow programmatic publishing or downloading of data. The system does incorporate some internal APIs that deal with customizing the system but there are no public APIs for manipulating data.
The aforementioned platforms, while providing helpful services, are not suitable candidates for a real-time open data repository. CKAN and Junar both target governments and business organizations, as a result they cater directly for summarized data in document form as opposed to real-time data which is granular and updated more frequently. The SensorMasher system uses real-time data but in the form of Linked Data from the Linked Open Data cloud and therefore it is not raw real-time data.
3 Specifications for Proposed Platform
The system architecture consists of three components (see Figure 1), the data providers (which are the sources of data), the Real-Time Open Data Repository (RTOD) (for data collection and dissemination) and the data consumers (these are the developers who develop mobile and web applications for the end user). Hence we need to specify the interfaces between the data sources and RTOD, the data consumers and RTOD and the RTOD platform. In this section we provide an overview of this design. In the next section we provide more details of the software architecture of RTOD.

Figure 1 Platform architecture
3.1 Data Providers
Each data provider may provide multiple streams of data. The provider must first register on the RTOD platform and also register each stream that will be made available. Details such as format of the data, frequency of generation, metadata for the streamed data and other pertinent data must be submitted as well as acceptance of the data policies of the RTOD. For each stream an appropriate license must be chosen by the provider under which the data is made available (e.g, the Creative Commons License which is specified at cre-ativecommons.org). The RTOD platform supports various APIs for receiving data including the RESTful API. The data provider will also need to specify which protocol will be used. In summary the data provider must:
- Accept and follow the policies and guidelines specified on the RTOD platform.
- Register for an account on the RTOD platform.
- Register each source of data that will be provided with details (metadata, frequency, protocol for uploading, data format and precision).
- Begin uploading of periodic data to RTOD.
3.2 The RTOD Server
The RTOD server is used to collect data, process the data and allow others to retrieve the data. Its requirements, which are based on our earlier discussions, are as follows:
- Provide a registration interface for data providers and allow for the registration and authorization of streams
- Provide a registration interface for data consumers
- Be able to simultaneously receive multiple data streams from multiple data sources in real time
- Be able to store and manage data and metadata for each received stream
- Be able to process (i.e., filter, extrapolate, convert, digest etc.) data from each stream
- Be able to serve data streams to data consumers at the requested frequency (within limits)
- Be able to display the stored data in various formats (tabular, graphical etc.) and allow users to manually download data
- Provide search capabilities
- Manage data and periodically flush dated data
- Allow registered users to maintain their accounts (e.g., data providers can add/drop/modify data streams, data consumers can add/drop/modify requests for data and regular users can modify details of their accounts)
3.3 Data Consumers
The data consumers are the application developers who use the provided data in their mobile and web applications. Although they are called data consumers, the real consumers are the users of the applications which are the end users. Application developers will be able to access the data via the standard RESTful API. This allows the developer to choose the rate at which data is retrieved based on the requirements of their application. The developer will be provided limits on the rate at which the specific dataset can be retrieved as well as the number of simultaneous streams that can be accessed so as to maintain acceptable performance levels for all developers. Data consumers must agree with the data policies specified on the RTOD platform. Note that these data consumers will develop user friendly applications for use by the general public who need not understand technical details such as APIs.
4 Implementation Details
The server was developed with the Python language using the object oriented programming paradigm along with various design patterns. The server uses the Waitress Web server because it has excellent performance and is also platform independent. All user tasks fall under a specific category e.g. an account task or dataset task. Each category is represented as a Service Class. A service is attached to a URL which gives users access to them. Each service class defines a function for every HTTP method that it supports, thereby allowing many actions to be represented by one URL. These service classes and associated URLs makeup the request handler (RH) component of the server.
Requests, that require querying the database, are passed over to the database handler (DH) from the RH. Every table in the database maps to a Model Class in the database handler. The DH then uses instantiations of these classes to communicate with the database via database sessions. In order to allow multiple concurrent users to perform database dependent tasks simultaneously a registry design pattern is used to allocate a database session to each client.
The server contains a views module that allows users to GET the client application. The client application is built on the MV* architecture using both HTML and JavaScript. The application itself is a single page application that uses its own Router class to determine which view to present. Views are populated using a combination of static data and dynamic data contained by the clients models. The clients models are similar to their server side brothers and are populated with data from AJAX calls to the RH, which are forwarded to the DH whose response is further forwarded to the client via the RH.
The client applications feed view provides real-time updates of the data stream that is currently being viewed, which are displayed on line graphs. In order to avoid costly polling of the server both the client and server implement sockets. When a client goes to a feed view it sends a GET request to the socket service running on the server. When the socket service receives a socket connection request to the feed socket service the connection is established and added to the namespace. Once the client has established a connection it requests access to a given feed and the server then adds it to a list of sockets for that feed. The client application listens on the socket through non-blocking code for updates from the server. Each feed being viewed has its own socket connection. When the RH receives a POST request to a feed and the DH successfully inserts the data the RH passes the data to the socket service which then emits the data to all sockets associated with the given feed.
When a client navigates away from a feed the socket is disconnected and the socket service removes the socket from its lists. The socket service is micro-threaded allowing multiple sockets to be managed concurrently. See Figure 2 for a depiction of the software architecture.
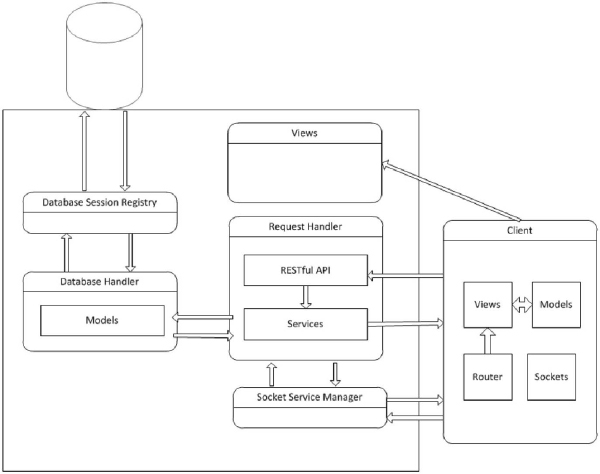
Figure 2 Software architecture
5 Sample Use Case
In this section we present a simple use case to illustrate usage of the RTOD platform. This simple example is just for illustrative purposes. The data source machine feeds its CPU utilization information to the RTOD server. This information is then retrieved by a third computer which then displays the data in graphical form. This example, although simple, illustrates the three components of the system. One can see that additional sources can be added and multiple applications using multiple streams can be used by simply following the process illustrated in this example.
Figure 3 provides a simple application for displaying the retrieved data (i.e. the CPU utilization of the data source) on the client (the data consumer). Note that the feed also provides metadata for the source such as the last updated time, data format and freshness of the data. In this particular case the client requested, in addition to the original feed, an exponentially smoothed version with a filter constant of α = 0.9. The smoothed samples sn are computed from the raw samples rn as follows:
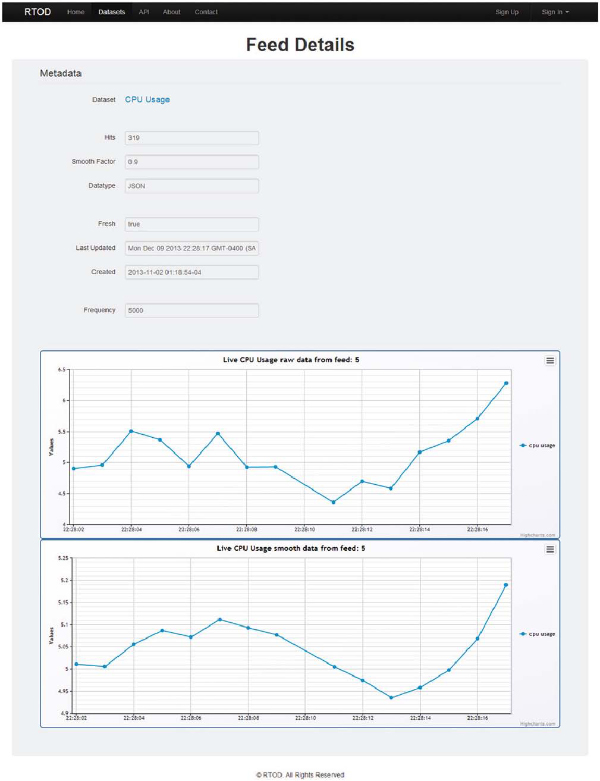
Figure 3 Sample use case
Both versions of the feed are displayed graphically and is updated in real time. The top graph contains the raw data while the bottom one contains the filtered version.
6 Conclusion
In this paper we provided requirements and specifications for an open realtime data repository. We use JSON as the data format as opposed to RDF since it allows for faster transfer and parsing of data. The temporal database is designed to handle a heavy load of incoming real-time data while providing multiple raw and/or processed streams to multiple data consumers (mobile and web applications). The design provides functionality that combines the requirements for open data, real-time data and an open data platform.
References
[1] About citysdk linked open data distribution api. available: http://citysdk .waag.org/about.CitySDK.
[2] The world bank. open data essentials, available: http://data.worldbank .org/about/open-government-data-toolkit/knowledge-repository. The World Bank.
[3] Directive 2003/98/ec of the european parliament and of the council of 17 November 2003 on the re-use of public sector information. available: http://ec.europa.eu/informationsociety/policy/psi/rules/eu/indexen.htm. European Commission, 2003.
[4] Definition of open data and content. available: http://opendefinition.org/. Open Knowledge Foundation Network, 2004.
[5] Memorandum for the heads of executive departments and agencies: Open government directive. The U.S. White House House, 2009.
[6] M. Janssen A. Zuiderwijk and K. Jeffery. Towards an e-infrastructure to support the provision and use of open data. In Proc. Conference for e-Democracy and Open Government, Krems an der Donau, Austria, 2013.
[7] M. Janssen A. Zuiderwijk and A. Parnia. The complementarity of open data infrastructures: An analysis of functionalities. In Proc. 14th Annual International Conference on Digital Government Research, 2013.
[8] F. Corno and F. Razzak. Publishing lo(d)d: Linked open (dynamic) data for smart sensing and measuring environments. In Proc. 3rd International Conference on Ambient Systems, Networks and Technologies (ANT) / 9th International Conference on Mobile Web Information Systems (MobiWIS), Canada, 2012.
[9] D. Le-Phuoc and M. Hauswirth. Linked open data in sensor data mashups. Digital Enterprise Research Institute, National University of Ireland, Galway, Ireland, 2009.
[10] K. OHara. Transparency, open data and trust in government: Shaping the infosphere. In Proc. 3rd Annual ACM Web Science Conf., 2012.
[11] H. Patni. and C. Henson. Linked sensor data. In Proc. Collaborative Technologies and Systems (CTS) Symposium, 2010.
[12] D. De Roure P. Missier J. Ainsworth J. Bhagat P. Couch D. Cruickshank M. Delderfield I. Dunlop M. Gamble D. Michaelides S. Owen D. Newman S. Sufi S. Bechhofer, I. Buchan and C. Goble. Why linked data is not enough for scientists. Future Generation Computer Systems, 29:599–611, 2013.
Biographies

Mr. S. Lutchman Sudesh attended the University of the West Indies where he obtained a BSc. and a MSc. in Computer Science. He was an ACM ICPC regional participant for 2012 and a coach for 2013. He has worked as an instructor at both the University of the West Indies as well as at the University of Trinidad and Tobago and has consulted as a software developer. His interests include open data, data mining, artificial intelligence and mobile application development.

Prof. P. Hosein. Patrick attended the Massachusetts Institute of Technology (MIT) where he obtained five degrees including a PhD in Electrical Engineering and Computer Science. He has worked at Bose Corporation, Bell Laboratories, AT & T Laboratories, Ericsson and Huawei. He has published extensively with over 75 refereed journal and conference publications. He holds 38 granted and 42 pending patents in the areas of telecommunications and wireless technologies. Patrick is presently the administrative and technical contact for the TT top level domain, CEO of TTNIC and a Professor of Computer Science at the University of the West Indies. His present areas of research include radio resource management, QoS and pricing for 5G cellular networks.
Journal of ICT, Vol. 2, 289–302.
doi: 10.13052/jicts2245-800X.235
© 2015 River Publishers. All rights reserved.