Traffic Offload Guideline and Required Year of the 50% Traffic Offloading
Received: November 22, 2013; Accepted: June 1, 2014
Publication: July, 2014
Journal of ICT, Vol. 2_1, 37–64.
doi: 10.13052/jicts2245-800X.212
Copyright © 2014 River Publishers. All rights reserved.
Shozo Komaki, Naoki Ohshima and Hassan Keshavartz
- Malaysia-Japan International Institute of Technology, Universiti Teknologi Malaysia, komaki@ic.utm.my, naoki.osm@ic.utm.my, hassan@mjiit.com
Abstract
Smart Phone and tablet terminals are widely accepted into mobile society and support wireless cloud service effectively. Terminals generally adopt flat rate tariff and the traffic is increasing rapidly. To solve this problem, new technology developments and new spectrum resource allocations and assignments are intensively executed. However in quite near future, traffic will overcome this action.This paper proposes the traffic offloading to microcells and give numerical guideline of offloading ratio that minimize the total radio base station cost under the existing spectrum resource allotment. First, offload guideline is derived based on the Japanese congested area case study in Shibuya ward, and this guideline is translated and generalized to global circumstances. Using the guideline, the required offloading year is calculated for the high population cities or wards in the world. From the results of the analyses, it is shown that the traffic offloading to microcell is necessary in near future. This result is valuable and inevitable to minimize increasing spectrum allotment to the existing mobile service. To monitor the offload ratio, it is better to analyze social bigdata and the carrier’s bigdata. In the final part, example of Draft Question for ITU-R is proposed.
Keywords:
- Traffic offloading to microcell
- Offload guideline
- Radio base station cost minimization
- 3GPP TS LIPA SIPTO
1 Introduction
Wireless broadband access is rapidly penetrating into mobile communication service and terminals, such as smart phone, tablet PC,wireless cloud and so on. Rapid growth of wireless broadband access generates very heavy traffic on the mobile networks. It is well known that the bottleneck for heavy traffic is comes from radio spectrum limitation. To handle heavy traffic, new technology and new radio frequency band allocation have been developed intensively. They were powerful motivation of the global research and development on wireless technologies, including signal processing and control.
However the traffic growth of smart phone has different nature from the existing mobile service, such as voice and mail service. They are similar to fixed broadband service, in that the flat rate tariff is introduced to enhance user utility for various cloud services. For the user utility and mobile carrier benefit, new fruitful applications should be supported by wireless cloud, as same as in fixed networks. Such a increasing wireless broadband traffic will overcome existing technology development and radio spectrum allocation in near future.
Proper solution to solve this bottleneck, it is requested to implement new microcell radio base statin (RBS) to the congested area. This is called as the traffic offloading to microcell. [1–3] 3GPP published TS 23.829, TS 23.859 and TS 22.220, in that H (e)NB, Local IP Access (LIPA) and Selected IP Traffic Offload (SIPTO) are described. H(e)NB includes Home Node B (HNB) and Home e-Node B (HeNB), they are working on 3GPP frequency bands and set in the home or the office building. SIPTO is a method where portions of the IP traffic on a H(e)NB access or cellular network is offloaded to a local network, in order to reduce the traffic load on the existing 3GPP networks, called as core system or macrocell system. In the TS 23.402, the non-3GPP access, such as trusted/non-trusted wireless LAN (WLAN) access, is also defined. In the following part of this document, the SIPTO using H(e)NB and the trusted/non-trusted WLAN access are called as femtocell system and WLAN access system, respectively. Also it is defined that microcell system includes femtocell and WLAN access. Existing large area system operating in 3GPP band is called as macrocell.
Technological issues have already been prepared as is mentioned, however the traffic offloading to femtocell is not widely implemented, by the reasons of the spectrum coordination between macrocell and femtocell, the difficulty of air interface update on femtocell RBS and the difficulty on RBS management and maintenance issue. Considering the existing WLAN, one of promising traffic offloading may be trusted/non-trusted WLAN access. Any way, it is necessary to enhance and promote the offloading to microcell including femtocell and WLAN, by setting up the offload guideline to congested cities. Obtained result suggests that the congested city in the world requires early offloading in the near future.
In this paper, traffic offloading to microcell is analyzed, and the cost minimized offloading guideline is proposed. Analyses are done under the condition of total RBS cost minimization and existing spectrum resource is fixed and limited. The optimum offload guideline is calculated by using real congested city parameter in Shibuya-ward, Tokyo Metropolitan area, Japan. Obtained results are generalized and applied to the congested cities and wards in the world.
The guideline calculates required 50%-traffic offloading year for various cities and wards.
Definition of required 50%-offloading year means that the communication quality of service (QoS), such as the latency time and the throughput in the data communication, is seriously degraded, if the offloading is not put into force. In this analyses, all the data is assumed to be the Packet Switched (PS) based data traffic, and the throughput decrease and the latency time increase in the PS mean that the voice call blocking rate increases in the circuit switched (CS) system, when PS and CS co-share bandwidth of trunk line. So if traffic offloading to microcell is not taken after the required 50%-traffic offloading year, the communication QoS, such as latency time and call blocking, seriously decreases not only in data communications but also in voice communications.
If there is no traffic offloading guideline, mobile carriers select another business tactics. To solve the bottleneck in easygoing manner, it may be considered to introduce the non flat-rate tariff or the limited monthly quota. This strategy is not good selection for wireless cloud era, from the viewpoint of the competition among mobile carriers and also social utility. Another solution may be traffic control and/or shaping. The concept of network neutrality already set up in fixed networks, and it requires fairness, reasonable and transparent control. Non flat-rate tariff implementation to users may not be easy issue under the competition among several mobile carriers.
If the new macrocell RBSs are additionally build in the congested area to maintain QoS, the RBS invest cost without offloading becomes higher comparing with the traffic offloading to microcell, and results in the lose competition power among carriers.
Chapter 2 mentions current and forecast of estimated monthly traffic per capitain Japan. Chapter 3 describes the structure of traffic offloading. Chapter 4 describes analysis model and principle to minimize total cost of mobile base stations. In this chapter, Clark’s city model and cost ratio of macrocell and microcell base station is introduced to generalize the analysis. Chapter 5 shows the result of Shibuya ward, and the generalized value of traffic offload guideline is proposed. Chapter 6 derives the required 50%-traffic offloading year, based on the proposed generalized guideline. And some examples of the required offloading year are shown for various high population density cities and wards in the world, and it is shown that the time limit for offload is critical and very near in the congested cities.
2 Traffic Growth of Mobile Service
Japanese mobile traffic is monitored and prospected in the various organizations [4–6]. Figure 1 shows the monthly data size per capita (GB/month).
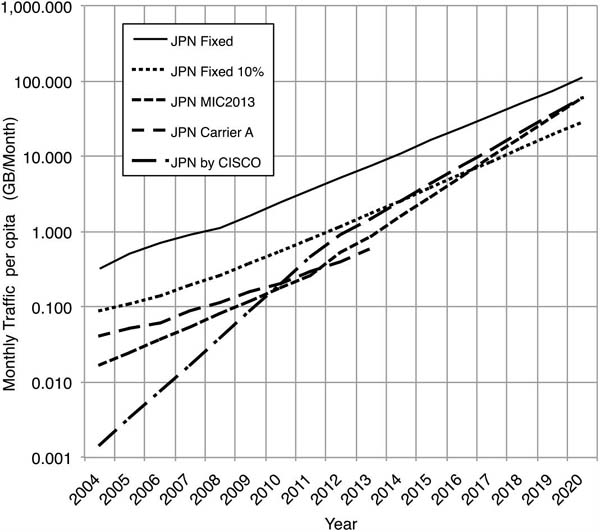
Figure 1 Japnese mobile traffic status and prospect
The Ministry of Internal Affaire and Communications Japan (MIC), summarized the existing network traffic report in 2004. In those days, compact HTML based on the i-Mode service and text mail were dominant, and the traffic is smaller comparing with the today’s traffic. In 2013, the real traffic is monitored and estimated by MIC. Also two mobile carriers in Japan prospected from their observed traffic in 2007. Those are shown in the figure, and lies little bit smaller than 10% of the fixed internet services. Traffic of fixed broadband service increases annual rate of 46%. From the estimations, target traffic of 3years later from now, i.e. 2017, reaches 10GBytes/month. Traffic estimated by Cisco is also illustrated in the figure. The annual growth rate (ARG) is as same as that measured by Japanese organizations. As shown in the figure, traffic growth is very rapid and the monthly traffic volume reaches to near volume of the fixed internet services. This is the motivation of the guideline setup.
3 Traffic Offload
Conceptual schema of traffic offload is shown in Figure 2. Figure 2(a) shows existing macrocell system without traffic offload, and all users utilize same macrocell mobile base station. Figure 2 (b) shows traffic offload to microcell system. In high population and/or high traffic area, microcell base stations, for example trusted/untrusted WLAN access is implemented, and traffic is offloaded to microcell mobile station. Usually, microcell base station is connected through fixed broadband networks and vertical handover between microcell and macrocell mobile networks are essential. Microcell base stations are implemented in high traffic area in highpriority. As the result of the priority, the traffic offload ratio is larger than microcell area ratio, as is shown in Figure 4.
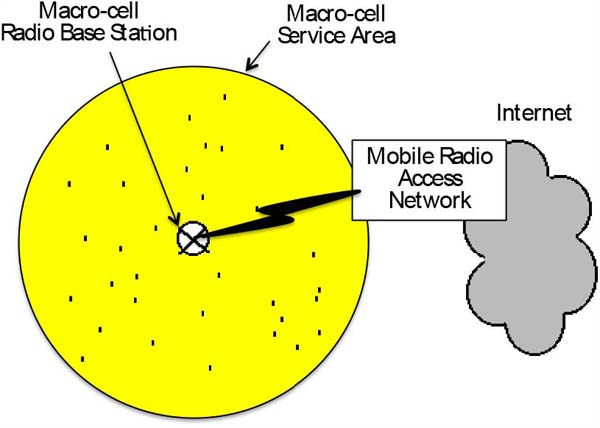
Figure 2 (a) Existing macrocell system

Figure 2 (b) Traffic offloading to microcell
4 Analysis Model
Evaluation parameter for offload guideline is the total RBS cost minimization under the limitation of existing radio spectrum. Outline of the model and the used parameters are summarized in Table 3. Detailed issue of the analysis model is shown in Section 4.1 through 4.4.
4.1 City and Population Model
Shibuya ward, Tokyo metropolitan in Japan is selected as a typical high traffic area. The obtained result is translated and generalized to the other global area shown in the chapter 5. Profile of Shibuya ward is shown in Table 1. Offered communication traffic is estimated from daytime population, because the peak traffic at go home hour is closely relating with a day time population.
Table 1 Profile of shibuya ward in Tokyo metropolitan, Japan
| Daytime Population Nd [person] | 559,000 |
| Area Sarea [m2] | 15,110,000 |
| Mobile Subscription rate Rm [%] (National Mean Value) | 78 |
| Equivalent City Radius of Shibuya (Circular Model) R[m] | 2,193 |
| Specified Carrier Share Rd [%] (Tokyo area) | 53.7 |
| Number of Users Parea | 234,157 |
| Population Concentlation Ratio (Clark City Model) β | 3 |
| Time Concentlation Ratio βt | 3 |
| City parameter η [person/m2] | 0.1395 |
| City parameter d | 1.8477×10⁻³ |
Real population distribution of Shibuya is like Figure 3(a). Some shopping mall and vicinity of railway stations show traffic peaks at several points and peak concentration ratios are different among them. This is generalized to equivalent Clark’s city model [7] shown in Figure 3(b). This city model has circler area that has same space, same population of Shibuya ward and modified equivalent population concentration ratio at the city center.
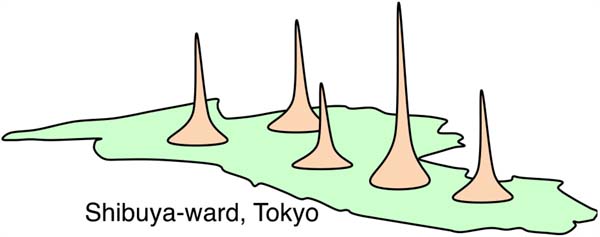
Figure 3 (a) Real population distribution of shibuya ward, Tokyo metropolitan, Japan
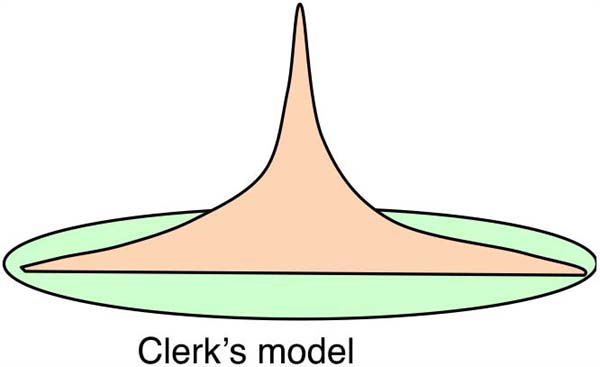
Figure 3 (b) Equivalent population model of clark model for calculation
Using Clark’s Model, population density f(r) is exponential and given by,
where, r denotes distance from city center, and η, d are parameters, those are calculated as follow.
If the total daytime population Nd exists in the all city area Sarea, and city radius is , and introduce the population concentration ratio β defined by the ratio of maximum population density at the city center and average population density, then peak population density η at the city center is shown
Population Nd exists in the city area Sarea, then
From the equation, parameter d is determined by using population concentration ratio β and city radius .
Supposing that the WLAN access point is installed first priority at the highest population area, WLAN available population ratio δ, that is defined by the ratio of WLAN available population and total population, is
where, rBS denotes equivalent radius of WLAN equipped circle area. If the WLAN installed area ratio α is defined by the ratio of WLAN installed area and total city area, and then
Using Equation (5) and (6), relation between δ and α is given as follow.
Figure 4 shows the WLAN access available population ratio δ(α), forShibuya ward, where S = 15,110,000 [m2], and population concentration ratio β = 1, 3, 6, 9.
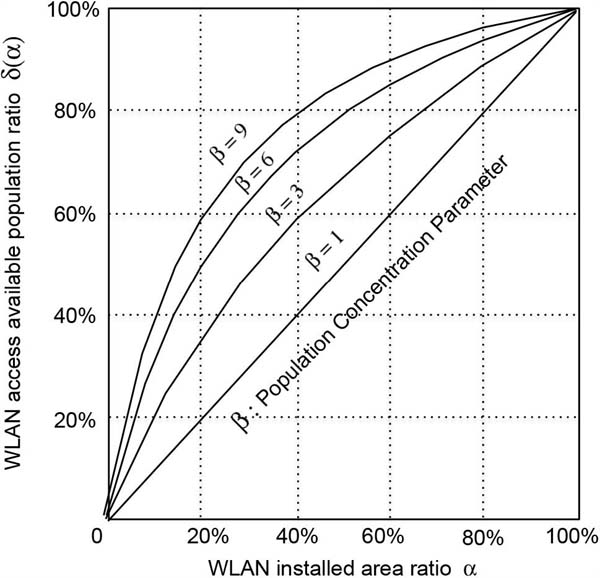
Figure 4 Relation between WLAN installed area ratio α [%] and WLAN available population ratio δ [%]
As is seen in the figure, in case of population concentration ratio of β = 3, 30% of population, i.e. traffic, can be offloaded, by installing WLAN into the 20% of total area. In case of more population concentrated case of β = 9, the 60% of traffic can be offloaded to WLAN by installing it into only 20% of total area.
4.2 Radio Base Station Model
Radio base station model and specifications are summarized in Table 2. Macrocell system utilizes LTE and WLAN utilizes IEEE802.11n operated in 5GHz to avoid interference from existing 2.4GHz users. Effective throughput is estimated by 20% of maximum throughput.
Table 2 Radio base station model for analysis
| Macro-cell | Micro-cell | |
|---|---|---|
| System Name | LTE | IEEE802.11n |
| Bandwidth [MHz] | 10* | 20*** |
| Number of RF Carriers [ch] | 2** | 3 |
| Number of Sectors | 3 | 1 |
| MIMO | 2×2 | 3×3 |
| Maximum Capacity [Mbps] | 86 | 156 |
| Effective Throughput [%] | 20 | |
| [Mbps] | 17.5 | 31 |
| Effective System Capacity [Mbps] | 35 | 93 |
| Cell Radius [m] | 500 | 20 |
| Area Size [m2] | 785,398 | 1,256 |
| *: one of pair band for frequency division duplex (FDD). | ||
| **: assigned channels to the one operator, i.e. equivalent to total. | ||
| ***: time division duplex (TDD) bandwidth. | ||
4.3 Traffic Model and Latency Time
Offered traffic of macrocell and microcell, Dmacro , and Dmicro, respectively, are
where, A, Parea, nmacro and nmicro, are the traffic from one user, the number of total users in the city for a specific mobile carrier, the number of macrocell RBS and the number of microcell RBS, respectively.
Required throughput of each macrocell and microcell RBS, ρmacro and ρmicro are
where Tmacro and Tmicro is the effective system capacity of each macro and microcell RBS, respectively.
To analyze the internet traffic, it may be better to use fractal or log-normal distribution not Poisson process, however, in this analysis, the widely used M/M/1/FCFS (Fast Come First Served) packet switched (PS) system is assumed, for the easiness of calculation and first order approximation. In this analyses, all the data is assumed to be the PS based traffic, and throughput decrease and latency time increase in PS means equivalent for the voice call blocking in circuit switched (CS) system, when PS and CS co-share bandwidth of trunk line.
Queue length E[nt] is
where ρ is average throughput of the system. From Littele’s Law,
where E[t] and λ denote the mean latency time and the mean packet arrival, respectively. The mean packet size and the maximum capacity are denoted by s and T, then the mean through put ρ will be given by
Then the mean latency time E[t] is given as follow.
For the web browsing, packet size distribution is known as log-normal distribution, and observed mean value is 11.18, and variance is 2.24 [9]. Mean data size s is s = exp (11.18+(2.24)2/2) = 880 [kB].
Using Equation (10), (11) and (15), macrocell and microcell latency time, E[t]macro and E[t]micro are as follows,
4.4 User Utility and Required Latency Time
Relation between user utility U(t) and latency time t is measured and show exponential relation, and given by
where g and h are parameters, and in case of fore ground picture browsing, following values are observed by using mean opinion score (MOS) experiment, based on ITU-R BT500-10 double-stimulus impairment scale (DSIS). User utility value U, i.e. MOS value, has in 0 (not allowable) to unity (no degradation), and allowable limit is normally set 0.6 (degraded but allowable). Figure 5 shows experimental results for various download case of Web Foreground (Web-F), FTP-Foreground (FTP-F) and FTP-Background (FTP-B). Web-F is normal user style for smart phone terminal, and most intolerant case. In this case, user utility U is shown as follow [8],

Figure 5 User utility and latency time
i.e. g = 0.808 and g = 0.0418.
If we set required MOS value u = 0.6, then the objective mean latency time E[t] is determined by the following Equation.
From the Equation (16) and (20),
Then necessary base stations nmacro is given as follow.
Also the necessary base stations nmicro is given as follow.
WLAN installed area ratio is determined by α, so the following condition should be satisfied.
where Smicro denotes the area of each microcell.
4.5 Total Cost Minimization by Traffic Offloading to WLAN Access
Total cost minimizing method and parameters are summarized in Table 3.
Table 3 Mobile base station selection model
| City Model and Population Density |
Metroplotan Area (Shibuya ward, Tokyo, Japan)
|
| Traffic Model |
|
| User Utility and Required Latency Time |
|
| Radio Base Station Implementation Methodology (Offload Guideline) |
Mobile Base Station Implementation Methodology
|
| Mobile Service Operator’s Profile and Base Station Equipment |
Market share of one operator: 53.7% (Tokyo vicinity) Mobie Subscription ratio: 78% (Avarage of Japan) Radio Equipment:
|
Mobile base station selection strategy and cost minimization are as follows.
- Daytime population density is estimated from the Clark’s city model. User density of the specific mobile carrier is calculated using their share.
- Area traffic is calculated from the average user traffic per capita and the user density. Busy hour traffic concentration ratio of βt = 3 is considered in this stage, which is shown in Table 1.
- Required latency time, i.e. 6.9 [sec], which is derived from the utility function shown in Equation (20), decides the required throughput and number of base stations for macrocell and microcell, i.e. Equation (22) and Equation (23), respectively.
- Minimize the sum of base station costs, and then decide offload ratio.
To minimize total RBS cost, cost ratio of macrocell RBS and micocell RBS is important parameter. RBS cost ratio C is defined by
where, Cmacro and Cmicro are the cost of each macrocell RBS and the cost of each microcell RBS, respectively.
Total RBS cost, Cost is given as follow,
Then optimum WLAN installed area ratio α is derived as Equation (27),
5 Results and Traffic Offload Guideline
5.1 Required Number of Base Stations
Numerical calculation is executed based on the model and process in chapter 4. Results are shown in Figure 6.
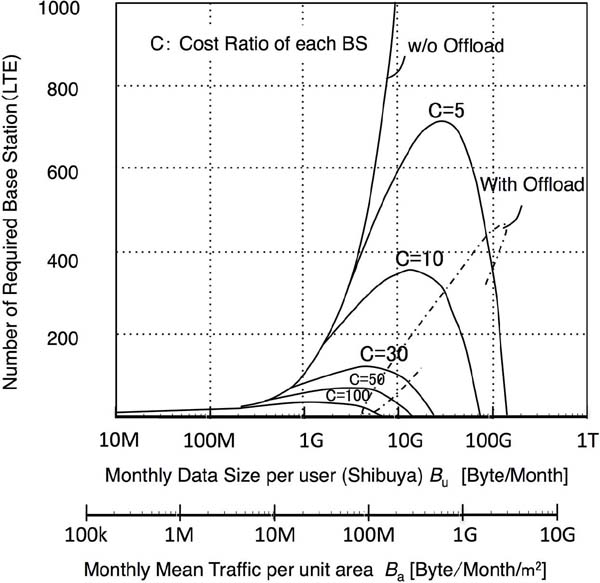
Figure 6 (a) Number of required mobile base stations for macrocell
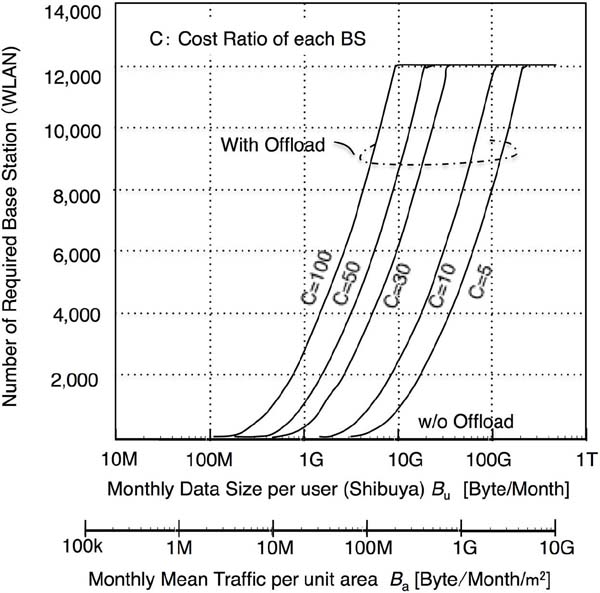
Figure 6 (b) Number of required mobile base stations for microcell
Figure 6(a) and (b) show number of required macrocell and microcell base stations nmacro, nmicro vs traffic per users Bu. In the figures, each base station cost ratio C defined by Equation (25) is changed from 5 to 100. As is seen in the figures, traffic offload is inevitable around user traffic of 1GB to 10GB/month.
For the general use of calculated results in any city, the traffic per user Tu [bps/user] is translated to the monthly data size per user Bu [byte/month/user], the traffic per unit area Ta [bps/m2] and the monthly data size per unit area Ba [byte/month/m2]. Following equations are translation equations.
where Nd, Rm, Rd and Sarea are daytime population, subscription ratio of mobile service, share of a specific mobile carrier and area of Shibuya ward, respectively, and Nd = 559,000, Rm =78%, Rd = 53.7%, Sarea =15,110,000 m2, as shown in Table 1.
5.2 Traffic Offload Ratio in Shibuya-Ward and Generalized Guideline for Various City
The required traffic offload ratio is calculated in Shibuya-ward, and the results is shown in Figure 7 according with the monthly data size per user Bu. As is seen in Figure 1, traffic will reach around 10GB/user/month in 5 years. In case of macrocell RBS cost is high, i.e. C=100, more than 80% of traffic should be offloaded to microcell base station, in the congested area. Even if the macrocell RBS cost becomes lower, i.e. C=5, several % of traffic should be offloaded in the high population area.
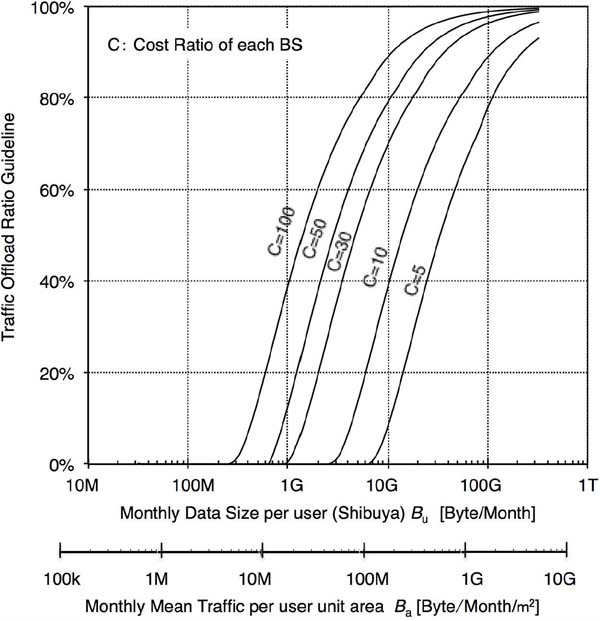
Figure 7 Traffic offload ratio guideline
From this results, the required 50%-traffic offload year in Shibuya-ward will be calculated 2014 incase of C=100, and 2018 in case of C=5. Relation between the offload ratio δ [%] and the microcell installed area ratio α [%] is shown in Figure 4, and from this figure, 50% offload means the microcell area ratio is 30% in case of the population concentration ratio β = 3.
If the traffic offload ratio, calculated in Shibuya-ward, is translated to the monthly data size per unit area Ba, the results obtained in Shibuya-ward is generally applicable to the other city in the world. In Figure 7, the monthly data size per unit area Ba is shown simultaneously. To follow the guideline, it is important that the parameter Monthly traffic per unit area Ba [byte/month/m2] is easy to measure and transparent. The parameter Ba [byte/month/m2] and traffic offload ratio may be measured by the mobile service operators already, however, it is not transparent to us, and all the congested cities in the world can not open such a data. Then, it is required to estimate the parameter by using the social and open bigdata. Next Section 7 shows the examples of the estimated results.
6 Required 50%-Traffic Offloading Year of Various Cities in the World
In this section, it is calculated that the several examples of the required 50%-Traffic Offloading year of various cities in the world. Required offloading year is briefly mentioned in the previous section. In this section, details of the calculation methods are defined. The calculation method is the following steps.
Monthly data traffic in n years after from 2012 per one user Bu, n is calculated by the following equation.
where Bu,2012, and AGRt are monthly data traffic in year 2012 per capita and annual growth rate in user traffic, respectively. Monthly mean data traffic per unit area in n years after from 2012, that is denoted by Ba, n is calculated by the following equation.
where Pud, 2012, and AGRu are mean user density in year 2012 and annual growth rate in number of users, respectively. In this paper, mean user density Pud,2012, is assumed and calculated from the population density Pd. For the easiness of estimation, it is estimated by Pud,2012 = Pd in case of AGRu < 1.5 % and Pud,2012 = 0.8 × Pd in case of AGRu > 1.5 %.
From Figure 7, we can obtain the guideline value of monthly traffic per unit area [MB/month/m2]. Table 4 shows this value.
Table 4 Guideline value of monthly traffic per unit area
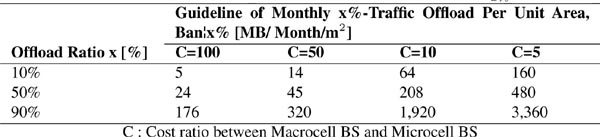
Using this guideline , required year n for offload is obtained from the following equation.
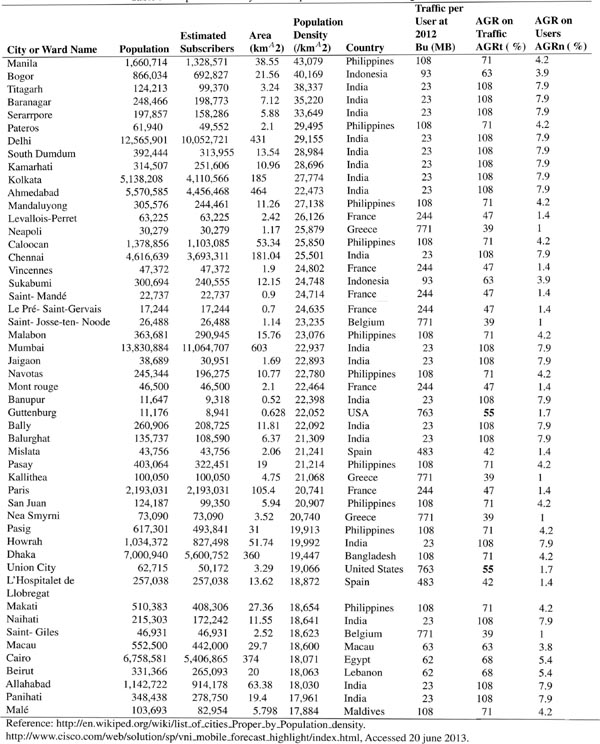
where, Rb denotes the bandwidth allocation ratio for various countries. There are wide variety of band assignments depend on the country, however 60MHz pair bands or 120MHz TDD bands are assumed in this analyses for the calculation easiness. Population density Pd is referred from Wikipedia [10]. The monthly data traffic in year 2012 per capita Bu,2012, the annual growth rate in user traffic AGRt, and the annual growth rate in number of users AGRu are referred from Cisco [6]. Data is summarized in Table 5.
Table 5 Population density and other paremeters of various congested cities
Calculated results using Equation (33) are shown in Figure 8(a) and (b). In the figures, base station cost ratio C is selected as variable parameter.
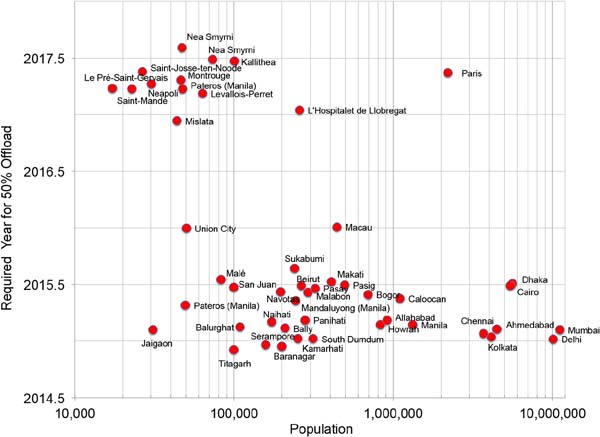
Figure 8 (a) Required year for 50% traffic offload (C=100)}
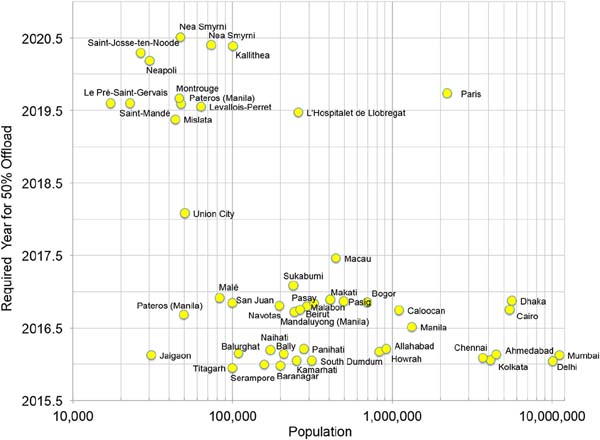
Figure 8 (b) Required year for 50% traffic offload (C=5)
Figure 8(a) shows the required 50%-traffic offloading year at the RBS cost ratio C=100, and this shows that almost all cities of the high population density should be traffic offloaded by the end of 2014 or 2015. Figure 8(b) shows the required 50%-traffic offloading year at the RBS cost ratio C=5, and this shows that almost all cities in high population density should be traffic offloaded by the end of 2016, even if the RBS cost of macrocell is reduced and increase the number of macrocell RBS.
7 Draft Proposal of Question
From the results of this research, Draft proposal of Question is proposed, as follow.
DRAFT NEW PROPOSAL OF QUESTION ITU-R XXX
Guideline of traffic offload ratio for mobile service
(2012-201x)
The ITU Radio Communication Assembly, considering
- that radio spectrum is the most important resource;
- that smart phone is penetrating rapidly as social universal service;
- that flat rate tariff is preferable to care of network neutrality and social utility;
- that traffic offload to microcell can mitigate the requirements for new radio spectrum allocations;
decides that the following guideline be established
- What types of traffic offloading technology is preferable?
- What is the relevant evaluation parameter for offloading to minimize spectrum resource and investment cost of radio base stations?
- What is the preferable measure of offload characteristics, that is transparent and observable including bigdata?
8 Conclusion
For the solution of heavy traffic concentration problem in wireless cloud era, the traffic offloading to microcell and the offload guideline is calculated at Shibuya-ward of Tokyo metropolitan, as a high traffic concentrating area in Japan. Guideline is based on the cost minimization strategy of the radio base stations and limitation of existing spectrum resource. Calculated results show that the traffic offloading to microcell is necessary in 5 years, even if the LTE is implemented at all radio base stations. Obtained results are translated to the universal parameters for the global use, and applied to various congested cities in the world. Required offload years are calculated for the high population cities and wards in the world, and results show that the traffic offload should be done very near future, even if the cost down of macrocell mobile radio base stations are done. From the proposed guideline, it is required to obtain the parameter of monthly traffic per unit area. The parameter can be directly obtained from the bigdata analyses from the operating mobile carriers, and it may be better to establish monitoring system and methodology. It is recommended that the parameters are opened to users and regulatory body of radio spectrum, for the enhancement of social utility. Another indirect method is the estimation from the social and open bigdata analyses, and the method is applicable for the region in that mobile service operation carrier has no data. At the same time, the urgent and real implementation of offloading technology including wireless agents, and the offloading promotion are required now.
Acknowledgment
I am indebted to Prof. Dr. Katsutoshi Tsukamoto, Osaka Institute of Technology and Associate Professor Dr. Takeshi Higashino, Nara Institute of Technology for their valuable discussions and comments, and also would like to thank Mr. Nobuyuki Shutto for their supports and research works on this issue in Osaka University.
References
[1] Sankaran, C. B., “Data offloading techniques in 3GPP Rel-10 networks: A tutorial,” Communications Magazine, IEEE, Vol.50, No.6, pp.46–53, January 2012
[2] Singh Sarabjot, Dhillon S. Harpreet, Andrews G. Jeffrey, “Offloading in Heterogeneous Networks: Modeling, Analysis, and Design Insights,” Trans. on Wireless Communications, IEEE, Vol. 12, No. 5, pp. 2484–2497, May 2013
[3] Aijaz A., Aghvami, H., Amani, M., “A survey on mobile data offloading: technical and business perspectives,” Wireless Communications, IEEE, Vol. 20, No. 2, pp. 104–112, April 2013
[4] Ministry of Internal Affairs and Communications, “Report of present Communication Traffic in Japan; 2009,” http://www.google.co.jp/url?sa=t&rct=j&q=&esrc=s&source=web&cd=1&ved=0CC4QFjAA&url=http%3A%2F%2Fwww.soumu.go.jp%2Fjohotsusintokei%2Fwhitepaper%2Fja%2Fh21%2Fexcel%2Fl4303110.xls&ei=aozCUdC1NcPZrQes4YDoAg&usg=AFQjCNE802U170XjPHCi88GzPIOMNS6HSw& bvm=bv.48175248,d.bmk, Accessed 20 June 2013
[5] Ministry of Internal Affairs and Communications, “Report of Communication Traffic in Japan: 2012,” http://www.soumu.go.jp/johotsusintokei/field/tsuushin06.html, accessed 20 June 2013.
[6] Cisco Corp., “VNI Mobile Forecast Highlights, 2012–2017”, http://www.cisco.com/web/solutions/sp/vni/vni_mobile_forecast_highlight/index.html, Accessed 20 June 2013.
[7] Colin Clark, “Urban Population Density”, Journal of Royal Statistical Society, Series A, Vol. 114, pp.490–496, 1951
[8] Yuji Handa Nobuyuki Shutto Takeshi Higashino Katsutoshi Tsukamo to and Shozo Komaki, “A Proposal of the SLA for Consumers and Measurements of Utility Functions to Specify the SLA,” Annual report of JSICR, March 2007.
[9] Masahiko Nabe, Kenichi Baba, Masayuki Murata, et.al., “WWW Traffic Analysis and Modeling for Internet Access Network Design (in Japanese),” IEICE Trans. B-1, Vol 80, No.6, p.p. 428-437, June,1997.
[10] Wiki pedia, “List of cities proper by population density”, http://en.wikipedia.org/wiki/List_of_cities_proper_by_population_density, Accessed 20 June 2013.
Biographies

Shozo Komaki, Professor, MJIIT, UTM. He was born in 1947. He received BS, MS and PhD degrees from Osaka University in 1970, 1972 and 1983, respectively. He joined to NTT Electrical Communication Labs. in 1972, where he was engaged in R&D on digital microwave radio systems. From 1990, he moved to Osaka University and engaging in the research on Radio on Fiber Networks, Wireless service over IP networks, Software Definable Radio Networks and Radio Agents. He is currently a Professor of Malaysia-Japan International Institute of Technology (MJIIT), Universiti Teknologi Malaysia (UTM).

Naoki Ohshima, Associate Professor, MJIIT, UTM. He was born in 1964. He graduated from Doctoral course of Department of Crystalline Materials Science, Graduate School of Engineering, Nagoya University in 1993, and earned his Doctor degree of Engineering. His first faculty position was at Electrical and Electronic Information Engineering, Toyohashi University of Technology from 1993 to 1999. From 1999 to 2005, he belonged to Department of Advanced Materials Science and Engineering, Yamaguchi University. In 2005, he moved to Graduate School of Innovation & Technology Management, Yamaguchi University. He is currently an Associate Professor of Malaysia-Japan International Institute of Technology (MJIIT), Universiti Teknologi Malaysia (UTM).

Hassan Keshavarz Ph.D Candidate, MJIIT, UTM He was born in 1982. He received his M.Sc. at Computer Science in 2013 from University of Malaya (UM), and he got his BSc (Software Engineering) in 2007 in Iran. His main research interests include Big Data, Data Mining, Flow Analysis, and Internet of Things. He is a member of IEEE society and it can be communicated via hassan@mjiit.com. He is currently a Ph.D. candidate and research assistant in Malaysia-Japan International Institute of Technology (MJIIT) in the Management of Technology (MOT) Department at the Universiti Technologi Malaysia, Malaysia.