Fuzzy Based Predication Technique for Diabetics Association Analysis for Salem District Farmers
A. Dalvin Vinoth Kumar
Assistant Professor, Department of Computer Applications, Dayananda Sagar University, Bengaluru, India
E-mail: dal_win@ymail.com
Received 30 July 2021; Accepted 09 February 2022; Publication 07 May 2022
Abstract
Diabetes is a one of the major issue that all people in the world currently face. Diabetes is caused by excessive amounts of sugar in the blood. Once diabetes is diagnosed, it is not completely curable, but it can be controlled with proper medication, exercise and a balanced diet. Diabetes affects the vital organs of the body such as the heart, kidneys, brain and eyes. The diabetes mellitus and its complications can be determined using a variety of pathological tests, such as patients’ symptoms and blood sugar, urine and lipid profile. The use of fuzzy logic in diagnosis is very common and useful because it combines the knowledge and experience of the physician into ambiguous sets and rules. Most of the researchers proposed methods to diagnosis the diabetes mellitus but still it in their infancy level. This work proposed a fuzzy based system for diagnosing diabetes disease. The usage of pesticides in agriculture by farmers is treated as one of the dependent variable for predication. The empirical zif’s law is used to compute the frequency of farmers using pesticides are predicated as diabetic. The output of the proposed system proved that the fuzzy based prediction model diagnosis the disease accurately.
Keywords: Data mining, classification, predication, fuzzy preprocessing.
1 Introduction
Diabetes mellitus (TM) is a chronic non communicable disease in which the body cannot use sugar properly [1]. It will occur when pancreas does not provide or use insulin effectively. Diabetes is on the rise globally due to the changes in lifestyle, inappropriate physical activity and food habits. According to the World Health Organization (WHO), in 2015 there were 8.5 million diabetes patients aged 18 years and older [2]. Furthermore, diabetes caused 1.6 million deaths in 2017. Diabetes classified into different types, namely Type 1, Tye 2 and Type 3 or Gestational. Type-1 diabetes is called insulin-based or early childhood, which is mainly caused by insulin deficiency. This type of diabetes is unknown in nature and cannot be prevented by actual knowledge [3]. Type-2 diabetes is known as non-insulin, and most people suffer from this problem. Excess body weight and physical inactivity are the main causes of this type of diabetes [4]. Finally, gestational diabetes is a disease caused by low levels of glucose in the blood during pregnancy [5]. This paper aimed to propose fuzzy logic based approach for diagnosing the diabetes mellitus. The organization of the work as follows Section 2 discuss the existing research on the area of diabetes prediction, Section 3 proposed fuzzy based model, Section 4 describes the results obtained from the experiment, finally discuss the conclusion and future directions.
2 Related Works
Shih-chiag et al., [6] proposed an approach to validate the various prediction models of diabetes remission. Dataset was collected from 128 patients who underwent sleeve gastrectomy at least one year for this experiment. In this work, 11 models were used to predict the disease which was used in existing. Finally, the results were revealed for the diabetes remission that proved 71.9% diabetes remission at one year after the sleeve gatrectomy and 61.4 % affected by fat loss.
Srivastava et al., [7] proposed a prediction model using machine learning algorithm to predict the possibility of diabetes disease. For this experiment, the Pima Indian dataset was used which was collected from the online. Some statistical techniques were applied to the dataset for cleaning the data. After that the ANN prediction model was built using core python and parameter used were Root mean squared error and Receiver Operating Characteristic (ROC) curve to analyze the performance of ANN model. The Proposed model predicted 92% of the possibility of diabetes disease.
Sajida perveen et al., [8] proposed a prediction model using machine learning techniques for predicting diabetes disease and analyzed the association between diabetes and risk of metabolic syndrome. The performance of the proposed model were measured by generating balanced tree using various parameters that are Random sampling, Over sampling and K-Means sampling techniques. The proposed work proved that the accuracy improved due to the use of balanced tree.
Beatriz et al., [9] proposed a prediction model to predict Type – 2 diabetes using Random forest technique. This paper aimed to determine the single nucleotide polymorphism that promotes the development of the type 2 diabetes disease. Here, 10 fold cross validation method was used to improve the performance of the technique. The proposed technique was outperformed SVM and Logistic regression in terms of accuracy.
Cheieh-chen et al., [10] proposed a machine learning model to predict the fatty liver disease. Various classification methods were used for this prediction such as naive bayes, ANN and logistic regression. Moreover the performances of the algorithms were evaluated by the author using ROC curve. The authors identified out of these four models, random forest model showed better performance than others. The proposed model can be used by the physicians classifying the high risk patients, make a novel diagnosis, prevent and manage.
Zif’s law formulated using mathematical statistics to be used in many empirical data distribution. The data input to compute the frequency of occurrence. This law is named after George Kingsley Zipf as zif’s law [11]. He is an American Linguist belongs to the period of 1902 to 1950. This law is not limited to be used in data frequency computation neither can also be used in other application listed in Table 1.
Table 1
| S. No. | Authors | Application | Year |
| 1 | Adamic, L. A et al. [12] | Internet | 2002 |
| 2 | Gabaix et al. [13] | City | 1999 |
| 3 | Okuyama et al. [14] | Income Distribution | 1999 |
| 4 | Corominas-Murtra et al. [15] | Communication | 2011 |
| 5 | Arshad et al. [16] | City Distribution | 2018 |
3 Proposed Methodology
The proposed System includes three layers to process large amount of data. Data collection is done in the first layer using questionnaire. The questionnaire was prepared using a Google form that contained a variety of questions such as physical conditions, use of pesticides, and medical details. Second layer stores the data into a local databse. In addition, fuzzy based model developed for preprocessing. The third layer uses bigdataml tool to develop the Zipf’s law based prediction model for diabetes diseases.
Layer 1: Data collection
Salem area is located in north Tamil Nadu. It is situated between on 11.669437N Latitude, 78.140865E Longitude at a normal height of 278 m (912 ft) over the mean ocean level aside from Yercaud slopes. It has a region of about 7905.38 Kms with 38, 96,388 occupants. The dirts of Salem area can be extensively grouped into 4 significant soils types’ viz., Red Soil, Thin Red Soil, Red Loam, Sand red ferruginous and red sand. Red soil is the transcendent one covering significant piece of the region followed by Thin Red soil and Red topsoil. The red soils are prevalently observed in Sankari, Edappadi, Tharamangalam, Omalur and Mettur Blocks. The dark soil is viewed as generally rich. The red soil is equivalent to topsoil in Productivity in and around Attur. Dark soil is because of alluvial stores with red subsoil Millets and different grains are the chief harvests in Salem locale which spreads significant territory of 93678 Hectares followed by Pulses, I. e 60743 ha. Oilseeds, Rice, Sugarcane are developed in 37198 Ha, 11038 Ha and 4986 Ha separately. Normal size of Land holding is 0.86 Hectare.
Data collection step is used for accumulating the individuals’ physiological details, pesticides usage, personal details through questionnaire. The questionnaire includes 30 multi choice questions that shared to farmers (random selection) who lived in selam. In which, category 1 questions about a particular person’s personal profile, category 2 questions about medical information, and the category 3 questions about the use of pesticides. The responses are collected from 1948 people from salem district take as sample data for further process. The nature of the data is with respect to age and sex is shown in Figure 1.
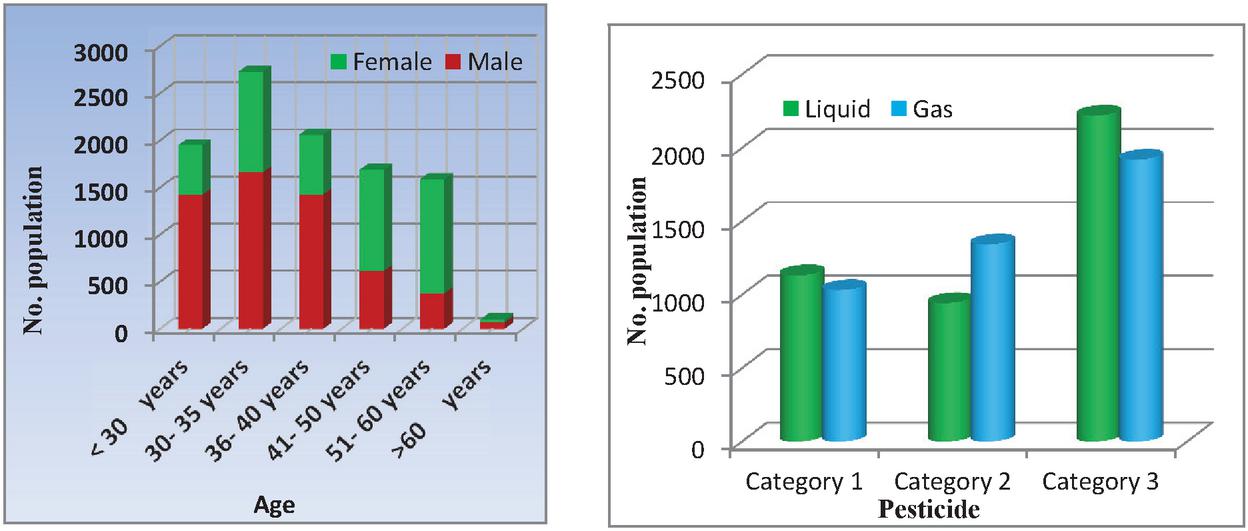
Figure 1 Collected Data Distribution.
The proposed framework uses traditional database to store the collected data in a distributed manner. When an account is created in Google form, it automatically creates a storage space to save the responses. The collected data is full of noisy and inconsistent. It has to clean then only the proposed model give a better result. In this phase, Data preprocessing is perform to reduce noisy data, missing values, smooth noise data, removing outliers etc., using various methods are data cleaning, data transformation, data integration and data reduction. Moreover, fuzzy based model is developed for transform the data from numeric to categorical. The fuzzy rules constructed for controlling the input variables. A membership function in fuzzy rule is used for quantifying the linguistic term in input variables. The pesticide used in agricultural is also considered as one of the feature for diabetic predication, whereas it is a non- deterministic value so it is converted into deterministic value using fuzzy inference for making decision as show in Figure 2. The stages involved in fuzzy is given below,
Stage 1 – Set of fluffy principles should be resolved in intial stage.
Stage 2 – In this progression, by utilizing input enrollment functions, fuzzify the input.
Stage 3 – Now set up the standard quality by consolidating the fuzzified contributions as indicated by fuzzy principles.
Stage 4 – In this progression, decide the resulting of rule by consolidating the standard quality and the yield participation work.
Stage 5 – For getting yield conveyance join all the consequents.
Stage 6 – Finally, a defuzzified yield conveyance is acquired.

Figure 2 Data preprocessing using fuzzy engine.
The input variable converted as medium, low and high using fuzzy logic method. The fuzzy membership function on a input variable is represented in Figure 1.
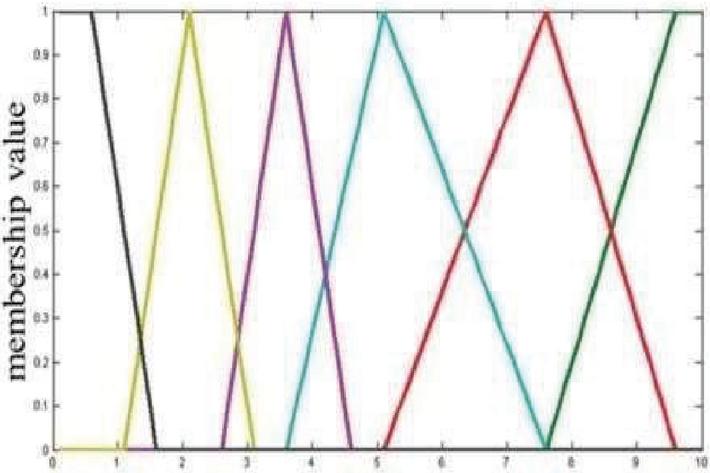
Figure 3 Input modeling Member function for pesticides.
The decision to make an ambiguous inference is derived from the rules stored in database. Basically rules are like if – then statements that are applied to process such as work. The rules used in this work are based on literature review and the relevant government agencies. Here, A set of rules used to derive output as inputted in the MATLAB software that depicted in Figure 2. The rules too are defined in the imprecise sense, so they are not crisp but fuzzy values. The input parameters are fuzzified according to the member function of the respective variables.
If class is A && Pesticide name is B && Level is C then Category is f( A, B, C)
Third Layer: Data Analytics
Data analytics layer is used for the improvement of the prediction model using Zibf’s law. The proposed frame-work uses Bigdata ML for implementing the Zibf’s law, which is one of the statistical methods for predicting the frequency between variables and measure the rank. It provided concrete formulation to degree the great match and to analyze the inversely proportional low ranking. Importantly, the Zipf law works in proportion to the frequency of use. The frequency of utterance automatically decreases whenever the data is extended.
Zibf’s Law defined by,
The proposed system uses Zibf’s laws to develop the prediction model for predicting the diabetes diseases which caused by the usage of pesticides. The decision tree method has used in this system to classify the data for the development of the prediction model. Once the collected data is stored in the database, the rules are applied for developing a prediction model.
Figure 4 represents a frequency of diabetic and non diabetic which measure by ranking. X axis denoted frequency occurrence and y axis denoted frequency rank. The rank was inversely proportional to the prediction accuracy.
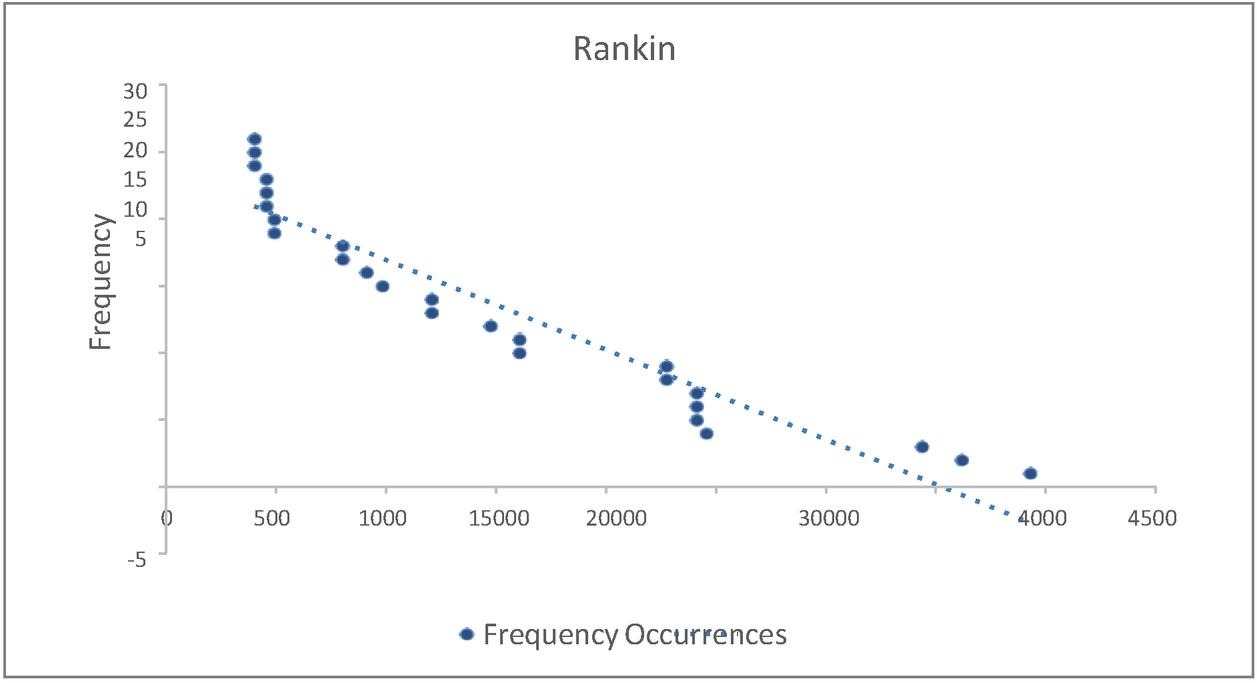
Figure 4 Frequency of pesticide triggered diabetics occurrence.
4 Results and Discussion
By varying the quantitative values of all input variables age, blood sugar, air quality, pressure results are obtained according to the rules as shown in Figure 1. Fuzzy Member functions rage that is from low to high is differs from 0 to 100 through increasing the values of input variables of the possibility of disease. MATLAB’s Fuzzy Toolbox Software is used to obtain the output value - the probability of a disease in terms of percentage.
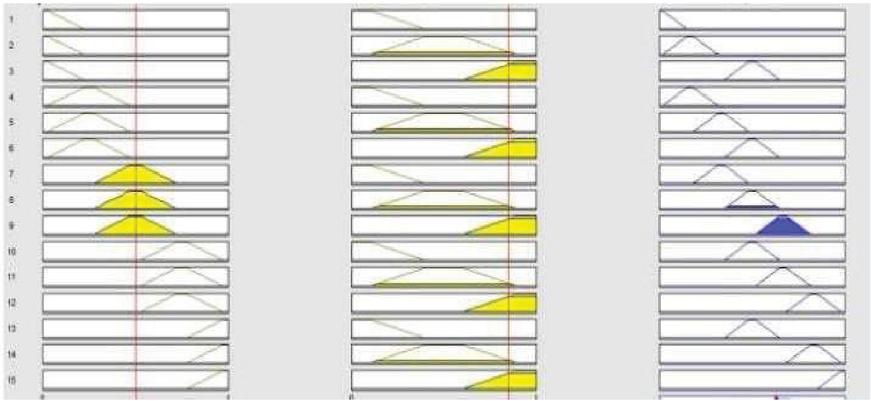
Figure 5 Deterministic output of fuzzy engine.
Performance Evaluation
The performance of the algorithms in this study is evaluated by various metrics such as Accuracy, Recall, specificity, precision and F1-measure. These metrics are measured in terms of true positive and true negative, false positive and false negative.
Accuracy
Accuracy used in classification algorithm for providing the correct ratio of prediction for all types. The accuracy is calculated using Equation (1).
| (1) |
Sensitivity or Recall
Sensitivity is referred to as a measure and it also has some other names respectively, true positive and recall. It provides us the ratio of positive instances.
| (2) |
Specificity
It is also defined as a measure and opposite to recall, it is called as true negative. It tells us the ratio of the true negative.
| (3) |
Precision
Precision is the calculation for finding the ratio among the actual positive score and positive score predicted by classification algorithms.
| (4) |
F – Measure
F – Measure is the average of recall. It is used to evaluate better performance of classification algorithm. For accurate performance, it provides one and zero for bad performance
| (5) |
Table 2 Confusion matrix for predication algorithm
| Recall | Precision | F-Measure | Accuracy | |
| Positive Status | 0.6761 | 0.8135 | 0.7384 | 0.6936 |
| Negative Status | 0.6375 | 0.6818 | 0.7894 | 0.7419 |
| Neutral | 0.6428 | 0.5294 | 0.5806 | 0.6176 |
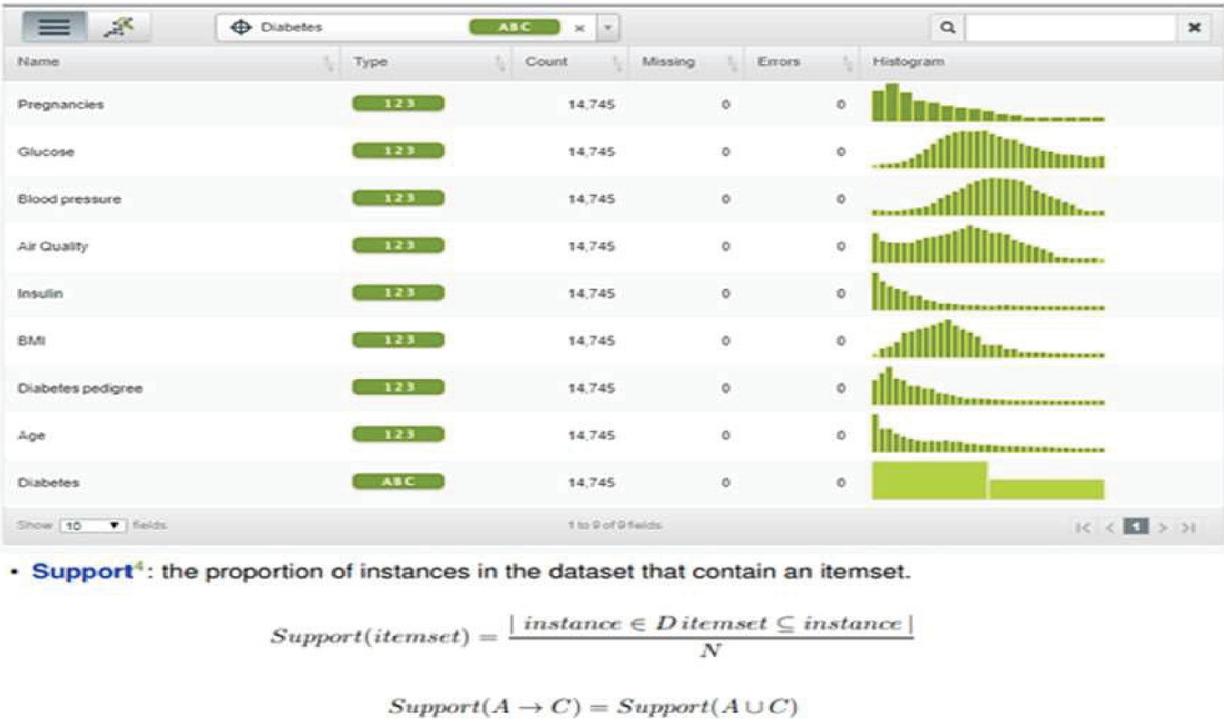
Figure 6 Data analysis using BigML tool.
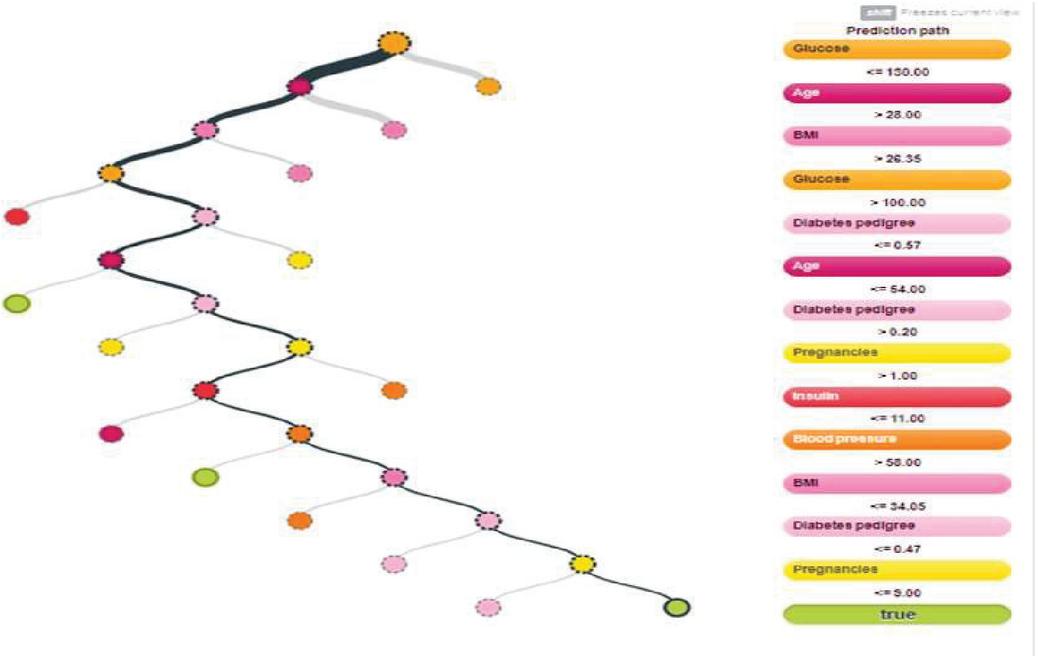
Figure 7 Predication model with least confidence of maximum features.
Table 2 depicts the confusion matrix generated from the proposed model for various levels of parameters. The result classify into three classes such as positive, negative status and neural. Based on these, recall, precision, f measure and accuracy has evaluated.
The preprocessed information is currently associated with examination to fabricate forecast model. Right now three sort – II Diabetes predicative models are created utilizing BIGML device. BigML gives AI calculations as Software as a Services (SaaS). It tends to be gotten to through three models in particular web interface, order line and Restful API. The Model are created utilizing web interface. BigML gives different AI calculation. The handling of model creation utilizing BigML is appeared in Figure 5.
5 Conclusion
Type 2 diabetes is the most widely recognized type of diabetes. It happens when glucose levels ascend because of issues with the utilization or creation of insulin. It can show up at any age, yet it is bound to happen after the age of 45 years. It influences more than 30 million Americans, as per the United States Centers for Disease Control and Prevention (CDC). This paper provides a prediction model to identify the associativity between pesticides and diabetics. The data collection was carried to the farmers in salem district randomly. The outcomes of this study propose that the event of diabetes among salem district farmers was related with pesticide introduction. This finding is in accordance with past epidemiological and creature considers. Further investigation utilizing a bigger sample size is expected to affirm association between pesticides and diabetics.
References
[1] Zimmet, Paul, K. George Alberti, Dianna J. Magliano, and Peter H. Bennett, “Diabetes mellitus statistics on prevalence and mortality: facts and fallacies”, Nature Reviews Endocrinology 12, Issue. 10, 2016.
[2] Gojka Roglic, Diabetes, Mar 2020, Accessed on: Mar. 15, 2020. [Online] Available: https://www.who.int/diabetes/en/
[3] Katsarou, Anastasia, Soffia Gudbjörnsdottir, ArazRawshani, Dana Dabelea, EzioBonifacio, Barbara J. Anderson, Laura M. Jacobsen, Desmond A. Schatz, and ÅkeLernmark. “Type 1 diabetes mellitus.” Nature reviews Disease primers 3, 2017.
[4] DeFronzo, Ralph A., EleFerrannini, Leif Groop, Robert R. Henry, William H. Herman, Jens Juul Holst, Frank B. Hu et al. “Type 2 diabetes mellitus.” Nature reviews Disease primers, 2015.
[5] Kamana, K. C., SumistiShakya, and Hua Zhang. “Gestational diabetes mellitus and macrosomia: a literature review.” Annals of Nutrition and Metabolism, Issue. 2, pp. 14–20, 2015,.
[6] Shih-Chiang, Weu Wang, Ka-Wai Tam, Shen, Hsin-An Chen, Yen-Kuang Lin, Shih-Yun Wang, Ming-Te Huang, and Yen-Hao Su, “Validating Risk Prediction Models of Diabetes Remission After Sleeve Gastrectomy”, Obesity surgery 29, no. 1 , 2019, pp. 221–229.
[7] Srivastava S., Sharma L., Sharma V., Kumar A., Darbari H., “Prediction of Diabetes Using Artificial Neural Network Approach”, Communication and Information Processing, vol. 478. Springer, 2019.
[8] Perveen, Sajida, Muhammad Shahbaz, Karim Keshavjee, and Aziz Guergachi, “Metabolic Syndrome and Development of Diabetes Mellitus: Predictive Modeling Based on Machine Learning Techniques”, IEEE Access 7, 2018, pp. 1365–1375.
[9] López, Beatriz, Ferran Torrent-Fontbona, Ramón Viñas, and José Manuel Fernández-Real, “Single Nucleotide Polymorphism relevance learning with Random Forests for Type 2 diabetes risk prediction”, Artificial intelligence in medicine 85, 2018, pp. 43–49.
[10] Wu, Chieh-Chen, Wen-Chun Yeh, Wen-Ding Hsu, Md Mohaimenul Islam, Phung Anh Alex Nguyen, Tahmina Nasrin Poly, Yao-Chin Wang, Hsuan-Chia Yang, and Yu- Chuan Jack Li, “Prediction of fatty liver disease using machine learning algorithms”, Computer methods and programs in biomedicine 170, 2019, pp. 23–29.
[11] Alexander, Linda, Roger Johnson, and John Weiss. “Exploring Zipf’s law.” Teaching Mathematics and Its Applications: International Journal of the IMA, vol. 17, no. 4, 1998, pp. 155–158.
[12] Adamic, L. A., and Huberman, B. A. Zipf’s law and the Internet. Glottometrics, vol. 3, no. 1, 2002, pp. 143–150.
[13] Gabaix, Xavier. “Zipf’s law for cities: an explanation.” The Quarterly journal of economics, vol. 114, no. 3, 1999, pp. 739–767.
[14] Okuyama, K., Takayasu, M., and Takayasu, H, Zipf’s law in income distribution of companies. Physica A: Statistical Mechanics and its Applications, vol. 269, no. 1, 1999, pp. 125–131.
[15] Corominas-Murtra, B., Fortuny, J., and Sole, R. V, Emergence of Zipf’s law in the evolution of communication. Physical Review E, vol. 83, no. 3, 2011, pp. 036115.
[16] Arshad, S., Hu, S., and Ashraf, B. N, Zipf’s law and city size distribution: A survey of the literature and future research agenda. Physica A: Statistical mechanics and its applications, vol. 492, 2018, pp. 75–92.
Biography
A. Dalvin Vinoth Kumar, Assistant Professor, Dept. of Computer Applications, Dayananda Sagar University Bengaluru, has 4 years of Teaching and 7 years of research experience. He pursued his Ph.D. in IoT and obtained Ph.D., Degree from Bharathidasan University. His areas of interest include MANET, IoT, Routing Protocols, Computer Vision and IoT Data Analytics. He filed 3 Indian Patents and 1 computer software copyright granted. He has published 35 research papers in various reputed National & International Journals and published research Papers in National & International conferences. He presented 22 papers in various National & International conferences. He also delivered 40 Lectures in Conferences/Seminars/Workshops/Webinars. He is, Active member and review Member in national and International bodies like Internet of Things Community, IEEE. He received BEST Innovator Award from CIYF and Ministry of Youth Affairs Government of India. He also Received Best researcher in Science Award from St. Joseph College. He was participated in Swachhathon 1.0 conducted by Ministry of Drinking Water and Sanitation Government of India. He presented and received Top poster Award, a poster Entitled “Health Monitoring of Rural Pregnant Women using IoT” in Indian International Science Feast conducted by DST Govt. of India. He has presented a paper in an ACM International at Singapore. He was also the recipient of 5 best paper awards.
Journal of ICT Standardization, Vol. 10_2, 165–178.
doi: 10.13052/jicts2245-800X.1024
© 2022 River Publishers