Phenotype Based Smart Mobile Application for Crop Yield Prediction and Forecasting Using Machine Learning and Time Series Models
S. Iniyan* and R. Jebakumar
Department of Computer Science and Engineering, SRM Institute of Science and Technology, Chennai, India
E-mail: iniyans@srmist.edu.in
*Corresponding Author
Received 13 August 2021; Accepted 18 October 2021; Publication 11 January 2022
Abstract
Prediction and forecasting of crop yield recently plays a vital role in the field of Agriculture. Drastic changes in climatic conditions, changes in rainfall season, and lack of nutrients content in the soil etc., due to major factors such as rapid industrialisation, global warming and pollution. This leads to the farmers’ predictions based on their own agricultural experiences on various crop yields based on external factors gone wrong. This results in farmers not getting adequate yield and suffering from financial loss. Machine learning and time series models are involved in this research work to carry out prediction and forecast of corn and soybean crop production over time through mobile application and it consist of various regression algorithms of machine learning such as multiple linear regression (MLR), decision tree regression (DTR), random forest tree regression (RFTR), k-nearest neighbour (KNN) and gradient boosting regression (GBR) are used for crop yield prediction. Time series models such as auto regression (AR), moving average (MA), auto regression integrated moving average (ARIMA) and vector auto regression (VAR) used for forecast of crop production. Comparative analysis also made between machine learning and time series models, in which GBR of machine learning outperformed other machine learning models with 92.648% predicted yield accuracy and VAR of time series model outperformed other time series models with 94.367% forecasted yield accuracy. Regression metrics such as mean square error (MSE), root mean square error (RMSE) and mean absolute error (MAE) are also involved in predicting crop yields.
Keywords: Mobile application, yield prediction, forecast, regression models, time series models, internet of things.
1 Introduction
In earlier day’s farmer’s domain knowledge about the various crops and fields played a vital role in the forecast and prediction of crop production. They have been involved in agriculture across the generations, giving them expertise about various crop production with respect to seasons, climatic conditions, environmental parameters, soil characteristics and irrigation facilities. Historically prediction and forecast of crop production is usually made by the farmers based on their vast knowledge about the crops and fields. Their prediction and forecast about the crop production was more accurate and got better yield on various crops across various fields. In present days, due to rapid industrialisation and other technological developments across the globe adversely affect agriculture and its production. Many countries are facing food demand due to changing climatic factors, lack of water resources, global warming and various other reasons. Nowadays it is very difficult for the farmers to forecast crop productions due to the above mentioned changing parameters and some of the predictions have gone wrong, this leads to financial loss and suicidal rates of farmers increasing day by day. The overall food supply chain is drastically affected due to inadequate forecasting techniques related to the changing climatic conditions, lack of soil minerals and other changing parameters.
Recent technological developments played a major role in the betterment of agriculture in terms achieving good productions, early crop disease identification and classification, crop monitoring and automated irrigation facilities etc., IoT [1], They were recently prominent in the sector of agriculture by deploying sensors in the fields to monitor the crops, irrigation management and earlier disease detection in crops etc., There are various sensors such as light sensor, soil moisture sensor, humidity sensor, soil minerals sensors etc., were placed in various places of agricultural fields are connected to internet and the data can be transmitted to remote locations for the crop monitoring and other usages. Cloud computing [2], a major technology playing a vital role in crop related data storage management. Data retrieved from the various IoT sensors were transmitted to the cloud storage for effective crop management purposes. Data from cloud repositories can be used anywhere across the globe for the crop monitoring through the sensors values, crop yield prediction and forecast also carried out with yield related data, irrigation management can be effectively carried out with irrigation related data. Data mining process [3], also involved in the effective agricultural practices. Extraction of relevant data and finding the hidden knowledge about the crop data leads to effective crop yield prediction and other crop management processes. Machine learning and Time series models [4], created a remarkable impact in crop production and disease management process. Number of ML and time series algorithms were engaged in the forecasting of crop yields, plant disease detection and classification, crop selection and classification. Image processing techniques [5, 6], also involved in the process of early disease detection and classification of crop leaves images. Crop disease negatively impacted crop production, there different image classifying machine learning algorithms are available to classify the infected leaves from the healthier one.
The structure of the paper is illustrated as follows Section 2 covers related crop yield prediction and forecast research, Sections 3, 4 and 5 deals about pre-processing, Sections 6 and 7 describes about machine learning regression models and time series feature engineering process, Section 8 illustrates about methodology and workflow, Section 9 deals about results and discussions of machine learning and time series models and Section 10 deals about concluding remarks.
2 Related Works
Support vector machine (SVM) [7], applied in the crop named maize, classification and prediction of yield process. Classification and yield related information gleaned from remote sensing and accuracy comparison made between other machine learning classifiers and predictors namely Decision tree (DT) and random forest (RF) with accuracy parameter metrics of lowest RMSE and MAE. Forward feature selection based SVM [8], involved in the sugarcane crop yield forecast procedure. Data collection part includes domain knowledge of experts as well as historical sugarcane crop data across the years. The accuracy of Forward feature selection SVM was higher with other regressors. Random forest (RF) [9], employed in the wheat crop yield forecast process, including environmental and meteorological data for training and testing. The performance of RF is better than the SVM when it comes to precision in related to lowest regression equivalent such as MAE, RMSE. Random forest [10], also engaged in the crop yield prediction process of grain crops. Dataset comprises multiple grains data in different farm land and it also covers seasonality data of pre, mid and late season of grain crops. RF outperformed all other machine learning prediction algorithms with major regression accuracy parameter metrics were considered. All machine learning predictions are trained and tested, and their predictive performance is compared. Extreme machine learning (EML) [11], engaged in estimation of agricultural yield of coffee crops. It includes yield parameters as well as soil nutrients data contains, zinc, ph, nitrogen and magnesium etc., Several supervised learning predictors, which including DT, MLR and RF were also compared using regression measures.
Fuzzy logic (FL) as well as regression model [12], applied in the process of wheat crop forecasting comprises logical rules related with yield parameters and the time period of crop yield. FL outperformed other regression models in terms of yield forecast accuracy, average forecast error and MSE. Auto regression moving average (ARMA) [13], involved in the forecast of crop production, comparison also made between various time series models such as simple exponential smoothing, double exponential smoothing and damped-trend linear exponential smoothing for every district in Ghana. ARMA outperformed all other time series models and produced better forecasts of crop production in all major districts. Auto regression integrated moving average (ARIMA) [14], also involved in the forecast of rice crop production between the years 2008–2014, Ananthapur district of Andhra Pradesh (AP) for the two main rice crop seasons namely Kharif and Rabi. Forecast of rice production for upcoming four years were forecasted and produced better accuracy when compared to other existing time series models. Neural network auto regression [15], in the process of forecasting rice crop production, a mix of neural networks and auto regression is also used. Classical time series models such as double moving average and exponential smoothing also tried for yield forecasting, but neural network auto regression approach produced better forecast accuracies in terms of yield. Hybrid time series model [16], used for forecast of wheat production in the Karnal district of Haryana. Combination of ARIMA and Artificial neural network (ANN) methodology used for the wheat forecast. Comparative analysis also made between various time series models, Hybrid time series models outperformed other classical time series analysis models.
There are a number of challenges, including a lack of predictor variables in terms of environment, soil, and other management issues are still acting as challenging aspects in successful crop production forecast or estimation, according to the understanding of connected studies. Despite the use of ensemble approaches and machine learning algorithms in the agricultural yield prediction, it needs appropriate feature selection approaches and a diverse approach for better prediction. Our recommended based prediction model included most of the relevant predictor variables, feature selection methodologies and a heterogeneous strategy for agricultural production estimation.
3 Dataset
Dataset for corn and soybean crop yields is used for crop yield prediction and forecast. It contains data on crop yield performance for the past 38 years covering between 1980 and 2018 across 13 states of the USA having 105 identified corn and soybean belts [17]. The crop yield performance dataset for corn and soybeans consists of four major categories of parameters namely crop yield, management, soil and weather parameters across 28 years of 105 unified locations. In [18], the study results reveal that phenotype factors have more impact on crop production than the genotype factors. USDA-National Agricultural Statistics Service [19], provided the crop yield performance data as well as crop management practices data. Daymet [20], provided weather data. The soil parameters were obtained from the gSSURGO [21].
4 Missing Data
The corn and soybean production performance dataset has some missing numbers. In the soil data, approximately 7% of missing values can be replaced using the mean value of the same variable obtained in the adjacent belt. Around 6% of missing data values are found in crop management data, which can be replaced by mean value of the same variables found in the other belt. In weather or environmental data, no missing values are found.
5 Dimensionality Reduction and Feature Selection
The corn and soybean crop performance dataset needs some dimensionality reduction in the weather data having daily records, covering 38 years between 1980 and 2018. This leads to an enormous number of weather data that need to be used for training and testing purposes. Weather data was dimensionally reduced by using the average method, transformation of daily observations into weekly basis of 38 years, results in significant reduction in weather parameters from 2,190 to 312 trainable parameters only needed for training and produced better yield prediction accuracy.
Yield measurement data is considered a dimension of output data. The input data dimensions can be divided into a variety of components when it comes to weather, soil, and management data.
Feature selection based on correlation is one of the most effective strategies for extracting the most connected features. The anticipated yield parameter is associated with weather, soil, and management features in in our data set on corn and soybean bean. In order to obtain mostly associated parameters relating to yield, our model used pearson coefficient. Using this feature selection based on correlation technique, we are attempting to extract characteristics that are strongly associated to crop productivity. As a result, roughly 25 traits were left out since they were unrelated to crop productivity. 21 weather parameters and four crop management variables have no association with crop yield. We were able to restore the remaining related features of the corn and soybean crop in terms of crop yield according to their acceptable scores. Based on the scores of correlated variables, almost 170 elements of corn and 192 features of soybean are related to crop production.
6 Machine Learning Models in Mobile Application
For prediction challenges, machine learning regression models are commonly utilised. Our proposed study also uses regression measures such as MSE and MAE to forecast corn and soybean crop yields, as well as different machine learning regression models for crop yield prediction in relation to other meteorological, soil, and crop management parameters.
Feature selection based on correlation outperformed other feature selection strategies, achieving higher yield accuracies with other machine learning and ensemble learning models, with 270 features of corn crop and 290 features of soybean crop being the most influential features.
6.1 Multiple Linear Regression (MLR)
Numerous regression is a good fit for our model in terms of predicting crop output based on multiple variables such as management soil and weather. It uses management, weather and soil data as input variables, predicting corn and soybean crop yields as the output or target variable. It also acted as a statistical model to explore the linear relationship between independent variables and target variables.
| (1) |
Where is output or predicted yield, is input variables, is the Constant, is Independent variable coefficients and denoting Error.
6.2 Decision Tree Regression (DTR)
In order to make decisions in the form of a decision tree structure, decision tree regression is also appropriate for the prediction of crop yields in our model. The overall problem is subdivided into a number of smaller sub trees for making different decisions. Our prediction model also includes several sub trees for input variables such as weather, soil, and management parameters, which are then combined into a single decision tree for corn and soybean crop yield prediction. The conceptual structure of the decision tree as shown in Figure 1.
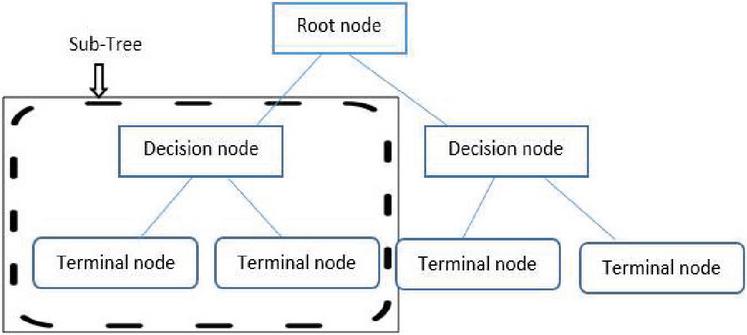
Figure 1 Schematic representation of decision tree.
6.3 Random Forest Tree Regression (RFTR)
This model closely suits our crop yield prediction. It includes multiple decision trees based on all the aspects of independent variables and its impact towards the target variable. Multiple decision trees in the form of diverse input variables such as weather, soil, and management characteristics are used in our crop production prediction model. As illustrated in Figure 2, the final crop production forecast is based on the average of all results or judgments from several decision tree.
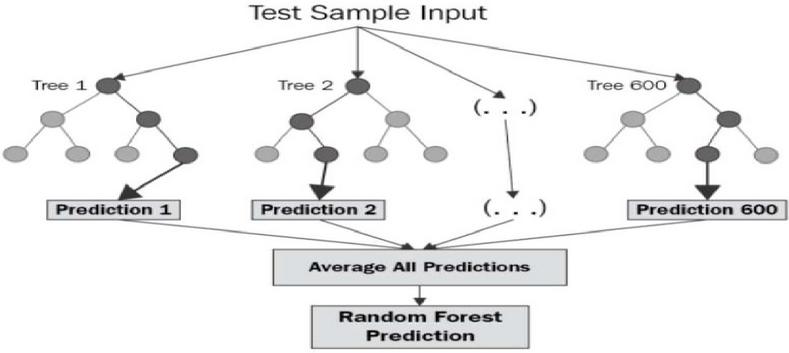
Figure 2 Schematic representation of random forest tree regression.
6.4 Gradient Boosting Regression (GBR)
This model also the most suitable technique for our crop prediction model. It comes under the category of ensemble learning technique. Sequential process of learning has been carried out in this model. Initial prediction is based on the results of the first regression model based on the knowledge gained from the initial learning, further learning is based on the subsequent results of other regression models. The final forecast is entirely based on the sum of all previous regression models’ learning experiences. In our crop yield forecast model, we take into account a variety of factors, DT will act as a regression model and produce higher accuracy of yield results compared to other regression models due to combined learning as shown in the Figure 3.
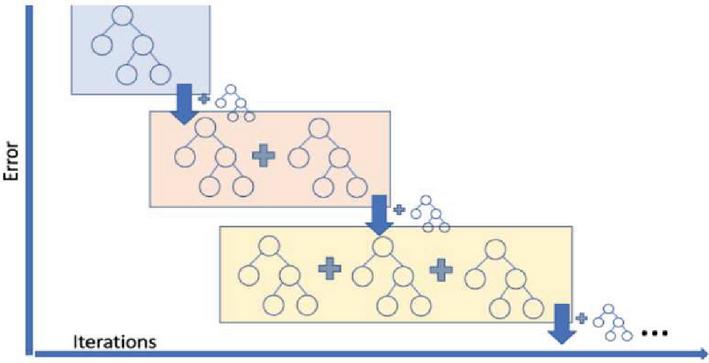
Figure 3 Schematic representation of gradient boosting regression.
7 Time Series Models in Mobile Application
Time series models play a vital role in the process of effective forecasting. Our proposed model also applied with various time series analysis for the forecast of corn and soybean production. Both univariate and multivariate time series models are also applied with our proposed model and comparative analysis made between time series models with regression accuracy parameter metrics like RMSE and MAE.
7.1 Stationary Conversion
Stationary conversion is an important process in time series models for effective forecast of crop production. Mostly time series data having seasonality and trends with continuous ups and downs of pattern over different time periods. Our crop yield performance dataset also has seasonality and trends with respect to time period and seasonality trends in weather parameters. Conversion of non-stationary to stationary time series data can be achieved through removing seasonality and trends from the original time series data. Differencing method is widely used for the conversion.
Figures 4(a) and 5(a) shows the non-stationary data representation having seasonality and trends in corn and soybean yield against years. Figures 4(b) and 5(b) shows the stationary data representation without having seasonality and trends on corn and soybean yield against years.
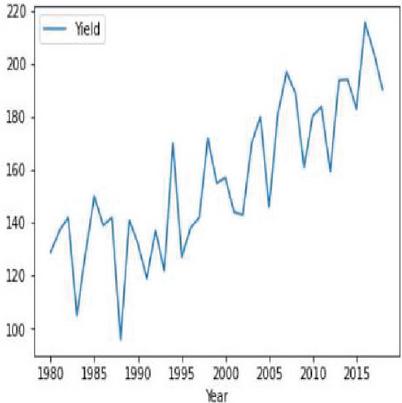
Figure 4(a): Yearly representation of corn crop yield.
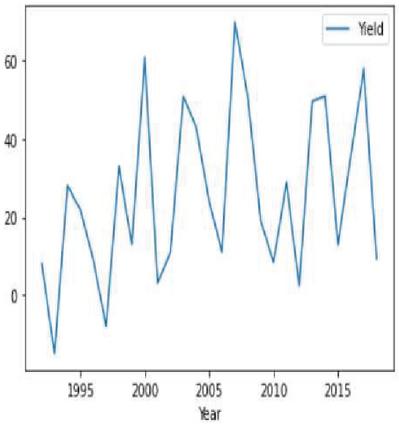
Figure 4(b): Stationary corn crop yield representation year wise.
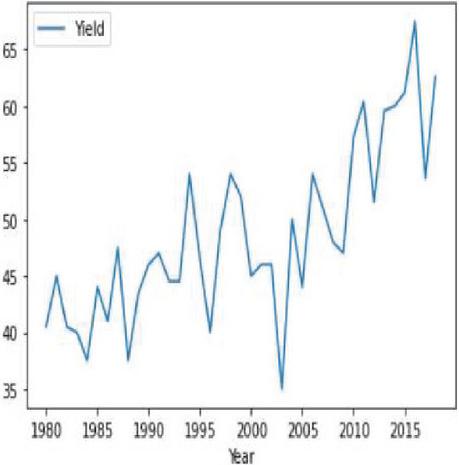
Figure 5(a): Yearly representation of soybean crop yield.
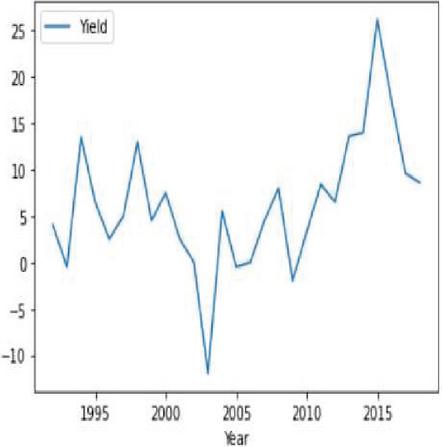
Figure 5(b): Stationary soybean crop yield representation year wise.
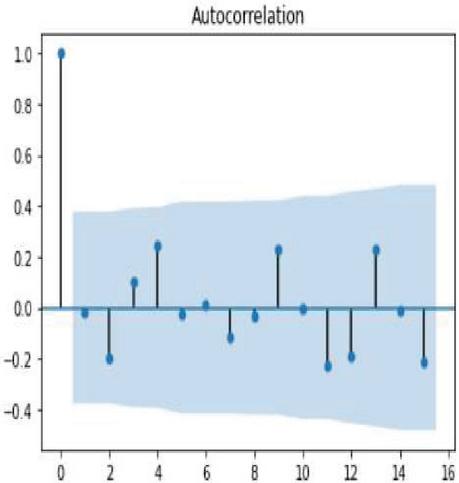
Figure 6 Autocorrelation of corn crop yield.
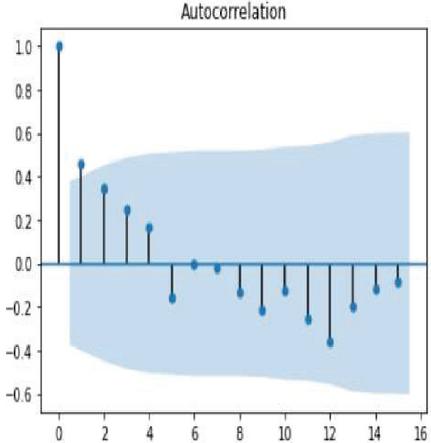
Figure 7 Autocorrelation of soybean crop yield.
7.2 Autocorrelation
Autocorrelation is the process of feature selection in time series forecasting in order to retrieve the most correlated features with respect to target or output variable. Correlogram is also termed as line plot in the autocorrelation graph which indicates correlation of each and every observation is statistically significant or not. Figures 6 and 7 shows the line plot representation of autocorrelation of corn and soybean crop yield. The lag observations are represented on the x axis, while positive and negative correlated observations are represented on the y axis. The line plot above the blue shaded area denotes positive significance and the line plot below the shaded area denotes negative significance.
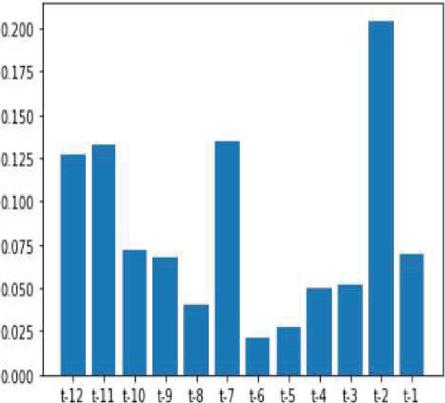
Figure 8 Feature importance score of corn yield.
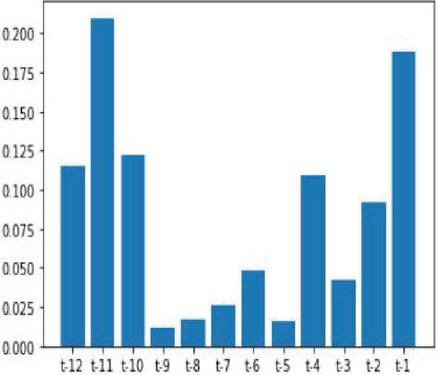
Figure 9 Feature importance score of soybean yield.
7.3 Feature Importance
Correlation based feature selection is alone not a sufficient method for efficient extraction of feature selection for forecasting. Feature importance also equally plays a vital role in the extraction of features based on correlation and also includes observation based on timestamp, moving average and much more statistical methods. Feature importance method effectively retrieves the features based on the importance scores. There are various ensemble learning regressions used in feature importance processes namely Random forest regression (RFR), GBR and Extra tree regression (ETR). Our corn and soybean crops forecast models used RFR for feature importance process and it outperformed other ensemble regressions. Figures 8 and 9 denote the feature importance scores of corn and soybean crops against different time lag observations.
7.4 Feature Selection
The process of extracting the most relevant features is known as feature selection. It’s not only based on the correlation but also includes extracting the other relevant features based on the smallest weight factors and pruning methods are recursively involved in the extraction of features process also termed as recursive feature selection (RFS). Figures 10 and 11 shows bar graph representation of feature selection crops yield based on smallest weight factors.

Figure 10 Feature selection rank on corn crop yield.
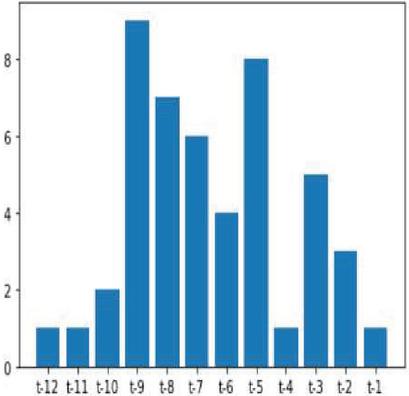
Figure 11 Feature selection rank on soybean crop yield.
8 Methodology and Related Works
Machine learning regressions are used for yield prediction and time series analysis is used for yield forecasting are used in our model. The corn and soybean crop productivity performance dataset, collected across 105 corn and soybean belts between 1980 and 2018, includes phenotypic components such as soil, crop management, and climatic information. Weather parameters consist of six component values collected for 52 weeks in a year wise, totally 312 weather parameters used for training purposes. Soil data consist of 10 components collected at different depths, totally 104 soil parameters used for training purposes. Crop management data consist of 16 components collected at different terms of week used in crop dataset. Overall there are 434 and 432 input parameters for crop yield dataset. Figure 12 demonstrates the framework for crop yield prediction and forecast of corn and soybean crops. Yield dataset from various sources with appropriate machine learning regression as well as time series modelling, final crop yield prediction and forecast of corn and soybean can be done.
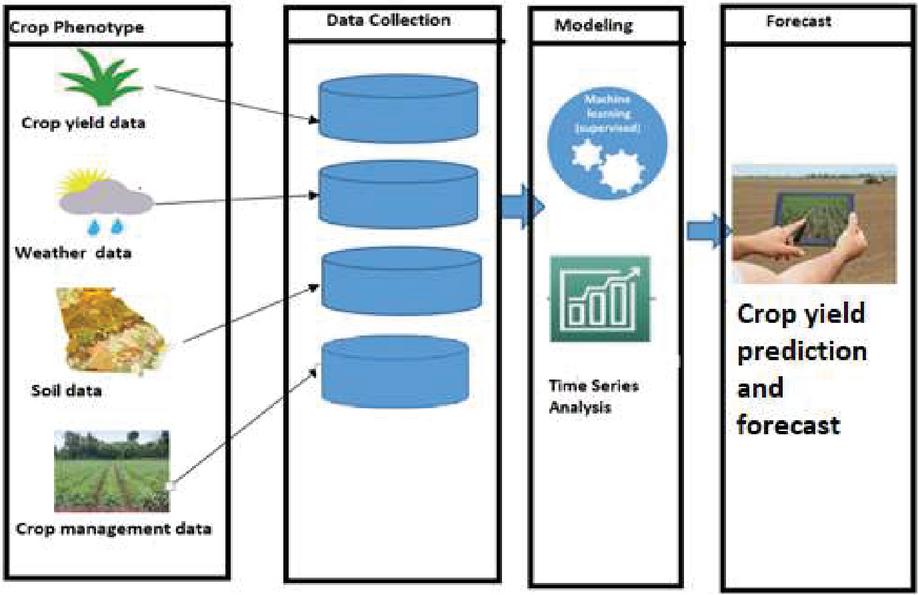
Figure 12 Frame work for crop yield prediction and forecast.
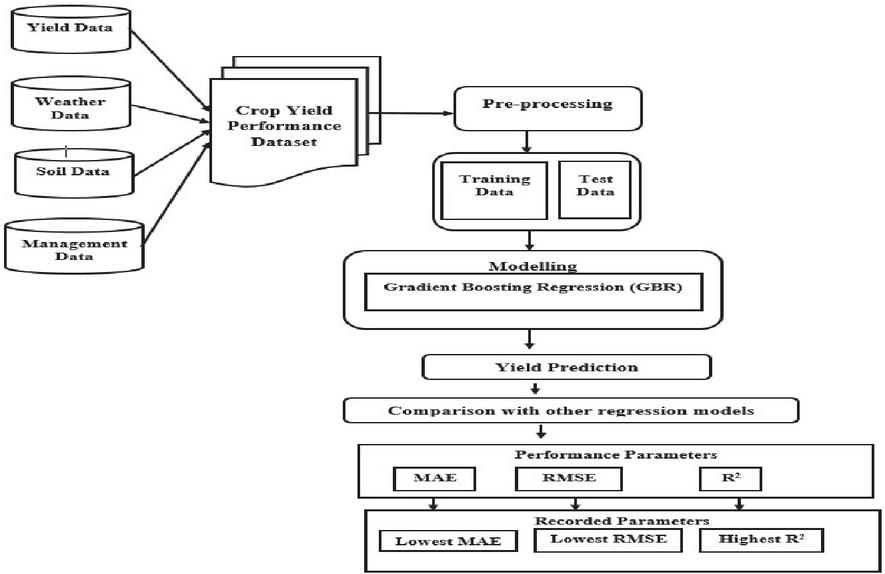
Figure 13 Work flow diagram of crop yield prediction.
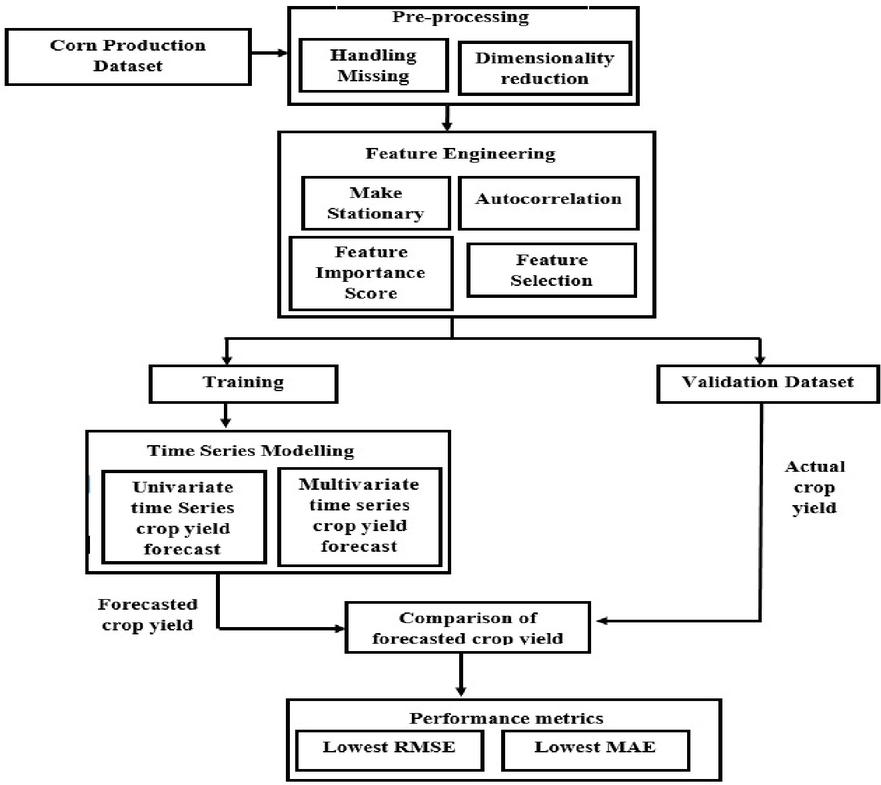
Figure 14 Work flow diagram of crop yield forecasting.
Figures 13 and 14 clearly depicts the complete work flow process of the entire corn and soybean crop yield prediction and forecast. Crop yield, crop management, soil and weather data are among the four types of phenotype data collected in the data collection section. Pre-processing process involved in the yield dataset in terms of filling missing entities in the soil and crop management parameters by mean method. Dimensionality reduction was also carried out in the weather parameters in terms of weekly conversion in the ratio of 365:52. Feature engineering processes used in the yield forecasting in terms of conversion of stationary data, finding autocorrelation, feature importance and feature selection can be carried out in the feature engineering process. Modelling in crop yield prediction can be done through GBR for prediction of corn and soybean crop yield and comparative analysis also made between other regression models with regression accuracy parameter metrics. Modelling in crop yield forecast can be done through various univariate and multivariate time series modelling techniques for effective forecast and comparative analysis also made between time series models with regression metrics.
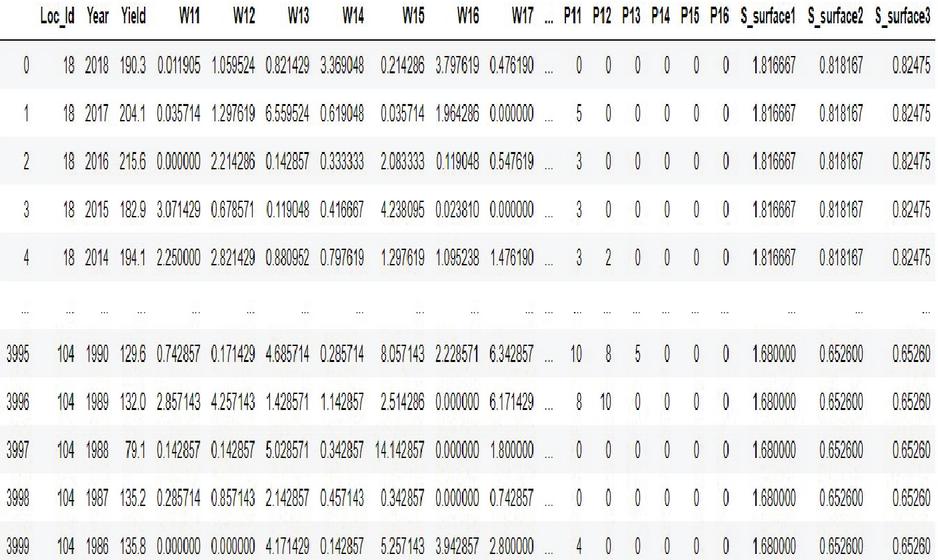
Figure 15 Crop yield performance dataset conceptual representation.

Figure 16(a): Corn crop yield distribution.

Figure 16(b): Soybean crop yield distribution.
9 Results and Discussion
Our crop yield forecasting and prediction model is written in Python, with tensor flow as the backend and keras as the frontend. Soil, crop management, and meteorological information are included in a crop yield performance dataset gathered from multiple sources. The crop dataset for corn and soybeans consists of four major categories of parameters namely crop yield, soil, crop management and weather parameters across 38 years of 105 unified locations. Each category of input data consists of multiple dimensions already discussed in the methodology section. Weather data was dimensionally reduced by transforming daily observations to weekly constraints of 38 years by the mean method, results in significant reduction in weather parameters from 2,190 to 312 trainable parameters only needed for training and produced better yield prediction accuracy. Figure 15 clearly depicts the crop yield performance dataset conceptual representation and its dimensions. Overall there are 434 and 432 input parameters for crop yield dataset. Figures 16(a) and 16(b) clearly shows the yield distribution of both crops across the years. Figures 17(a) and 17(b) shows the distribution of yield, weather and year of both the crops across the dataset.
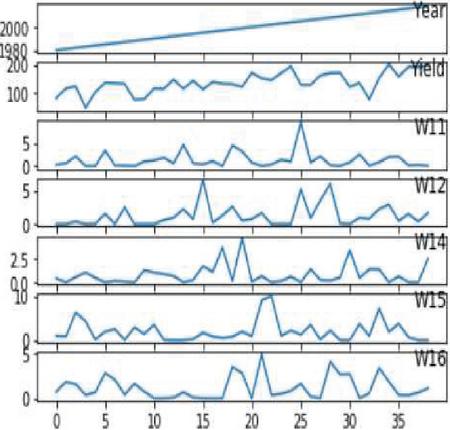
Figure 17(a): Data on corn crop distribution based on weather, yield, and year.
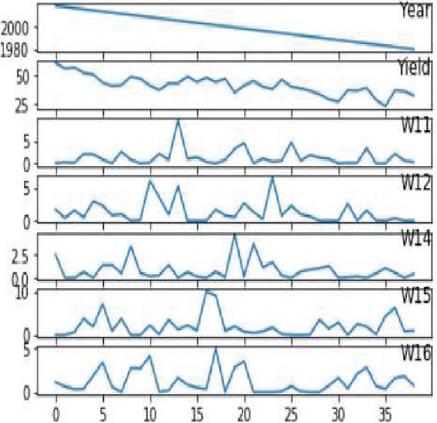
Figure 17(b): Data on soybean crop distribution based on weather, yield, and year.
9.1 Multiple Linear Regression
This is used to predict the yields of both crops using multiple input parameters namely soil, crop management and weather parameters and finally target or output variable i.e. yield prediction with respect to all input parameters with appropriate Sklearn linear regression libraries along with suitable prediction method. Figures 18(a) and 18(b) shows a comparison graph between real and anticipated yield in both the crops.
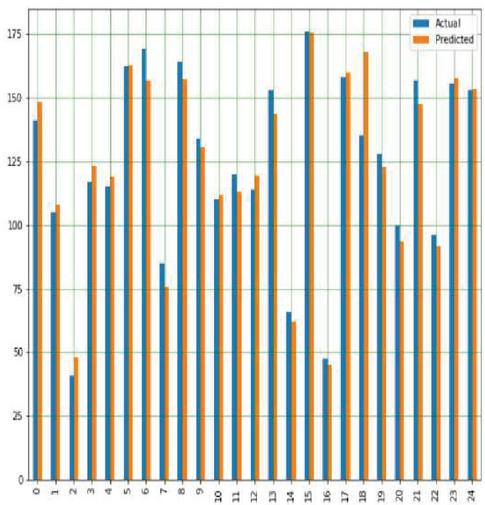
Figure 18(a): Comparison between real and anticipated yield in corn crop using MLR.
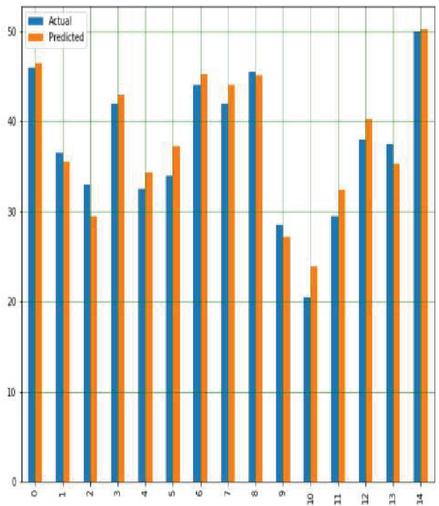
Figure 18(b): Comparison real and anticipated yield in soybean crop using MLR.
9.2 Decision Tree Regression
Using a variety of input data, DTR is used to estimate corn and soybean crop yields, including soil, crop management and weather parameters, as well as a target or output variable. It also works well with our crop yield prediction model because it allows us to make judgments using a decision tree structure. Yield prediction with respect to all input parameters with appropriate Sklearn linear regression libraries along with suitable prediction methods. Figures 19(a) and 19(b) shows a graph comparing actual and expected crop yields in corn and soybean crops.
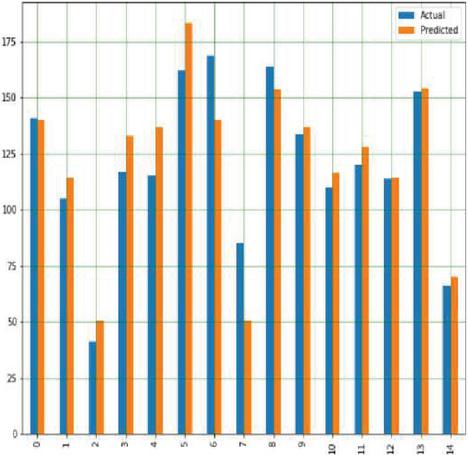
Figure 19(a): Comparison between real and anticipated yield in corn crop using DTR.
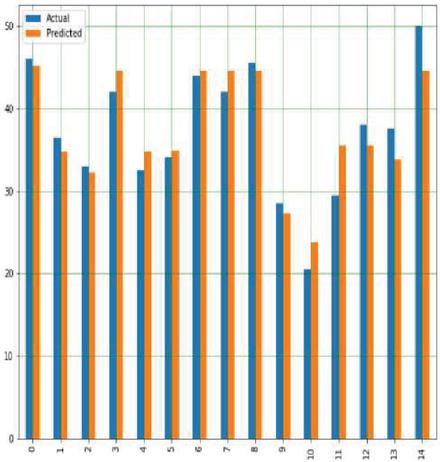
Figure 19(b): Comparison between real and anticipated yield in soybean crop using MLR.
9.3 Random Forest Tree Regression
With a variety of input data, RFTR is used to estimate corn and soybean crop yields, including soil, crop management and weather parameters, as well as a goal or output variable. The final crop production projection is based on the average of all decision tree outputs or decisions. Yield prediction with respect to all input parameters with appropriate Sklearn linear regression libraries along with suitable prediction methods. Figures 20(a) and 20(b) shows comparison graph real and anticipated crop yield in corn and soybean crops.
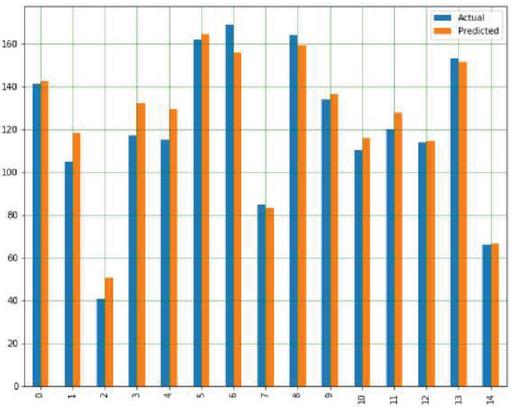
Figure 20(a): Comparison between real and anticipated yield in corn crop using RFTR.
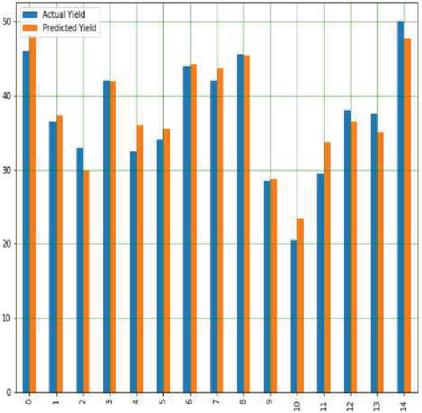
Figure 20(b): Comparison between real and anticipated yield in soybean.
9.4 Gradient Boosting Regression
GBR is a model that estimates corn and soybean crop yields based on a set of input elements, such as soil, climatic and crop management, as well as a target or output variable. The final forecast is entirely based on the sum of all previous regression models’ learning experiences. Yield prediction with respect to all input parameters with appropriate Sklearn linear regression libraries along with suitable prediction methods. Figures 21(a) and 21(b) shows comparison graph between ground truth and anticipated crop yield in both the crops.
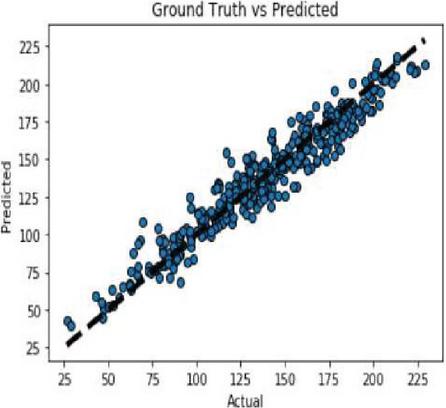
Figure 21(a): Comparison between real and anticipated yield in corn crop using GBR.
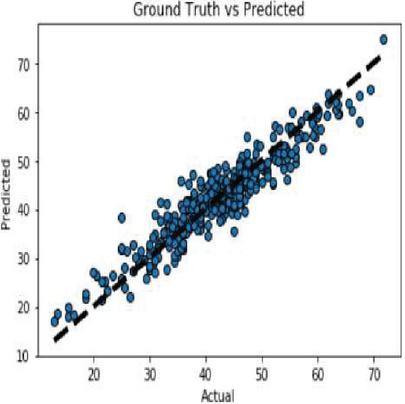
Figure 21(b): Comparison between real and anticipated yield in soybean crop using GBR.
9.5 Auto Regression
Auto regression is one of the popular univariate time series models for forecasting crop production. Crop year will act as the input variable and forecasted crop yield will be acted as a target variable. It takes a previous time stamp for the next forecast, the previous year crop yield will be taken as the input for forecasting the next year crop yield of corn and soybean. Figures 22(a) and 22(b) indicates the graphical representation of real versus predictions of corn and soybean crop yield. Figures 23(a) and 23(b) depicts corn and soybean crop forecasted for future seven years.
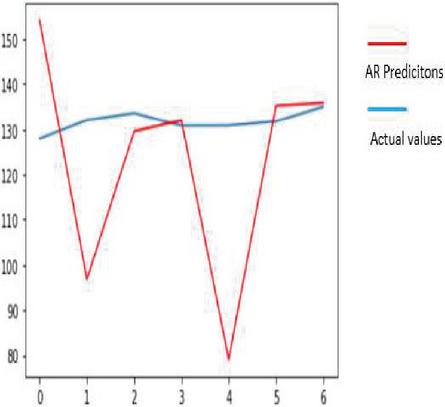
Figure 22(a): Actual Vs Prediction on corn crop of AR.
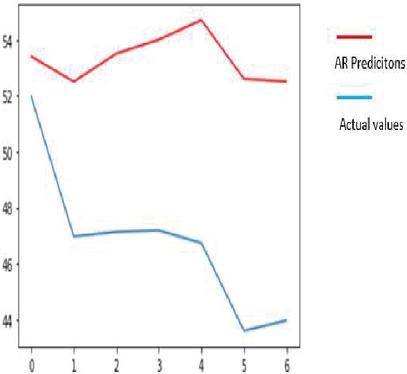
Figure 22(b): AR Actual Vs Prediction on soybean crop of AR.
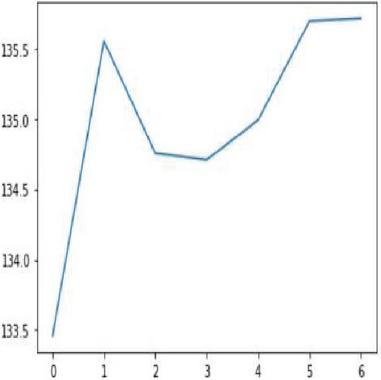
Figure 23(a): AR yield forecast on seven years on corn crop.

Figure 23(b): AR yield forecast on seven years on soybean crop.

Figure 24(a): Corn yield representation against year.
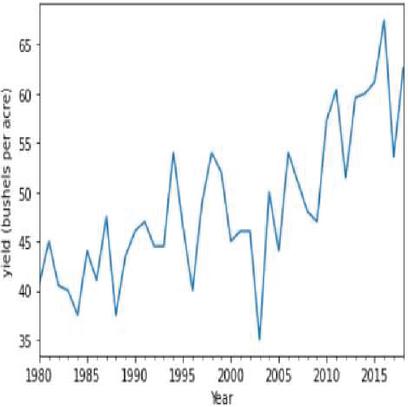
Figure 24(b): Soybean yield representation against year.
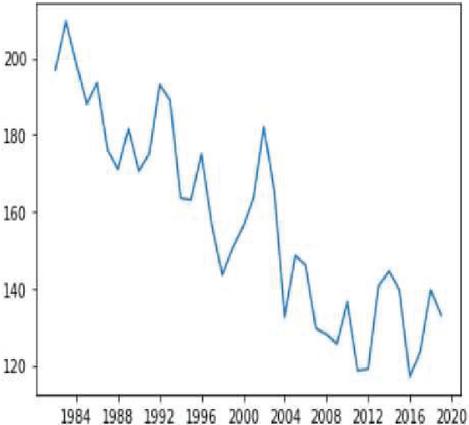
Figure 25(a): Moving average corn yield representation.
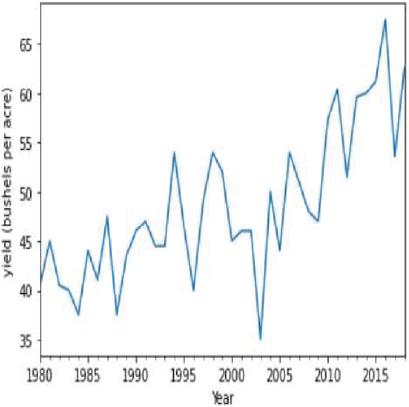
Figure 25(b): Moving average soybean yield representation.
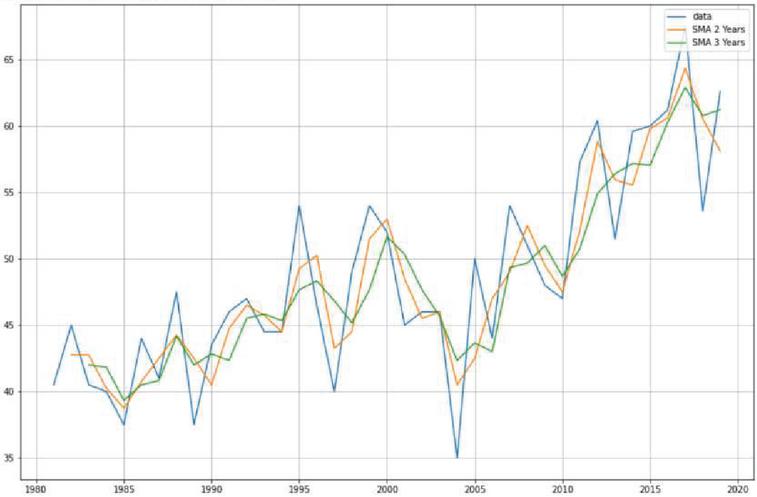
Figure 26(a): MA forecast on corn yield.
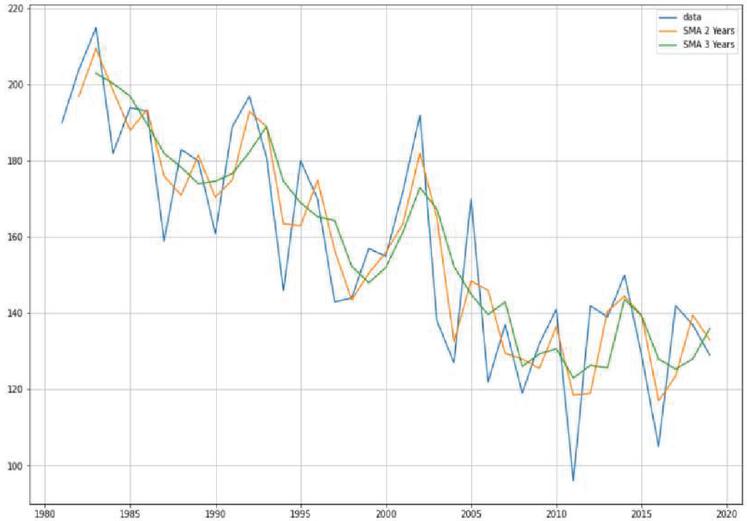
Figure 26(b): MA forecast on soybean yield.
9.6 Moving Average
Moving average is one of the popular univariate time series models for forecasting crop production. Crop year will act as the input variable and forecasted crop yield will be acted as a target variable. It takes previous timestamp as well as average error for the next forecast, the previous year crop yield will be taken as the input for forecasting the next year crop yield of both the crops. Figures 24(a) and 24(b) indicates the graphical representation of corn, soybean yield across years and soybean crop yield. Figures 25(a) and 25(b) shows the moving average of corn and soybean crop yield across years. Figures 26(a) and 26(b) shows corn and soybean crop forecasted for future years.
9.7 Auto Regression Integrated Moving Average
ARIMA is one of the popular univariate time series models for forecasting crop production. Crop year will act as the input variable and forecasted crop yield will be acted as a target variable. It takes previous timestamp as well as average error of previous time stamp for the next forecast, the previous year crop yield will be taken as the input for forecasting the next year crop yield of both the crops. Figures 27(a) and 27(b) shows the corn and soybean crop yield forecast.
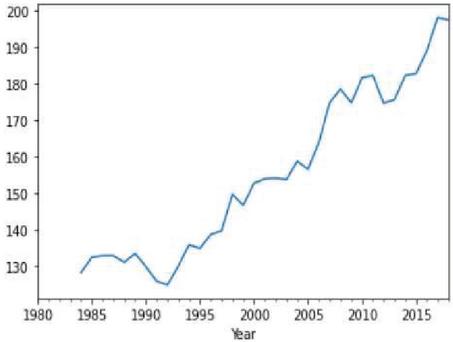
Figure 27(a): ARIMA forecast on corn crop.
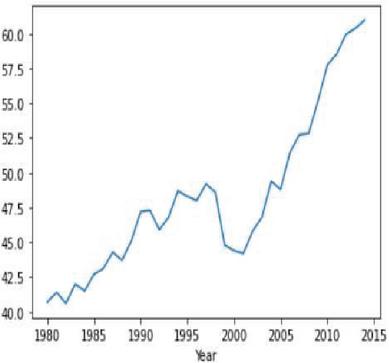
Figure 27(b): ARIMA forecast on soybean crop.
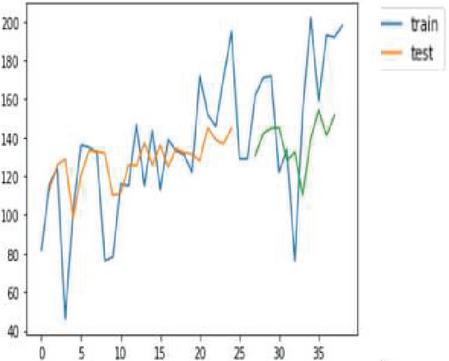
Figure 28(a): VAR forecast on corn crop.
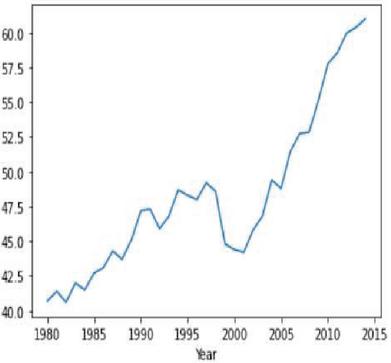
Figure 28(b): VAR forecast on soybean crop.

Figure 29 Performance representation of time series models.
9.8 Vector Auto Regression
VAR is one of the popular multivariate time series models for forecasting crop production. Crop year, soil, crop management and weather parameters will act as the input variable and forecasted crop yield will be acted as a target variable. Forecast of crop yield will be based on the previous year timestamp along with their other input parameters of that time stamp will be used for forecasting. Figures 28(a) and 28(b) shows the forecasted corn and soybean crop production using VAR. Figure 29 clearly demonstrates VAR outperformed other time series models with least RMSE values.
10 Conclusion
Crop yield prediction and forecast plays a predominant role in global food supply chain management. Effective crop yield prediction and forecast provide balance between import and export of food products across the globe. Our mobile application based crop yield prediction and forecast model applied with machine learning regressions for yield predictions and time series analysis for corn and soybean yield forecasting. By using our mobile application, farmers can easily able to predict and forecast the crop yield based on the input of historical crop data of past years. The role of machine learning models used in the mobile application is to predict the crop yield based on the training of past crop yield data and the role of time series models used in the mobile application is forecast the future crop yield based on the past time series information about the crop yield. GBR outperformed all other machine learning regressions with 92.648% yield accuracy. VAR outperformed all other classical time series models with 94.367% forecasted yield accuracy with regression metrics of RMSE, MSE and MAE.
In the future, crop yield prediction models could be validated using deep learning models, with estimates based mostly on observations of yield pattern changes over time. Adding genotype characteristics to existing phenotype features in the crop yield performance dataset, as well as finding the most significant and non-significant genotype parameters for improved crop yield prediction, is still a research challenge.
References
[1] Torky, Mohamed, Hassanein, Aboul Ella: Integrating blockchain and the internet of things in precision agriculture: Analysis, opportunities, and challenges. Computers and Electronics in Agriculture 178, 0168-1699, 2020.
[2] Ampatzidis, Yiannis, Partel, Victor, Costa, Lucas: Agroview: Cloud-based application to process, analyze and visualize UAV-collected data for precision agriculture applications utilizing artificial intelligence. Computers and Electronics in Agriculture 174, 105457, 2020.
[3] Pandiyaraju, V., Logambigai, R., Ganapathy, Sannasi, Kannan, Arputharaj: An Energy Efcient Routing Algorithm for WSNs Using Intelligent Fuzzy Rules in Precision Agriculture. Wireless Personal Communications, 1–17, 2020.
[4] Jung, Jinha and Maeda, Murilo and Chang, Anjin and Bhandari, Mahendra, Ashapure, Akash, Landivar-Bowles, Juan: The potential of remote sensing and artificial intelligence as tools to improve the resilience of agriculture production systems. Current Opinion in Biotechnology 70, 15–22, 2020.
[5] Zhang, Shanwen, Huang, Wenzhun, Wang, Haoxiang: Crop disease monitoring and recognizing system by soft computing and image processing models. Multimedia Tools and Applications 79(41), 30905–30916, 2020.
[6] Iniyan S., Jebakumar R., Mangalraj P., Mohit Mayank, Nanda Aroop: Plant Disease Identification and Detection Using Support Vector Machines and Artificial Neural Networks. In: Subhransu Sekhar Dash, Lakshmi C, Swagatam Das, Bijaya Ketan Panigrahi (eds.) Artificial Intelligence and Evolutionary Computations in Engineering Systems 2020. AISC, vol. 1056, pp. 15–27. Springer, 2020.
[7] Ishfaq Ahmad, Asmat Ullah, M. Habib ur Rahman, Jasmeet Judge: Yield Forecasting of Spring Maize Using Remote Sensing and Crop Modeling in Faisalabad-Punjab Pakistan. Journal of the Indian Society of Remote Sensing. 46(10), 1701–1711, 2018.
[8] Phusanisa Charoen-Ung, Pradit Mittrapiyanuruk: Sugarcane Yield Grade Prediction using Random Forest with Forward Feature Selection and Hyper-parameter Tuning. Herwig UngerSunantha SodseePhayung Meesad (eds.) IC2IT: International Conference on Computing and Information Technology (2018), AISC, vol. 769, pp. 33–42, 2018.
[9] Xiangying Xu, Ping Gao, Xinkai Zhu, Wenshan Guo, Jinfeng Ding, Chunyan Li, Min Zhu, Xuanwei Wu: Design of an integrated climatic assessment indicator (ICAI) for wheat production: A case study in Jiangsu Province, China. Ecological Indicators 101, 943–953, 2019.
[10] Patrick Filippi, Edward J. Jones: An approach to forecast grain crop yield using multi-layered, multi-farm data sets and machine learning. Precision Agriculture 20, 1015–1029, 2019.
[11] Louis Kouadio, Ravinesh C. Deo, Adamowski : Artificial intelligence approach for the prediction of Robusta coffee yield using soil fertility properties. Computers and Electronics in Agriculture 155, 324–338, 2018.
[12] Bindu Garg, Shubham Aggarwal, Jatin Sokhal: Crop yield forecasting using fuzzy logic and regression model. Computers and Electrical Engineering 67, 383–403, 2018.
[13] Askar Choudhury, James Jones: Crop Yield Prediction Using Time Series models. Journal of Economic and Economic Education Research, Volume 15, Number 3, 2014.
[14] P. Chandra shaker reddy and Sureshbabu: An applied time series forecasting model for yield prediction of agricultural crop. Soft Computing and Signal Processing: Proceedings of 2nd ICSCSP 2019.
[15] Bhardwaj N., Jaslam, P. K. M., Bhatia, J. K. Parashar, B. Salinder: Neural Network Autoregression And Classical Time Series Approaches For Rice Yield Forecasting. JAPS: Journal of Animal & Plant Sciences. Aug, Vol. 31 Issue 4, pp. 1126–1131, 2021.
[16] Monika Devi, Joginder Kumar, D.P. Malik, Pradeep Mishra: Forecasting of wheat production in Haryana using hybrid time series model. Journal of Agriculture and Food Research 5, 100175, 2021.
[17] Saeed Khaki, Lizhi Wang, Sotirios V. Archontoulis: A CNN-RNN Framework for Crop Yield Prediction. Frontiers in Plant Science 10, 1750, 2020.
[18] Saeed Khaki and Lizhi Wang: Crop Yield Prediction Using Deep Neural Networks. Frontiers in Plant Science 10, 621, 2019.
[19] USDA – National Agricultural Statistics Service Available at: https://www.nass.usda.gov/
[20] Thornton, P., Thornton, M., Mayer, B., Wei, Y., Devarakonda, R., Vose: Daymet: Daily Surface Weather Data on a 1-km Grid for North America, Version 3. (ORNL Distributed Active Archive Center). doi: 10.3334/ORNLDAAG/1328
[21] Soil Survey Staff. Gridded Soil Survey Geographic (gSSURGO) Database for the United States of America and the Territories, Commonwealths, and Island Nations served by the USDA-NRCS (United States Department of Agriculture, Natural Resources Conservation Service). https://gdg.sc.egov.usda.gov/.
Biographies

S. Iniyan received a Bachelor’s degree in Computer Science and Engineering from Bharathiyar College of Engineering and Technology, Pondichery University in 2010 and a Master’s degree in Computer Science and Engineering from Sriram Engineering College of Anna University, Chennai in 2012. He is currently an Assistant Professor in the Department of Computer Science and Engineering and pursuing his Ph.D. degree at SRM Institute of Science and Technology, Chennai, India.

R. Jebakumar received a Master’s degree in Computer Science and Engineering from the Sathyabama University, Chennai in 2005. He obtained his Ph.D. degree in the area of Information and Communication Engineering from Anna University Chennai in 2015. He is currently an Associate Professor in the Department of Computer Science and Engineering at SRM Institute of Science and Technology, Chennai, India, Working here since 2006.
Journal of Mobile Multimedia, Vol. 18_3, 603–634.
doi: 10.13052/jmm1550-4646.1837
© 2022 River Publishers