Automatic Classification of Pararubber Trees in Thailand from LANDSAT-8 Images Using Neural Network Method
C. Supunyachotsakul1,* and N. Suksangpanya2
1Department of Civil Engineering, Faculty of Engineering, King Mongkut’s Institute of Technology Ladkrabang, Bangkok, Thailand
2School of Geoinformatics, Institute of Science, Suranaree University of Technology, Nakhon Ratchasima, Thailand
E-mail: chisaphat.su@kmitl.ac.th; nobphadon@g.sut.ac.th
*Corresponding Author
Received 25 September 2019; Accepted 10 February 2021; Publication 18 June 2021
Abstract
Classifying features from satellite images has been a time-consuming manual process which requires lots of manpower. This work exploits deep convolutional encoder-decoder neural network to develop an algorithm that can automatically classify the extents of the Pararubber tree-growing areas from the LANDSAT-8 images. The ground truth of the areas of the Pararubber tree was manually prepared and was separated into training datasets and the validation datasets. The classification model from this approach obtained using the training datasets was verified with the classification accuracy of70.90%, precision of 67.66%, recall of 80.80%, and F score of 73.59%.
Keywords: Feature classification, machine learning, neural network, satellite image.
1 Introduction
Pararubber tree is one of the economic plants in Thailand and many industrial products are made of rubbers. To ensure enough supplies of rubbers to feed the production line of the industries and to maintain the sustainability of the rubber trees cycles, monitoring the extents of the Pararubber tree-growing areas is required. Since, in general, the Pararubber tree-growing areas in Thailand are extensive, an efficient monitoring approach must be used to facilitate monitoring purpose. Nowadays, satellite images have been used for monitoring the extents of the Pararubber tree-growing areas. Satellite images serve as the basic data for analysts to extract the required information about the extents of the Pararubber tree-growing areas. Analysts use many different methods to extract the required information from the satellite images. The method of extracting information from the satellite images can be categorized into three different approaches based on the automation level. Those are (1) the manual approach, of which the extraction process is operated by the analyst and it is not automation involved in the process of information or feature extractions, (2) the semi-automatic approach, of which the extraction process is performed by both human (analyst) and developed computer algorithms, and (3) the automatic approach, of which the extraction process is solely performed by developed computer algorithms without the human intervention during the extraction process.
As mentioned earlier that the Pararubber tree-growing areas in Thailand are extensive, extracting Pararubber extents from the satellite images with the manual approach is very time-consuming. However, it was the approach which has been employed by the government entity named Rubber Authority of Thailand of which one of their duties is to quantify and report the information about the extents of Pararubber tree-growing area. For this duty, the feature or the information that of interest in the satellite images are the areas and the places on the images those are Pararubber trees. If the Pararubber tree-growing areas can be distinguished and identified on the images, the extents of them can be achieved. Obtaining the information about the extents of Pararubber tree-growing areas is very important for the prediction of yields and important for other related economic activities, as well; the process of obtaining this information should not be too time-consuming till it declines the value of this information. The main objective of this project is to develop a machine-learning-based computer algorithm that can automatically classify the extents of Pararubber tree-growing area and extract out that information from the LANDSAT-8 satellite images. In this work, a machine learning method called “deep convolutional encoder-decoder neural network (DCED)” is applied to develop an automatic algorithms/procedure that helps identify extents of the Pararubber tree areas in Thailand.
2 Related Theory and Works
Machine learning is a subsection of the artificial intelligence (AI) technology. The basis of the machine learning technique is to incorporate the use of computational algorithms into the machine’s processing unit in order that the machine (computer) can learn how to detect or identify some specific data patterns without having to follow a pattern of rules or predefined models. The machine can perform the learning process by four different learning approaches; those are (1) supervised learning, (2) unsupervised learning, (3) reinforcement learning, and (4) deep learning.
There are many studies related to the use of satellite images for identifying and classifying the extents of Pararubber tree-growing areas, e.g., [1–12]. Those works have differences in many aspects. Not only that they used different satellite images from different sensors and platform, but they also used different methods in Pararubber tree detection/identification/classification process.
There are many attempts on developing an automatic approach for classifying features from satellite images by using machine learning technique with deep learning method. For the process of classifying/identifying the extents of Pararubber tree-growing areas from the satellite images that make use of the machine learning techniques, there are many interesting works as follows. Reference [7] studied the impact of the landuse/landcover (LULC) changes in the carbon stocks (carbon dynamics) of the ecosystems in Xishuangbanna in the southwest region of China. They studied the changes of LULC spanned over the duration of 27 years on the LANDSAT images by using LULC classification method based on maximum likelihood classifier. Similar to the work of [5, 7] used maximum likelihood classifier to classify 10 types of LULC from the LANDSAT-5 images covered the areas of Xishuangbanna in the southwest region of China. Pararubber tree is one of the 10 LULCs that were classified in this study. Reference [5] used high-resolution images (Quickbird) for verifying the accuracy of the developed classification process. Reference [2] combined the use of Mahalanobis classifier and the technique of multi-layer perceptron (MLP) neural network for classifying the extents of Pararubber tree-growing areas from the satellite images taken from the ASTER sensor of the Terra platform over the area of Thai-Laos border and Sino-Laos border (China-Laos border). Similar to the work of [2, 3] performed the classification of Pararubber trees with the Mahalanobis classifier by using the non-thermal reflective bands, normalized difference vegetation index (NDVI), and data from the tasseled cap transformation as the input of the classifier. Reference [1] performed the classification of Pararubber trees from the satellite images taken from the MODIS sensor of the Terra platform over some areas of China and South East Asia countries (Thai, Laos, Vietnam, Cambodia, and Myanmar). They use many other related statistical data such as NDVI obtained from the MODIS time-series data as the input of the Mahalanobis classifier. With their method, the Pararubber tree overestimation problem which happened in [2] and [3] was eliminated.
In 2015, a neural network method called DCED method was developed [13], which helps reduce the number of parameters within the network to in comparison with the deconvolution network method [14] which has parameters. Moreover, the efficiency of the DCED method was proven to be higher than the deconvolution network method [15]. Thus, this work adopts the DCED method to develop an algorithm that can automatically classify an interesting feature from satellite images which are Pararubber trees and LANDSAT-8 images, respectively.
In the hidden layers within the DCED neural network in this study, the exponential linear unit (ELU) function is used as an activation function. The ELU was shown that it can yield convergence more efficiently and can give higher accuracy in comparison with other functions such as ReLU, leaky ReLU, and PReLU [16].
3 Dataset
The procedure of the neural network includes two main parts which are training and classification. In the satellite image, the training procedure allows the machine to learn how to distinguish one feature from others by using ground truth, i.e., reference dataset of which those features are known, together with its corresponding satellite image. Another procedure is classification which uses the output from the training procedure to let the machine automatically predict the features from the satellite images. Therefore, the datasets used in this study are categorized into two main parts which are the satellite images and the ground truth.
3.1 Satellite Images
This work uses two scenes of LANDSAT-8 satellite images covering two areas of Thailand as shown in Figure 1. Scene-1 was taken on February 13th, 2018, 03:36am GMT at path-129 and row-048. Scene-2 was taken on April 9th, 2018, 03:43am GMT at path-130 and row-050. The images of both scenes were pan-sharpened to increase the resolution to 15m and were orthorectified to remove geometric distortions. These areas were chosen because there are many areas with Pararubber tress.
A small patch within each scene as shown in Figure 1 was chosen to be images for the training datasets where the areas of Pararubber trees and non-Pararubber trees are known. These small patches are called Training#1 dataset and Training#2 dataset. The Training#1 dataset is mostly covered by Pararubber tree areas, while the Training#2 dataset is mostly green forest that is not Pararubber trees.
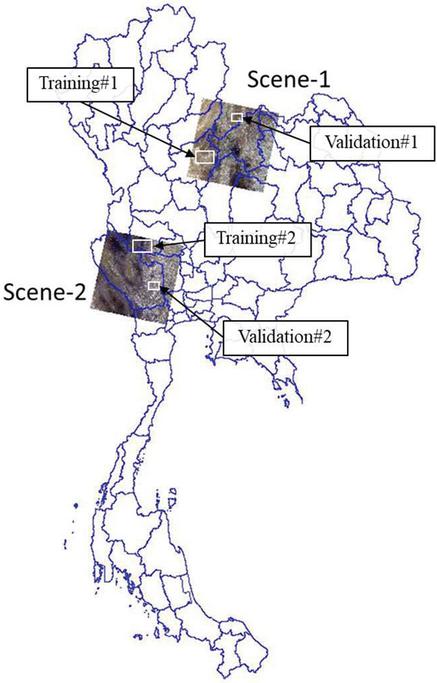
Figure 1 LANDSAT-8 satellite images of Scene-1 and Scene-2 over the kingdom of Thailand and the locations of the Training#1, Training#2, Validation#1, and Validation#2 datasets.
3.2 Ground Truth
In this work, ground truth specifies the known areas with and without Pararubber trees which were classified using the manual method, i.e., using human experts on classifying the areas Pararubber tree, to assure the feature types with the images. The areas of ground truth cover the small patches in Training#1, Training#2, Validation#1, and Validation#2 datasets. The Training#1 and Training#2 datasets, shown in Figure 2(a) and 2(b), are used together with the training images as the training datasets for the training procedure. On the other hand, the Validation#1 and Validation#2 datasets are used for assessing the validity of the model.The ground truth is stored as shapefiles in which includes the areas of Pararubber tree feature and non-Pararubber tree feature corresponding with their satellite images.
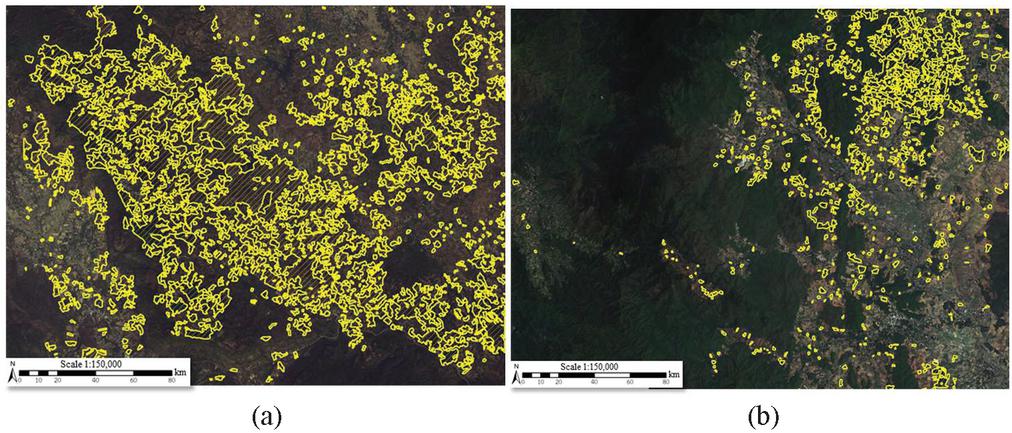
Figure 2 LANDSAT-8 image with true colors and ground truth of Pararubber tree areas of (a)Training#1 dataset and (b) Training#2 dataset.
4 Methodology
The automatic classification algorithm in this work was developed by using Python language with the training and the classifying procedures of the automatic classification algorithm are explained as follows.
In the training procedure, the input of the algorithm is the training dataset which includes a satellite image in GeoTIFF format and a ground truth specifying Pararubber tree areas in shapefile format. Initially, the algorithm will randomly crop a small patch of pixels from the image with the batch size of 24 and 100 batches per epoch. In the DCED method, there are 13 encoder layers and13 decoder layers for feature extraction by using the ELU function [16] as an activation function. Finally, the classification layer of the algorithm will provide the binary class distributing over all pixels of the image to create a pixel-wise class prediction map. The output in the training procedure is a trained model. The trained model can be updated as many times as the user needs in case of any newly available ground truth.
In the classifying procedure, the input datasets are the trained model from the training procedure and LANDSAT-8 image(s) that will be classified. The output of the algorithm is the areas of Pararubber tree in the input image(s).
5 Results and Discussions
The ground truth with its corresponding satellite image in the Training#1 dataset and Training#2 dataset was used in the training procedures to create a trained model by DCED method. The trained model was then used to classify the areas of Pararubber tree and non-Pararubber tree in Scene-1 and Scene-2 which contain Training#1 and Training#2, respectively. The results are as follows.
In Scene-1, the predicted results of the Pararubber tree areas (grey) in a small region covering the Training#1 dataset are shown in Figure 3(a) together with the ground truth of Pararubber tree areas (yellow). The results show that most of the classified area is overlapped with the ground truth. The predicted results in Scene-2 as shown in Figure 3(b) also show similar corresponding between the classified Pararubber tree areas and the ground truth which shows that the algorithm can distinguish the Pararubber trees from the green forest.
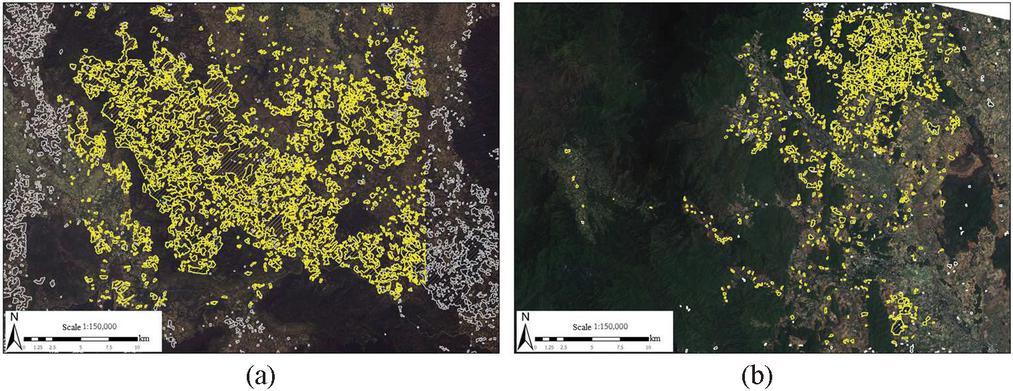
Figure 3 Predicted(gray) and ground truth (yellow) of Pararubber tree areas over regions of (a) Training#1 dataset and (b) Training#2 dataset.

Figure 4 Predicted (gray) and ground truth (yellow) of Pararubber tree areas over regionsof (a) Validation#1 and (b) Validation#2.
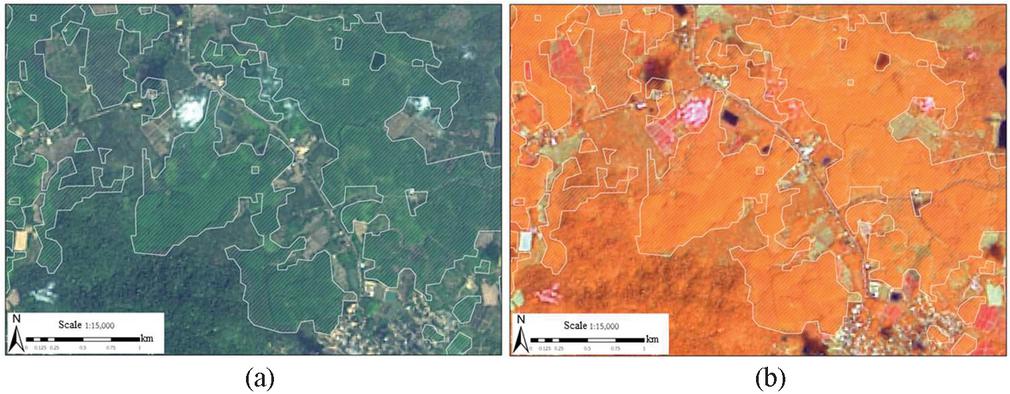
Figure 5 Classified areas of Pararubber tree on a LANDSAT-8 image with (a) true colors and (b) false colors band-564.
The trained model is then used to predict the areas of Pararubber tree in the validation datasets. The predicted results together with the ground truth in the Validation#1 and Validation#2 datasets are shown in Figure 4(a) and 4(b), respectively.
The classified result in another region of Scene#1 is shown in Figure 5 where the classified Pararubber tree areas are shown as gray polygons. Figure 5(a) shows the predicted results with true colors of the LANDSAT-8 image while Figure 5(b) shows the predicted results with false colors band-564 of the LANDSAT-8 image. It should be noted that the false colors band-564 is generally used for manual classification of the Pararubber tree areas. The classified areas in Figure 5(b) show good corresponding with light orange areas at which the Pararubber tree is almost likely from a manual classification perspective.
6 Accuracy Assessment
The accuracy of the algorithm is assessed by comparing with the ground truth in the datasets of Training#1, Training#2, Validation#1, and Validation#2 which are evaluated in the form of error matrix of Pararubber tree and non-Pararubber tree as shown in Table 1–Table 4, respectively. The error matrixes show that the true positive (TP) and the true negative (TN) are significantly higher than the false positive (FP) and the false negative (FN) which could initially indicate the validity of the model.
Table 1 Error matrix of Training#1 dataset
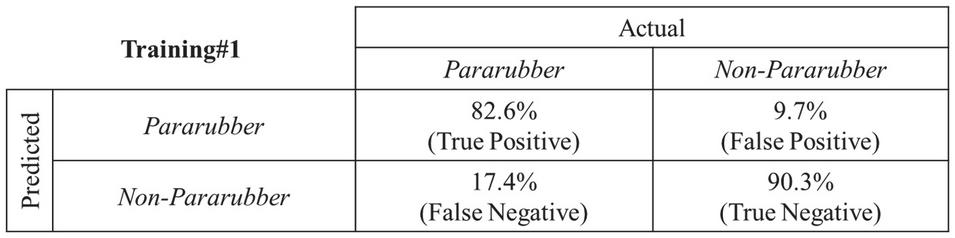 |
Table 2 Error matrix of Training#2 dataset.
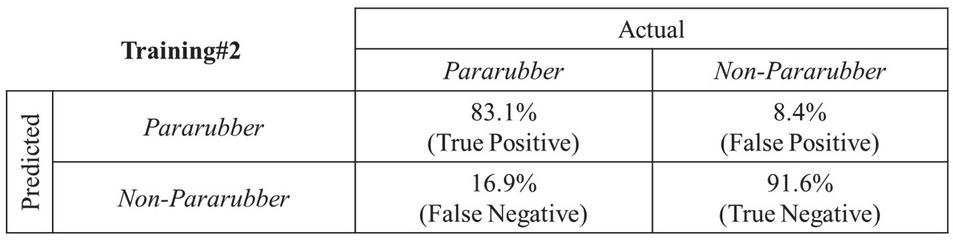 |
Table 3 Error matrix of Validation#1 dataset.
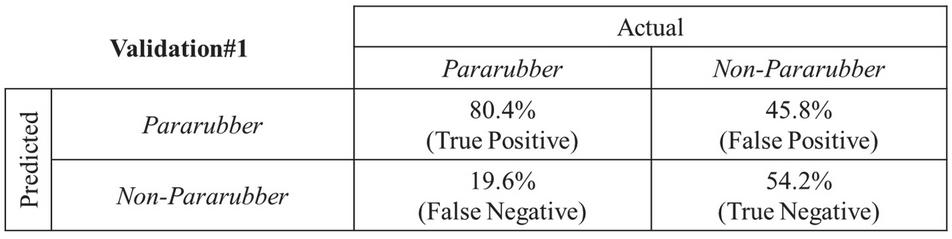 |
Table 4 Error matrix of Validation#2 dataset
 |
Based on the error matrix, precision (P), recall (R), F-score (F), and accuracy (ACC) can be calculated as follows:
| (1) | |
| (2) | |
| (3) | |
| (4) |
Considering the training datasets from Table 1, the error matrix of the Training#1 dataset yields , , , and . From Table 2, the error matrix of the Training#2 dataset yields , , , and . It should be noted that the training datasets should not be used to assess how accurate the model is. However, the error analyses of the training datasets are displayed here for showing how well the model does with the training datasets themselves.
The error analyses on the validation datasets are shown in Tables 3 and 4, respectively. The Validation#1 dataset yields P = 63.71%, , , and and the Validation#2 dataset yields , , , and . From both validation datasets, the total accuracy of the model in this work yields , , , and .
7 Concluding Remarks
This work applies the DCED method to develop an algorithm that automatically classifies areas of Pararubber trees in the Kingdom of Thailand. The predicted results from the DCED model in this work are shown to be valid based on the validation datasets which was created by manual method. Nevertheless, further accuracy assessment in wider regions is still required to fully validate the model. In addition, more datasets can be used for training the model to help improve the accuracy of the model. Therefore, the next step of this work would be to create more ground truth areas in the Kingdom of Thailand in order to improve the accuracy of the algorithm by using such ground truth areas to better train the classifiers for the classification process.
Acknowledgment
The authors wish to acknowledge the financial support and the data provided for this work from the Geo-Informatics and Space Technology Development Agency (GISTDA), Thailand.
References
[1] Z. Li, and J. Fox, “Mapping rubber tree growth in mainland Southeast Asia using time-series MODIS 250 m NDVI and statistical data,” Applied Geography, vol. 32(2), pp. 420–432, 2012.
[2] Z. Li, and J. Fox, “Integrating Mahalanobis typicalities with a neural network for rubber distribution mapping,” Remote Sensing Letters, vol. 2(2), pp. 157–166, 2011.
[3] Z. Li, and J. Fox, “Rubber tree distribution mapping in northeast Thailand,” International Journal of Geosciences, vol. 2(4), pp. 573, 2011.
[4] C. Wasana, “An approach for estimating area of rubber plantation: integrating satellite and physical data over the Northeast Thailand,” Proceedings of the 31st Asian Conference on Remote Sensing Vietnam, Hanoi, Vietnam, 2010.
[5] H. Hu, W. Liu, and M. Cao, “Impact of land use and land cover changes on ecosystem services in Menglun, Xishuangbanna, Southwest China,” Environmental Monitoring and Assessment, vol. 146(1–3), pp. 147–156, 2008.
[6] K. Hurni, “Rubber in Laos: Detection of actual and assessment of potential plantations in Lao PDR using GIS and remote sensing technologies,” Doctoral dissertation, 2008.
[7] H. Li, Y. Ma, T. Aide, and W. Liu, “Past, present and future land-use in Xishuangbanna, China and the implications for carbon dynamics,” Forest Ecology and Management, vol. 255(1), pp. 16–24, 2008.
[8] H. Li, Y. Ma, T. Aide, W. Liu, and M. Cao, “Demand for rubber is causing the loss of high diversity rain forest in SW China,” Plant Conservation and Biodiversity, Springer, Dordrecht, pp. 16–24, 2006.
[9] M. Suratman, V. LeMay, Q. Gary, G. Donald, N. Walsworth, and L. Peter, “Logistic regression modeling of thematic mapper data for rubber (Hevea Brasiliensis) area mapping,” Science Letters, vol. 2(1), pp. 79–85, 2005.
[10] A. Ekadinata, A. Widayati, and G. Vincent, “Rubber agroforest identification using object-based classification in Bungo District, Jambi, Indonesia,” 25th Asian Conference on Remote Sensing, Chiang Mai, Thailand, pp. 22–26, 2004.
[11] M. Suratman, G. Bull, D. Leckie, V. Lemay, P. Marshall, and M. Mispan, “Prediction models for estimating the area, volume, and age of rubber (Hevea brasiliensis) plantations in Malaysia using Landsat TM data,” International Forestry Review, vol. 6(1), pp. 12, 2004.
[12] S. Baban, and K. Wan Yusof, “Mapping land use/cover distribution on a mountainous tropical island using remote sensing and GIS,” International Journal of Remote Sensing, vol. 22(10), pp. 1909–1918, 2001.
[13] V. Badrinarayanan, A. Kendall, R. Cipolla, and S. Member, “SegNet: A Deep Convolutional Encoder-Decoder Architecture for Image Segmentation,” IEEE transactions on pattern analysis and machine intelligence 39, no. 12, pp. 2481–2495, 2017.
[14] H. Noh, S. Hong, and B. Han, “Learning Deconvolution Network for Semantic Segmentation,” In Proceedings of the IEEE international conference on computer vision, pp. 1520–1528, 2015.
[15] M. Everingham, S. A. Eslami, L. Van Gool, C. K. Williams, J. Winn and A. Zisserman, “The pascal visual object classes challenge: A retrospective,” International Journal of Computer Vision, vol. 111, no. 1, pp. 98–136, 2015.
[16] D. Clevert, T. Unterthiner, and S. Hochreiter, “Fast and Accurate Deep Network Learning by Exponential Linear Units (ELUs),” The International Conference on Learning Representations, 2016.
Biographies

C. Supunyachotsakul received her B.Eng. degree in Survey Engineering from Chulalongkorn University, Thailand; and M.Sc. degrees in Photogrammetry and Geoinformatics from Stuttgart University of Applied Sciences, Germany; and M.S.E. and Ph.D. degrees in Civil Engineering from Purdue University, USA. Dr. Supunyachotsakul is currently a faculty member at Department of Civil Engineering, Faculty of Engineering, King Mongkut’s Institute of Technology Ladkrabang, Thailand. Her research interest is in the areas of Photogrammetry, LIDAR technology, and 3D-point cloud data processing.

N. Suksangpanya received his B.Eng. (2nd-class honor) and M.E. degrees in Mechanical Engineering from King Mongkut’s Institute of Technology Ladkrabang; and M.S.E. and Ph.D. degrees in Civil Engineering from Purdue University, USA. Dr. Suksangpanya is currently a faculty member of School of Geoinformatics, Institute of Science, Suranaree University of Technology, Nakhon Ratchasima, Thailand. His research interest is in the areas of image processing, feature extraction, and 3D-model reconstruction from point cloud data.
Journal of Mobile Multimedia, Vol. 17_4, 693–706.
doi: 10.13052/jmm1550-4646.17410
© 2021 River Publishers