Semi-Automatic Classification of Rotating Crops in Northern Thailand by Using Temporal LANDSAT Images
N. Suksangpanya1,* and C. Supunyachotsakul2
1School of Geoinformatics, Institute of Science, Suranaree University of Technology, Nakhon Ratchasima, Thailand
2Department of Civil Engineering, Faculty of Engineering, King Mongkut’s Institute of Technology Ladkrabang, Bangkok, Thailand
E-mail: nobphadon@g.sut.ac.th; chisaphat.su@kmitl.ac.th
*Corresponding Author
Received 28 September 2021; Accepted 20 October 2021; Publication 22 January 2022
Abstract
This work focuses on rotating crops in the forest conservation areas in the northern region of Thailand which always cause false detection for forest encroachment and deforestation. Therefore, this work establishes a database of rotating crop areas in the northern region of Thailand and additionally develops a semi-automatic classification approach to help facilitate the classification process. LANDSAT images ranging from 1987 to 2018 are used as the input data for classifying the rotating crop areas. The semi-automatic classification approach is comprised of the automatic supervised classification and the manual classification by visual interpretation, respectively. The automatic and manual classification procedures are explained, and the results are verified by using ground truth locations distributed over the study region which gives 81.72% accuracy.
Keywords: Feature classification, satellite images, temporal, supervised classification, semi-automatic.
1 Introduction
The definition of a rotating crop in this work is where forest and crops are alternated over time as a cycle. This is a result of growing crops in the official forest conservation area and subsequently being left unattended after harvested which eventually becomes forest again. The rotating crop is different from deforestation or forest encroachment because the rotating crop areas are usually at the same location. Since the forest encroachment is a big issue in Thailand which officials have been trying to detect, the rotating crop areas always cause false detection of forest encroachment because the forest is disappeared in the same way when investigated at a certain time. Therefore, creating a database of the rotating crop areas would significantly help prevent false detection of the forest encroachment. Consequently, the main goals of this work are to establish a database of the rotating crop area over the northern region of Thailand and also develop an approach to help classify the rotating crop areas for updating the database in the future.
Typically, the classification process can be categorized into 3 main methods which are pure manual, pure automatic, and semi-automatic methods. In general, the manual classification can provide accurate results and is generally used to create ground truth datasets. But the trade-off is that the manual approach is very time-consuming and requires a large number of labors. On the other hand, the automatic method only requires minimal human interference to setup initial parameters and to provide input data which could significantly reduce workload and work rate of a human. However, the trade-off is that it can be difficult to achieve high accuracy. The automatic classification method, which can also be called Machine Learning, has been a widespread field of research in the field of classification in which there are many attempts to increase the accuracy of the classified results by developing different techniques and algorithms which are typically divided into 2 main categories which are supervised learning and unsupervised learning [1].
The automatic approach for classifying land use/land cover (LULC), such as rotating crops, typically uses satellite images as input data. For instances, Dong et al., 2012 [2], and Li and Fox, 2012 [3], utilized images from MODIS sensor (moderate resolution imaging spectro-radiometer) which is on board of Terra satellite. On the other hand, Li and Fox, 2011 [4] utilized images from the ASTER sensor on board of Terra satellite. Beckschäfer, 2017 [5], Fan et al., 2015 [6], Kou et al., 2015 [7], Li and Fox, 2011 [8], Hu, Liu and Cao, 2008 [9], Suratman et al., 2004 [10], Chen et al., 2012 [11] utilized images from LANDSAT satellites.
For classifying LULC by using satellite images, the supervised classification approach is typically used. For instances, LANDSAT images were used to classify 10 layers of LULC in Xishuangbanna, China [9] and also detect influences of LULC change on carbon dynamics in the ecosystem [12] by using maximum likelihood method. Li and Fox, 2011 [4] combined two supervised classification methods which are Mahalanobis and Multi-layer perceptron (MLP) neural network to classify para-rubber trees in the Thai-Loas border and China-Laos border by using images from ASTER sensor on board the Terra satellite. In addition, Mahalanobis supervised classification method was used to detect LULC in the Southeast Asia region by using the non-thermal reflective bands, normalized difference vegetation index (NDVI), and the parameters achieved from tasselled cap transformation [13, 14] determined from the LANDSAT-5 images and were used as input data.
For the rotating crops in Thailand, most of the data was collected by performing field-surveying of which the results can only represent the rotating crops at a specific time period and can hardly cover the rotating crop being in the forest stage at the time. In this work, the study area focuses on 10 provinces in the northern region of Thailand. The rotating crop areas in the study area are classified from processing LANDSAT satellite images at different image-capture times ranging from 1987 to 2018. The classification approach proposed in this work is a semi-automatic method where a supervised classification is initially performed, and a manual classification is then used to improve accuracy. The details of the automatic and manual classification are explained in this work as well as the accuracy assessment.
2 Data Preparation
2.1 Study Area
The definition of the rotating crop is the area being forest and crops alternately inside the official forest conservation area. Therefore, the study area in this work focuses on the official forest conservation area in the northern region of Thailand covering 10 provinces as shown in Figure 1 which is the official data from the Department of National Parks, Wildlife, and Plant Conservation, Thailand. Since LANDSAT images will be used in this study, the study area is then strictly within the boundaries of the LANDSAT scenes which eventually leads to approximately 5,845.40 sq.km of the study area as shown in Figure 1.
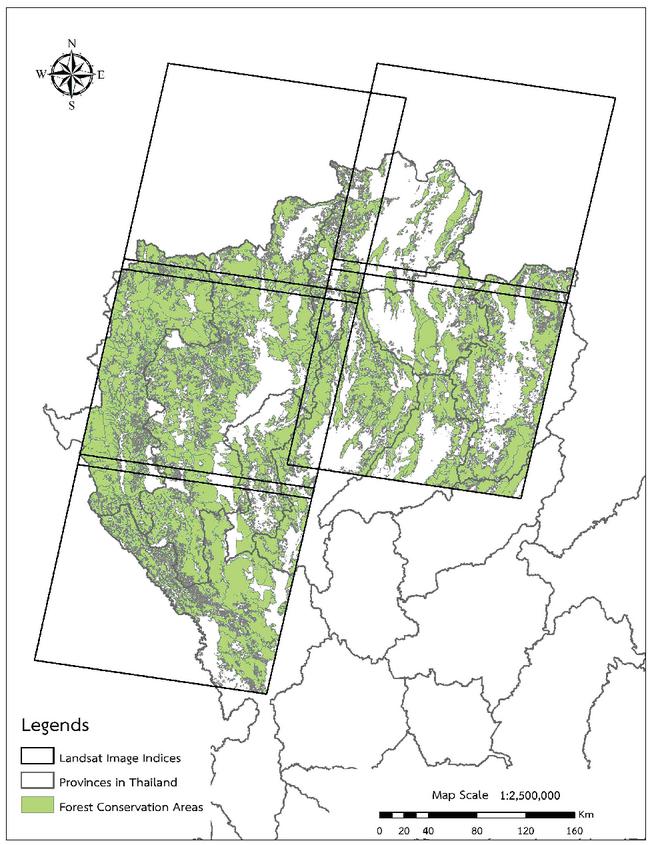
Figure 1 The official forest conservation area in the northern region of Thailand inside 5 LANDSAT scenes.
2.2 Satellite Images
This work uses the LANDSAT satellite images that cover the northern region of Thailand which results in 5 scenes with path/row of 130046, 130047, 131046, 130047, and 131048 as shown in Figure 1. All mentioned 5 scenes were captured during the year of 1987 to 2018 with at least 1 image per year and scene which results in at least 32 images per scene. These include LANDSAT-5, LANDSAT-7, and LANDSAT-8 images. Subsequently, these sets of images were carefully chosen for this study by using the following criteria:
• Cloud content being less than 15% over the official forest conservation area
• Image must not be compressed and must not contain voids or any data loss within the image
• Ground sampling distance being 30 meters
• Must have at least RGB and NIR bands
2.3 Ground Truth
In this work, the ground truth of the rotating crop areas is separated into 2 datasets which are the ground truth used for training procedure in the automatic classification part, so-called training dataset, and the ground truth used for accuracy assessment which are the locations of the rotating crops that were obtained by field-surveying.
2.3.1 Training dataset
The training dataset is known areas for rotating crops in a small region locating in northern Thailand as shown in Figure 2 where the base map is the LANDSAT-8 image with true color. In the image, there are two main features which are the rotating crop areas and the non-rotating crop areas.
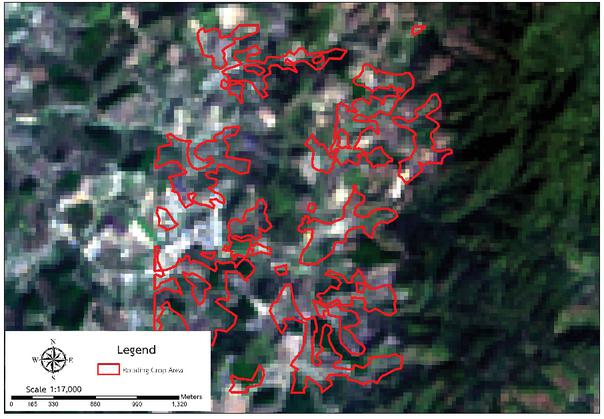
Figure 2 Ground truth of rotating crop areas for training dataset over LANDSAT-8 image with true color.
2.3.2 Locations of rotating crops by field-surveying
Another ground truth in this work is the locations of rotating crops which were acquired from the field data acquired by field-surveying of the Department of National Parks, Wildlife, and Plant Conservation, Thailand. The data is in the form of points of the rotating crop locations distributed over the study area which will be used for assessing the accuracy of the approach in this work.
3 Methodology
This work classifies the rotating crop areas by using the semi-automatic method which will initially use a pure-automatic approach and following by a manual method. The automatic classification is performed to initially obtain areas which are susceptible to be rotating crops. Subsequently, the rotating crop areas as a result of the automatic classification are used as a guideline for manual classification which is performed by humans. The details of both steps are explained below.
3.1 Automatic Classification
In the automatic classification procedure part, the algorithm of the model will be explained together with the training procedure as follows:
This work develops a supervised classification algorithm using a temporal statistical approach under the idea of simple, ease of development, and being able to provide fairly accurate result. The procedure is as follows: First, calculating NDVI for each pixel in all images by using the following equation.
| (1) |
Where denotes NDVI of pixel i of an image taken at time t. NIR is the digital number of the near-infrared band of pixel i, Red is the digital number of the red-color band of pixel i. For Landsat-5 and Lansat-7 images, NIR is band4 and Red is band3. On the other hand, for Landsat-8 images, NIR is band5 and Red is band4.
Second, averaging NDVI of each pixel over time to determine the mean NDVI of pixel i (). Third, calculating the largest variation of NDVI value from of pixel i over time () which can be written as:
| (2) |
From calculating a mean value and a standard deviation of over the pixels in an image ( and , respectively). Finally, determining the rotating crop area by using the following criteria.
| (3) |
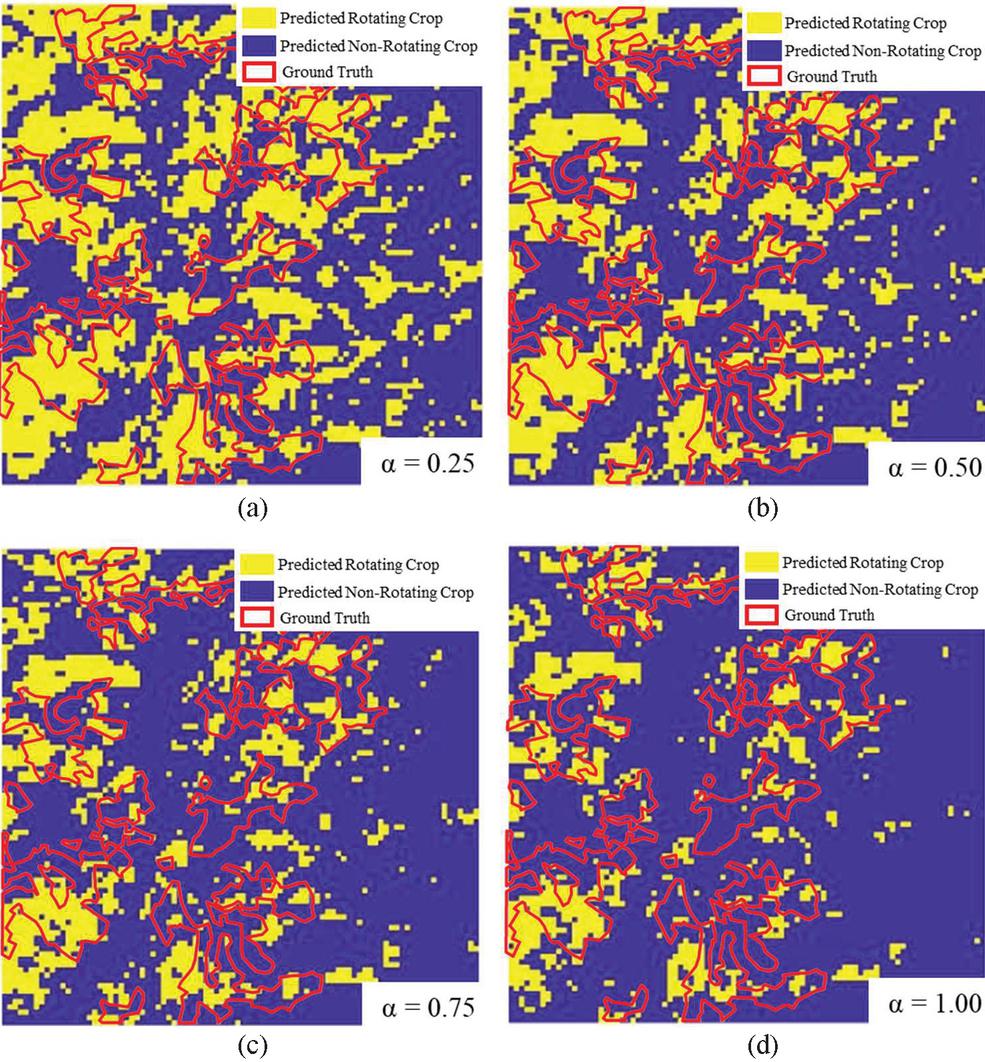
Figure 3 Prediction versus ground truth in the training dataset with the weight parameters of (a) , (b) , (c) , and (d) .
Where denotes a weight parameter which will be obtained through the training procedure. means pixel i will be classified as a rotating crop area. On the other hand, means pixel i will be classified as a non-rotating crop area.
The supervised classification algorithm is put on training to determine the value of the weight parameter . The training dataset as shown in Figure 2 is used for training of which the results with , 0.50, 0.75, and 1.00 are shown in Figure 3(a)–3(d), respectively.
In this work, the result of the automatic classification will be used as a guideline for the following manual classification. Concretely, the manual classification will mainly focus on the predicted rotating crop areas and their surrounds. Therefore, the result is required to have low false-negative detection which implies that the recall is required to be high. The recall is consequently used as a criterion to determine . From the training results, the yields the highest recall of 75.73% and will be used in this study. It should be noted that using gives fairly low precision, accuracy, and F-score which are 52.46%, 53.55%, and 61.98%, respectively. Nevertheless, the focus in this work is on the recall in order to ensure that the following manual classifying procedure focuses on the areas susceptible to be the rotating crops which are called candidate areas in this work.
3.2 Manual Classification
The candidate areas obtained from the automatic classification are then used as guidelines for manual classification. The manual classification observes the images at different times, specifically, at the predicted areas and their surroundings within the official forest conservation areas to detect the feature changes over time. Visual interpretation by humans is used to classify the rotating crop areas based on the definition of rotating crop and object recognition features, such as shape, pattern, size, location, and colors.
The manual classification using visual interpretation by humans is generally a process of producing a ground truth or a reference dataset because human eyes are known to be highly effective for analyzing complex object recognition which could consequently provide a very accurate classification result. Nevertheless, this manual approach can be very expensive in working time and labors. Such drawbacks are lessened in this work by initially creating the candidate areas from the automatic classification. An example of a rotating crop detection is shown in Figure 4 where an area displays change from brown color in 1993 to green color in 2000 and then becomes brown color again in 2018 which indicates that such area is a rotating crop area.
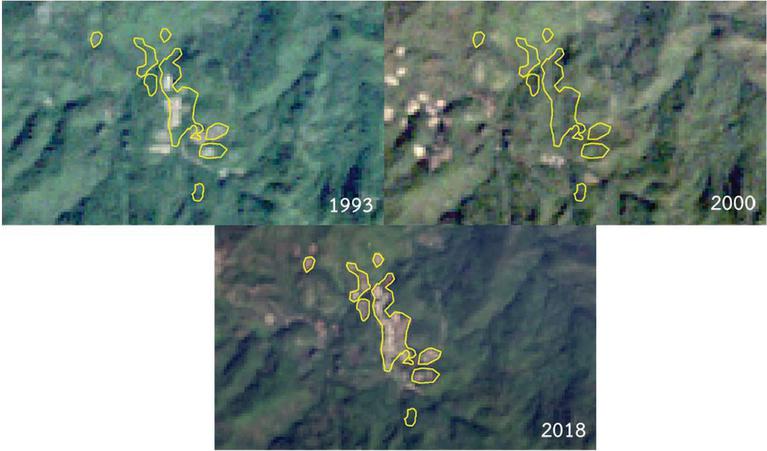
Figure 4 Illustration of visual interpretation for rotating crop recognition using temporal LANDSAT images.
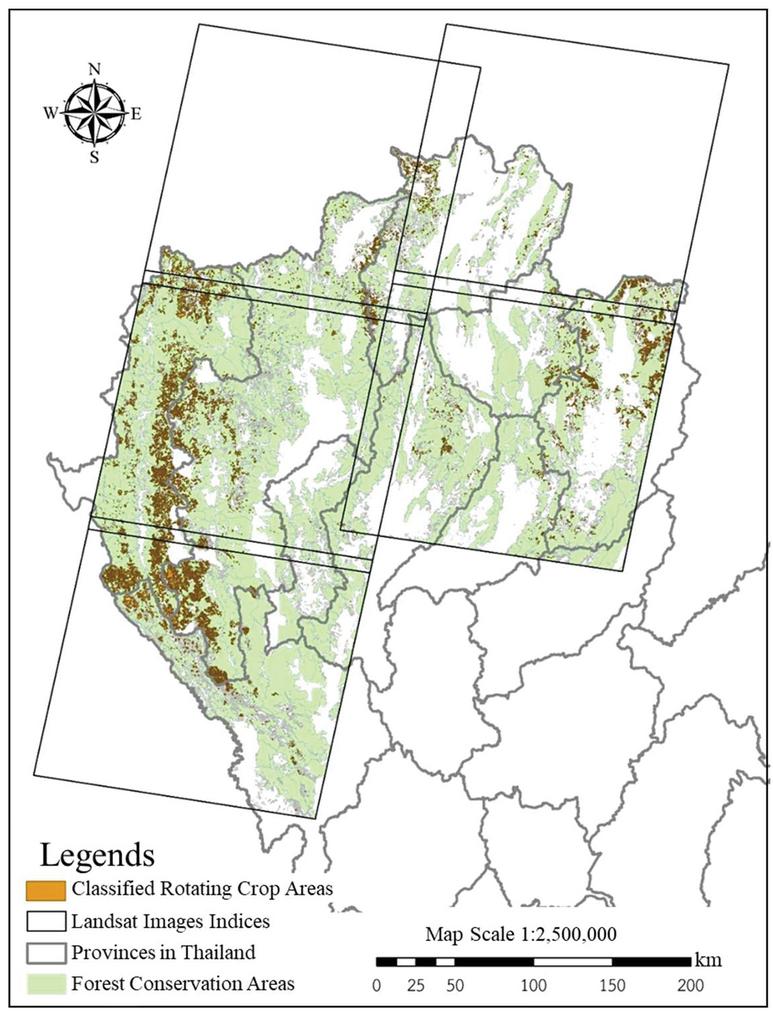
Figure 5 Classified rotating crop areas using the semi-automatic classification compared with the official forest conservation areas.
4 Classified Results
The combined automatic-manual classification method in this work is performed over the official forest conservation areas in the northern region of Thailand which covers 10 provinces. The result is illustrated in Figure 5 where the polygons represent the classified rotating crop areas and the official forest conservation areas, respectively. The classified rotating crops areas are 1830.36 sq.km which is approximately 31% in comparison with the official forest conservation areas in this work.
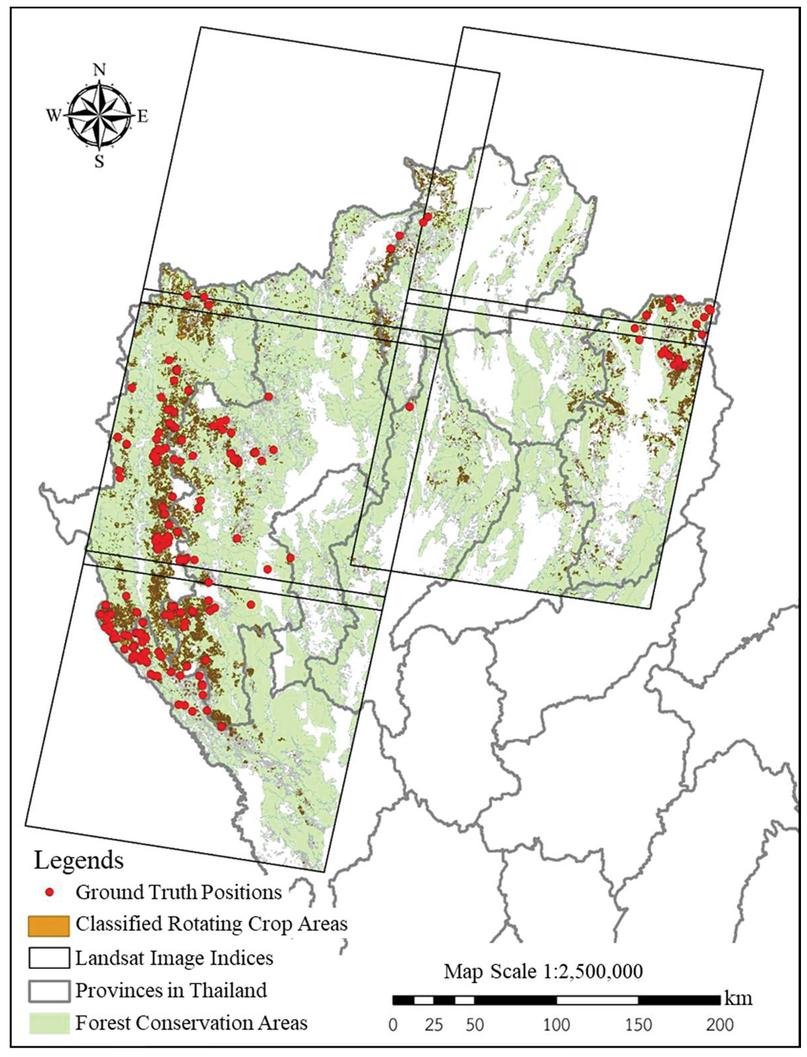
Figure 6 Ground truth locations (dots) compared with classified rotating crop areas.
5 Accuracy Assessment
The classified rotating crop areas are verified by the positional ground truth of which 186 locations are distributed over the study region as shown in dots in Figure 6. All of 186 ground-truth locations are considered as checkpoints and are used to verify the approach in this work. As a result, there are 152 locations of the ground truth fall within the classified rotating crop areas yielding the accuracy of 81.72% which could indicate that the approach in this work is valid.
6 Concluding Remarks
LANDSAT images ranging from 1987 to 2018 over the northern region of Thailand are used to detect the rotating crop areas. This work uses the semi-automatic approach to perform such classification which can optimize accuracy with time and labor required for completing the task. Nevertheless, there are many possibilities for improving the accuracy of the approach in this work. For example, the automatic part can be improved by eliminating geometrical errors from the LANDSAT images which could lessen the influence of environmental and unrelated parameters in the images and, therefore, lead to better automatic classification. In addition, other supervised classification methods should be carried out to compare the efficient and accuracy of the algorithm. Therefore, the next step of this work would be to develop a geometrical-error correction algorithm and integrate with the automatic classification in this work together with trying out other classification methods.
Acknowledgment
The authors wish to acknowledge the financial support and the data provided for this work from the Geo-Informatics and Space Technology Development Agency (GISTDA), Thailand.
References
[1] Lillesand, T., Kiefer, R.W. and Chipman, J., 2015. Remote sensing and image interpretation. John Wiley & Sons, 2015.
[2] Dong, J., Xiao, X., Sheldon, S., Biradar, C. and Xie, G., “Mapping tropical forests and rubber plantations in complex landscapes by integrating PALSAR and MODIS imagery,” ISPRS Journal of Photogrammetry and remote sensing, vol. 74, pp. 20–33, 2012.
[3] Li, Z. and Fox, J.M., “Mapping rubber tree growth in mainland Southeast Asia using time-series MODIS 250 m NDVI and statistical data,” Applied Geography, vol. 32(2), pp. 420–432, 2012.
[4] Li, Z. and Fox, J.M., “Integrating Mahalanobis typicalities with a neural network for rubber distribution mapping,” Remote Sensing Letters, vol. 2(2), pp. 157–166, 2011.
[5] Beckschäfer, P., “Obtaining rubber plantation age information from very dense Landsat TM & ETM time series data and pixel-based image compositing,” Remote Sensing of Environment, vol. 196, pp. 89–100, 2017.
[6] Fan, H., Fu, X., Zhang, Z. and Wu, Q., “Phenology-based vegetation index differencing for mapping of rubber plantations using Landsat OLI data,” Remote Sensing, vol. 7(5), pp. 6041–6058, 2015.
[7] Kou, W., Xiao, X., Dong, J., Gan, S., Zhai, D., Zhang, G., Qin, Y. and Li, L., “Mapping deciduous rubber plantation areas and stand ages with PALSAR and Landsat images,” Remote Sensing, vol. 7(1), pp. 1048–1073, 2015.
[8] Li, Z. and Fox, J.M., “Rubber tree distribution mapping in northeast Thailand,” International journal of Geosciences, vol. 2(04), p. 573, 2011.
[9] Hu, H., Liu, W. and Cao, M., “Impact of land use and land cover changes on ecosystem services in Menglun, Xishuangbanna, Southwest China,” Environmental Monitoring and Assessment, vol. 146(1–3), pp. 147–156, 2008.
[10] Suratman, M.N., Bull, G.Q., Leckie, D.G., Lemay, V.M., Marshall, P.L. and Mispan, M.R., “Prediction models for estimating the area, volume, and age of rubber (Hevea brasiliensis) plantations in Malaysia using Landsat TM data,” International Forestry Review, vol. 6(1), pp. 12–12, 2004.
[11] Chen, B., Cao, J., Wang, J., Wu, Z., Tao, Z., Chen, J., Yang, C. and Xie, G., “Estimation of rubber stand age in typhoon and chilling injury afflicted area with Landsat TM data: a case study in Hainan Island, China,” Forest ecology and management, vol. 274, pp. 222–230, 2012.
[12] Li, H., Ma, Y., Aide, T.M. and Liu, W., “Past, present and future land-use in Xishuangbanna, China and the implications for carbon dynamics,” Forest Ecology and Management, vol. 255(1), pp. 16–24, 2008.
[13] Crist, E.P., “A TM tasseled cap equivalent transformation for reflectance factor data. Remote Sensing of Environment”, vol. 17(3), pp. 301–306, 1985.
[14] Han, T., Wulder, M.A., White, J.C., Coops, N.C., Alvarez, M.F. and Butson, C., “An efficient protocol to process Landsat images for change detection with tasselled cap transformation”. IEEE Geoscience and Remote Sensing Letters, vol. 4(1), pp. 147–151, 2007.
Biographies

N. Suksangpanya received his B.Eng. (2nd-class honor) and M.E. degrees in Mechanical Engineering from King Mongkut’s Institute of Technology Ladkrabang; and M.S.E. and Ph.D. degrees in Civil Engineering from Purdue University, USA. Dr. Suksangpanya is currently a faculty member of School of Geoinformatics, Institute of Science, Suranaree University of Technology, Nakhon Ratchasima, Thailand. His research interest is in the areas of image processing, feature extraction, and 3D-model reconstruction from point cloud data.

C. Supunyachotsakul received her B.Eng. degree in Survey Engineering from Chulalongkorn University, Thailand; and M.Sc. degrees in Photogrammetry and Geoinformatics from Stuttgart University of Applied Sciences, Germany; and M.S.E. and Ph.D. degrees in Civil Engineering from Purdue University, USA. Dr. Supunyachotsakul is currently a faculty member at Department of Civil Engineering, Faculty of Engineering, King Mongkut’s Institute of Technology Ladkrabang, Thailand. Her research interest is in the areas of Photogrammetry, LIDAR technology, and 3D-point cloud data processing.
Journal of Mobile Multimedia, Vol. 18_3, 807–820.
doi: 10.13052/jmm1550-4646.18317
© 2022 River Publishers