Multimodal Driver Drowsiness Detection From Video Frames
Pritesh Kumar Singh1, Archit Gupta1, Mayank Upadhyay1, Achin Jain1, Manju Khari2,* and Puneet Singh Lamba3
1Bharati Vidyapeeth’s College of Engineering, New Delhi, India
2Jawaharlal Nehru University, Delhi School of Computer and Systems Sciences, New Delhi, India
3VIPS-TC, School of Engineering & Technology, New Delhi, India
E-mail: manjukhari@yahoo.co.in
*Corresponding Author
Received 25 August 2021; Accepted 22 November 2021; Publication 15 November 2022
Abstract
Fatigue leads to tiredness, exhaustion, and sleepiness. Driving in fatigue conditions is considered dangerous and can cause serious road accidents. According to reports about 25% of road accidents are due to driver drowsiness. The main reason behind drowsiness is fatigue. While driving continuously on long trips, drivers feel sleepy. In this paper, we proposed a novel approach that is efficient enough to detect driver drowsiness accurately. An intelligent system, that can quickly and precisely determine whether the driver is feeling drowsiness or not during driving and can also generate a warning in real-time scenarios is implemented. Thus, resulting in reducing the number of accidents that take place due to the drowsiness of the drivers as well as the death rate. In this paper, drowsiness is detected by observing facial features such as Eyes and Mouth.
Keywords: Eye aspect ratio (EAR), mouth aspect ratio (MAR), facial landmarks, drowsiness.
1 Introduction
A technology developed for vehicle safety that prevents accidents when the reason is due to being drowsy is identified as Driver Drowsiness Detection System (DDDS). Various research reports suggest that 20–25% of all accidents are due to driver drowsiness which may be as high as 50% on certain roads [1, 2]. An evaluation was performed in recent times which indicated that around 1,200 deaths and 76,000 accidents every year are contributed by fatigue-related crashes [3, 4]. The harm and the damage, drowsiness brings on the road, preparation and proper approach should be taken to overcome the adverse effects. The carelessness of the driver [17, 18], the absence of readiness during riding, and distraction contribute to the overall damage caused. Drowsiness and driver attention diversion are two main reasons for road accidents. Drowsiness generally occurs due to fatigue wherein a driver’s attention is diverted if he is not paying attention or got lost in his thoughts. It is represented via the present withdrawal of attention from the road. The decrease in traveling performance, high disturbance, and an enhanced danger of a crash crisis is the sort of effects that might be required in both driver distraction and drowsiness [5, 6].
Driver drowsiness detection requires precise identification of drowsiness during nighttime driving. Various methods have been used for detection and identification of the drowsiness of the driver such as CNN (Convolutional Neural Network), ANN (Artificial Neural Network), SVM (Support Vector Machine), and ECG (Electrocardiogram). Here we are using facial landmarks extractor to identify the region of interest such as eyes (open/closed), mouth (open/closed), and determine whether the person is feeling drowsy or not [7, 8].
The rest of the paper is organized as follows: Section 2 presents a related study along with challenges in driver drowsiness detection techniques. The proposed model is presented in Section 3 and the research methodology used to explain the work is shown in Section 4. Section 5 discusses results and finally, Section 6 concludes the paper.
2 Related Study
In this section, various research techniques and approaches are analyzed. The authors in [3], propose a robust and non-intrusive system for monitoring driver’s fatigue and drowsiness in real-time scenarios. SVM is used to extract the face region from video frames and Circular Hough Transform (CHT) is further applied to eyes and mouth extracted regions. In [4], the authors proposed a lightweight android application to detect driver drowsiness using various machine learning algorithms. Here adaptive thresholding is employed to sense drowsiness. Maximum accuracy of 84% is achieved using Forest Classifier. Driver drowsiness detection using image processing [20] focuses on drowsiness detection by processing the driver’s eye image. In [21], the authors proposed a camera based DDDS. Haar features are used for face detection and a forest classifier is applied to locate eye regions. In [22], an eye blink sensor is proposed using PIC 16F877A for DDDS to prevent accidents. Across various research papers, some common challenges that are being faced using different techniques [19, 33] are:
2.1 Accurately Identifying Time for the Alarm to Beep
The main objective of our work is to precisely determine whether the driver is feeling drowsy or not and raise the alarm or the warning at the correct time. The fraction of delay in the beep of the alarm will increase the chances of the accident or failure [10].
2.2 Quality of the Image Being Fed as Input
For this work, the laptop webcam may be unable to detect and identify the drowsiness because of the low-quality video capturing power or low performance in low lighting conditions. So, there is the need for an alternative; low-cost equipment that can replace it and have a better image capturing power such as an additional webcam [11]. This cost can be reduced by using the mobile phone [34] as an alternative webcam and feeding its video as input to the laptop or the machine on which we are measuring the drowsiness [12].
2.3 Significant Change or Drop of Accuracy With or Without Spectacles
Detecting drowsiness accurately with and without spectacles is another challenge that needs to be dealt with as it is seen that there is a significant amount of loss of accuracy with the spectacles during the process of detection of the drowsiness of the driver [13, 14].
2.4 Frame Drop During the Image Feed
The feed from the webcam sometimes shows frame drops or lagging of frames that means the frame that is being extracted is sent to the model or system with the delay of fractions of seconds and the fraction of delay in the beep of alarm or the warning will increase the chances of the accident or failure [15, 16].
3 Proposed Multimodal Driver Drowsiness Detection Model
In this work, the eye aspect ratio (EAR) and mouth aspect ratio (MAR) is used to detect drowsiness. Here, facial landmarks extractor is used to determine landmarks that are employed to compute EAR and MAR. Based upon calculations done by both the ratios, it is determined whether the driver is feeling drowsy or not. Initially, a threshold is set for both the EAR and MAR that is calculated for all the targeted frames [23, 24].
Values of EAR and MAR for a certain number of consecutive frames are checked to confirm whether the same crosses the threshold or not. If it crosses, the alarm is raised to alert the driver to take a break or stop driving. The threshold value for EAR is set to 0.22 and that for MAR is set to 10 for our proposed model [25]. Apart from that, 68 Facial Landmarks extractors that will extract 68 facial landmarks of a person’s face are used. These landmarks are in a 2D coordinate system and by using these values, EAR and MAR ratios are computed. The iBUG300-W dataset was used to train the 68 facial landmarks model to extract 68 facial landmarks coordinates. Figure 1 shows the representation of facial landmarks of a person using 68 points.
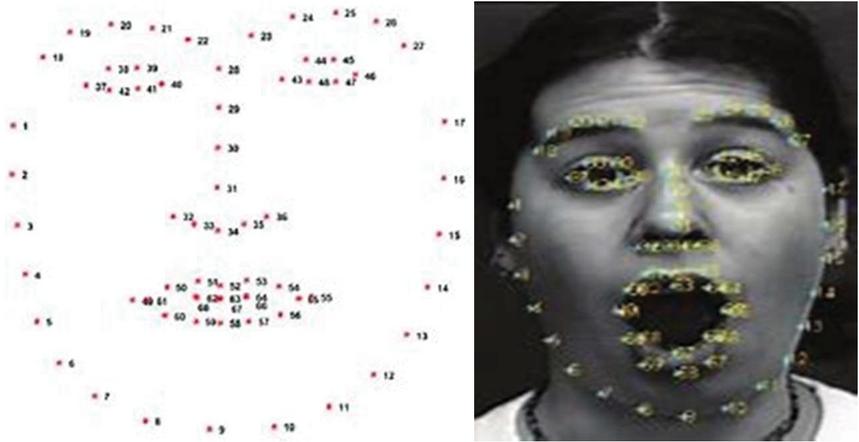
Figure 1 Facial landmarks of a person.
3.1 EAR (Eye Aspect Ratio)
The method determines the landmark positions, which enables us to extract a single quantity EAR, which defines the extent of opening of the eye in the targeted frame [26]. EAR is the average sum of vertical landmarks divided by horizontal landmarks of both eyes. A series of low EAR values doesn’t mean that a person is blinking. Figure 2 shows the six landmark p1, p2, p3, p4, p5, and p6 that are used to calculate the EAR using Equation (1). A normal blink has three features:
1. A normal human blink every 7 – 11 seconds.
2. When normal human blinks, eyes are closed for a fraction of seconds (0.13 – 0.28 sec).
3. A normal human blink with utmost 2 blinks at any instance.
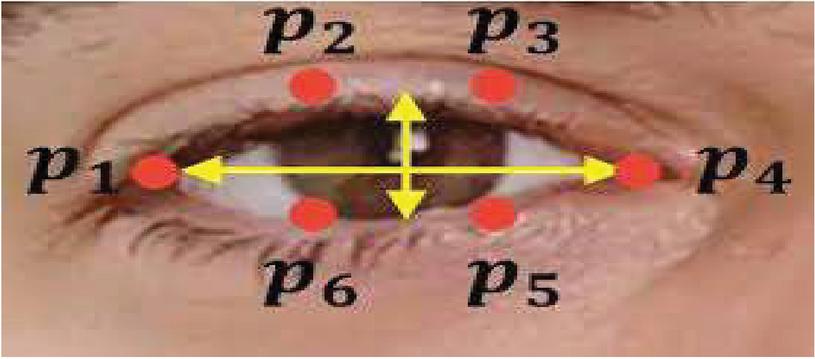
Figure 2 Computing EAR through eye landmarks.
If a driver violates any one of the three conditions it means he is in a state of drowsiness.
| (1) |
Using the “68 Facial Landmarks” model we get 68 landmarks coordinates of the face but for calculating EAR we need only eye landmarks so only the eye region is cropped. After that vertical distance between p2, p6, and p3, p5 and the horizontal distance between p1, 4 is calculated. Finally, the EAR is computed by dividing vertical distance with horizontal distance. The same procedure is followed for the other eye EAR’s for both the eyes are averaged [27, 28].
3.2 MAR (Mouth Aspect Ratio)
MAR can be calculated by using the facial landmarks of the mouth. Like EAR we assign these landmarks values like A, B, C, D, E, F, G, and H shown in Figure 3. Using these points vertical distance between C-D, E-F, H-G, and horizontal distance between A-B is calculated and these values are used to calculate MAR using Equation (2).
| (2) |
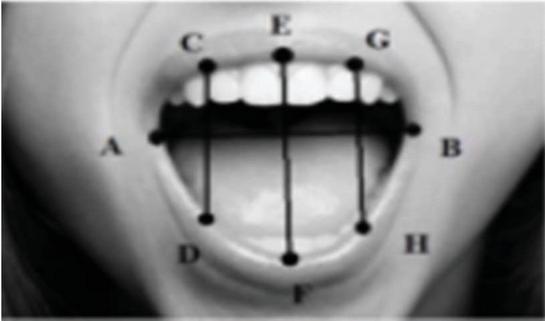
Figure 3 Computing MAR through mouth landmarks.
It can be observed that the value of MAR is zero when the mouth is closed but its value increases when the mouth starts to open and reaches its maximum value when the mouth is wide open [29], which is generally the case of yawning. Algorithm 1 predicts the drowsiness.
Algorithm 1: Prediction of Drowsiness
1. Initialize the python “dlib’s face detection” model as a ’detector’ to detect the face and the “68 Facial landmarks” model as a ’predictor’ to extract facial landmarks.
2. From 68 landmarks of the left eye, right eye, and mouth are used.
3. A video stream is fed as input from the camera.
4. Loop over all the frames to detect the faces
a. Extract a frame
b. Resize the frame
c. Convert the frame to grayscale
d. Detect faces
5. Loop over the face detected and apply the predictor
a. Compute the average EAR by using the EAR of both eyes.
b. Calculate MAR for the mouth
c. If EAR EAR_THRESHOLD indicates a closed eye for the frame
d. Count the number of consecutive frames for which the eye remains closed
e. If EAR EAR_THRESHOLD, raise the alarm
f. IF MAR MAR_THRESHOLD Show the alert (Person in Yawing)
Figure 4 shows the process for raising the alarm if EAR crosse the threshold.
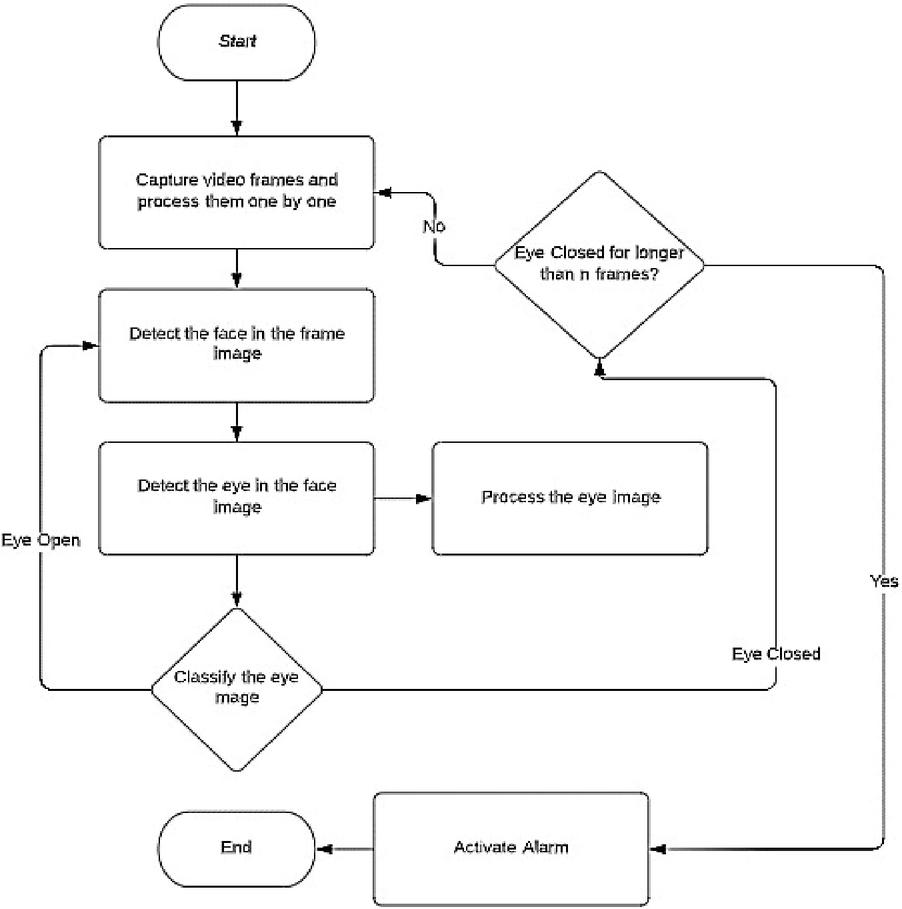
Figure 4 Flowchart of the process followed.
4 Research Methodology Used
4.1 Dataset Used
A dataset consisting of videos of 60 – 90 seconds of persons driving the car and feeling drowsy and yawing at different instances of time is used. The dataset also contains the video frames of the same video labelled as if the person’s eye is closed or he/she is yawning or not in a particular frame. We used the same for [30, 36] detecting the accuracy and for the testing part of our model. So, there are videos of 50 different persons with their frames as eyes closed, yawning or not [31, 32].
4.2 Performance Measure
In this paper, we use multiple parameters like EAR, MAR and predict with accuracy that the driver is drowsy or not in real-time scenarios. For detecting drowsiness using EAR we take several threshold values for EAR and from the results, [33, 34] it can be observed that the EAR value oscillates around 0 – 0.30 slightly when eyes are slightly open, but it drops drastically when the eyes are closed. It was observed that an EAR value below 0.22, for consecutive 50 frames indicates that the person’s eyes are closed. So, our classifier will check the next frame against the threshold and if EAR goes above the threshold, the number of frames for which EAR is below the threshold is reset to 0. Similarly, it can be observed that while a person is yawning using MAR [35].
We are using Equation (3) for calculating the Correct rate that is the difference between the Total Frames and the detection Failure divided by the total number of the frame. For example, if we are extracting frames from the video and let say the total number of frames is 1700 and we are not able to detect the drowsiness in 170 frames, so the correct rate is the difference between total frames and detection failure divided by a total number of frames.
| (3) |
5 Analysis of Results
EAR/MAR, the threshold applied for both Eye Aspect Ratio and Mouth Aspect ratio, and the number of the frames are used for calculating drowsiness. Figures 5(a), 6(a) and 7(a) show the real-time values of the EAR, MAR, and Drowsiness Count for various subjects used in this paper. Dwcnt is the count of drowsiness of the driver. The graph of EAR vs frames of corresponding subjects is shown in Figures 5(b), 6(b) and 7(b). MAR vs frames of corresponding subjects is shown in Figures 5(c), 6(c) and 7(c). It can be seen, how the EAR and MAR change if we close our eyes that are shown as the dip in the graphs and Peaks for the moment when our mouths are open.
Figure 5(a): Real-time drowsiness check on recorded video – subject 1 [36].
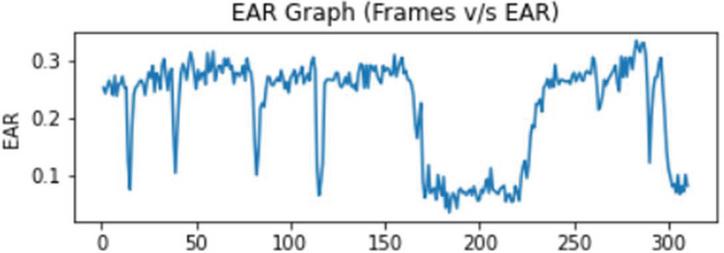
Figure 5(b): Frames v/s EAR – subject 1.
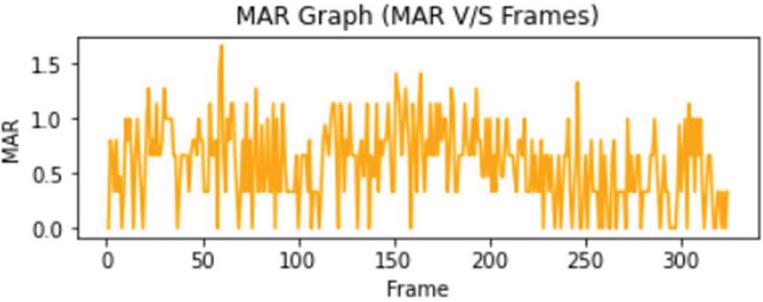
Figure 5(c): Frames v/s MAR – subject 1.
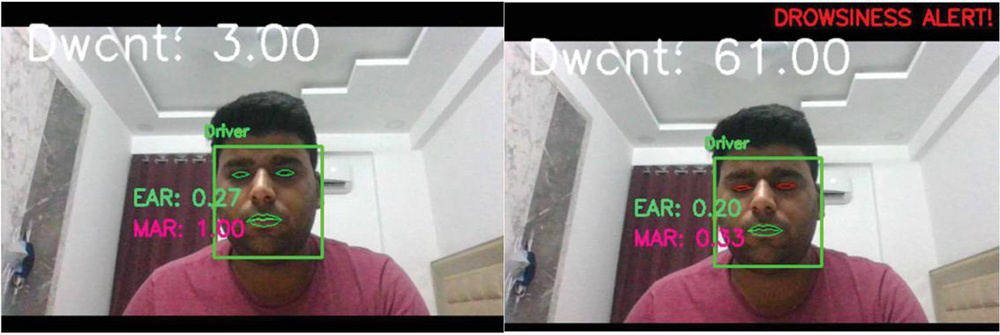
Figure 6(a): Real-time drowsiness check on live video – subject 1.

Figure 6(b): Frames v/s EAR – subject 1.
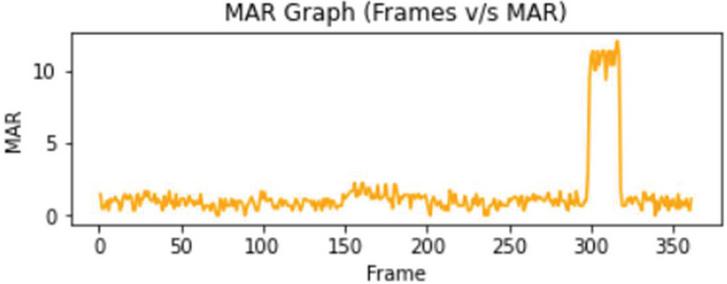
Figure 6(c): Frames v/s MAR – subject 1.

Figure 7(a): Real-time drowsiness check on live video – subject 2.
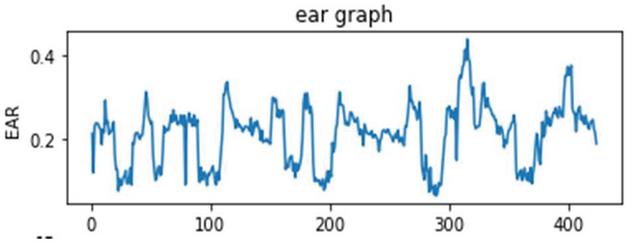
Figure 7(b): Frames v/s EAR – subject 2.
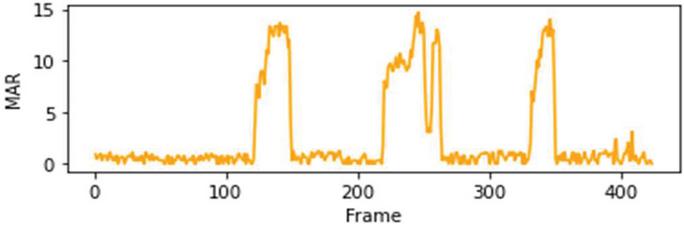
Figure 7(c): Frames v/s MAR – subject 2.
Figure 5(a) shows how our method is working on a recorded video present in the dataset that is recorded in real-time while driving the car. Figure 5(b) shows the analysis of the Frames vs Eye Aspect ratio and Figure 5(c) shows the frames vs Mouth aspect ratio. The dips in Figure 5(b) show that the Eye Aspect ratio is below the given threshold that is 0.22 in our case. The peaks shown in Figure 5(c) show that our Mouth aspect ratio is greater than the threshold value that is 10 in our case and if the eye is closed for a particular number of frames it will show the drowsiness alert. Dwcnt is a variable that stores the count of frames in which the driver is drowsy or feeling drowsiness or is yawning or yawning and drowsy. Both our models will work fine in all three cases.
Analysis on different subjects is performed and detection failure is calculated using Equation (3). Different persons with different eye sizes, gender, ages group, and with and without glasses are selected for analysis of the result and the overall comparison is shown in Table 1. Table 1 shows some decrease in accuracy for a person with small eye size and case if the person is wearing glasses. Figure 8 shows the graphical representation of comparison between accuracy for the different instances and is plotted between instances vs correct rate.
Table 1 Different instance of driver and features (dataset)
| Eye | Eye | Total | Detection | Correct | Average | |||
| Instances | Age | Gender | Size | Glasses | Frames | Failure | Rate (%) | Rate |
| Instance1 | 21 | Male | Large | No | 1700 | 168 | 90.11 | |
| Instance2 | 22 | Female | Small | No | 2000 | 229 | 88.5 | |
| Instance3 | 25 | Male | Medium | No | 1500 | 157 | 89.5 | 88.4 |
| Instance4 | 23 | Male | Medium | No | 1800 | 198 | 89.0 | |
| Instance5 | 22 | Male | Large | Yes | 1000 | 136 | 86.4 |
After performing the analysis on an already made dataset we checked our model on our pre-recorded videos to analyze the result. The videos are made in a home environment without a person driving. Figures 6(a), 7(a) show the real-time analysis. Figures 6(b) and 7(b) is showing the analysis of Eye Aspect Ratio vs Frames and Figures 6(c) and 7(c) show the analysis of Mouth Aspect Ratio vs Frames. The analysis of the result is shown in Table 2, and we are using Equation (3) for correct rate calculation and Figure 8 shows the graphical representation of our analysis.
Table 2 Different instance of driver and feature (live)
| Eye | Eye | Total | Detection | Correct | Average | |||
| Instances | Age | Gender | Size | Glasses | Frames | Failure | Rate (%) | Rate |
| Instance1’ | 22 | Male | Large | Yes | 1100 | 90 | 91.80 | |
| Instance2’ | 23 | Male | Small | No | 1000 | 125 | 87.5 | 89.1 |
| Instance3’ | 22 | Male | Medium | No | 1200 | 130 | 89.16 |
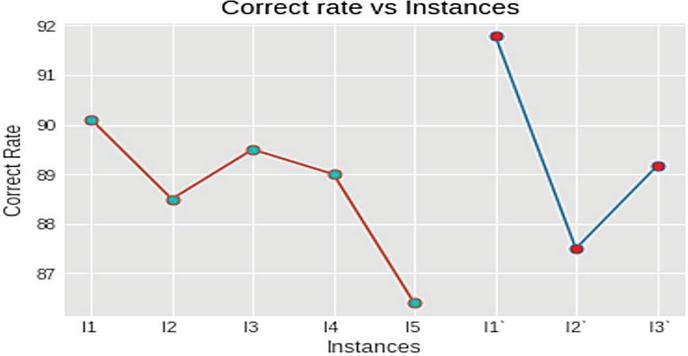
Figure 8 Instance v/s correct rate (dataset).
6 Conclusion and Future Work
From the results we get, it can be concluded that the Driver Drowsiness model implemented using EAR and MAR have an average correct rate of about 88.4 percent and can produce promising results. In this work, we extract the region of interest, and based upon the dataset available, scores were calculated to sense drowsiness. As compared to the CNN-driven model, the accuracy is lower, by 2.1 percent but the parameters considered are much reliable. As a future task, additional parameters can be employed for frames with low light. This can be also integrated with various public transport vehicles like cab services to monitor whether the driver is feeling drowsy or not and thus a way to decrease the number of accidents taking place. It can be also integrated with the hardware to automatically stop the vehicle if the driver is feeling drowsy even after the alarm.
References
[1] S. Sangle, B. Rathore, R. Rathod, A. Yadav, and A. Yadav, “Real-Time Drowsiness Detection System,” IOSR Journal of Computer Engineering (IOSR-JCE), pp. 87–92, 2018
[2] Das, K., & Behera, R. N. (2017). A survey on machine learning: concept, algorithms and applications. International Journal of Innovative Research in Computer and Communication Engineering, 5(2), 1301–1309.
[3] Alioua, N., Amine, A., Rziza, M., & Aboutajdine, D. (2011, August). Driver’s fatigue and drowsiness detection to reduce traffic accidents on road. In International Conference on Computer Analysis of Images and Patterns (pp. 397–404). Springer, Berlin, Heidelberg..
[4] Mehta, S., Dadhich, S., Gumber, S., & Jadhav Bhatt, A. (2019, February). Real-time driver drowsiness detection system using eye aspect ratio and eye closure ratio. In Proceedings of international conference on sustainable computing in science, technology and management (SUSCOM), Amity University Rajasthan, Jaipur-India.
[5] Soukupova, T., & Cech, J. (2016, February). Eye blink detection using facial landmarks. In 21st computer vision winter workshop, Rimske Toplice, Slovenia.
[6] Fuletra, J. D., & Bosamiya, D. (2013). A survey on drivers drowsiness detection techniques. International Journal on Recent and Innovation Trends in Computing and Communication, 1(11), 816–819.
[7] Mehta, S., Dadhich, S., Gumber, S., & Jadhav Bhatt, A. (2019, February). Real-time driver drowsiness detection system using eye aspect ratio and eye closure ratio. In Proceedings of international conference on sustainable computing in science, technology and management (SUSCOM), Amity University Rajasthan, Jaipur-India.
[8] Podder, S., & Roy, S. (2013). Driver’s drowsiness detection using eye status to improve the road safety. International Journal of Innovative Research in Computer and Communication Engineering, 1(7), 1490–1497.
[9] Omidi, F., & Saraji, G. N. (2016). Non-intrusive Methods used to Determine the Driver Drowsiness: Narrative Review Articles. International Journal of Occupational Hygiene, 8(4), 186–191.
[10] Nagargoje, S. S., & Shilvant, D. S. (2015). Drowsiness detection system for Car assisted driver using image processing. International Journal of Electrical and Electronics Research ISSN, 3(4), 175–179.
[11] Saini, V., & Saini, R. (2014). Driver drowsiness detection system and techniques: a review. International Journal of Computer Science and Information Technologies, 5(3), 4245–4249.
[12] K. C. Patel, S. A. Khan, and V. N. Patil, “Real-Time Driver Drowsiness Detection System Based on Visual Information,” International Journal of Engineering Science and Computing, Volume 8, No. 3, pp. 16200–16203
[13] Garcia, I., Bronte, S., Bergasa, L. M., Almazán, J., & Yebes, J. (2012, June). Vision-based drowsiness detector for real driving conditions. In 2012 IEEE Intelligent Vehicles Symposium (pp. 618–623). IEEE.
[14] Park, S., Pan, F., Kang, S., & Yoo, C. D. (2016, November). Driver drowsiness detection system based on feature representation learning using various deep networks. In Asian Conference on Computer Vision (pp. 154–164). Springer, Cham.
[15] Chisty, J. G. (2015). A Review: Driver drowsiness detection system. IJCST, 3(4), 243–252.
[16] Bhor, R., Mahajan, P., & Kumbhar, H. V. (2015). Survey on driver’s drowsiness detection system. International Journal of Computer Applications, 132(5), 16–19.
[17] Deepa, K. B., Chaitra, M., Sharma, A. K., Sreedhar, V. S., & Kumar, H. K. (2015). Accident prevention by eye blinking sensor and alcohol detector. International Journal of Engineering Research, 4(7), 351–354.
[18] Tejasweenimusale, Prof B, H. Pansambal, “Real Time Driver Drowsiness Detection System using Image Processing”, IJREAM, Vol. 02, Issue 08, 2016.
[19] Triyanti, V., & Iridiastadi, H. (2017, December). Challenges in detecting drowsiness based on driver’s behavior. In IOP Conference Series: Materials Science and Engineering (Vol. 277, No. 1, p. 012042). IOP Publishing.
[20] Anandan, P., & Sabeenian, R. S. (2013). Image Compression Techniques using Curvelet, Contourlet, Ridgelet and Wavelet Transforms–A Review. Biometrics and Bioinformatics, 5(7), 267–270.
[21] Nguyen, Q. N., Tho, L. T. A., Van, T. V., Yu, H., & Thang, N. D. (2017, June). Visual Based Drowsiness Detection Using Facial Features. In International Conference on the Development of Biomedical Engineering in Vietnam (pp. 723–727). Springer, Singapore.
[22] M. Hemamalini, P. Muhilan“Accident prevention using eye blink sensor”, Asia Pacific Journal of Research, vol. 1, Issue L11, 2017.
[23] El-Shazly, E. H., Abdelwahab, M. M., Shimada, A., & Taniguchi, R. I. (2016, October). Real time algorithm for efficient HCI employing features obtained from MYO sensor. In 2016 IEEE 59th International Midwest Symposium on Circuits and Systems (MWSCAS) (pp. 1–4). IEEE.
[24] Xu, Z., Qiu, X., & He, J. (2016, August). A novel multimedia human-computer interaction (HCI) system based on kinect and depth image understanding. In 2016 International Conference on Inventive Computation Technologies (ICICT) (Vol. 3, pp. 1–6). IEEE.
[25] Smirnov, A., Kashevnik, A., Lashkov, I., Baraniuc, O., & Parfenov, V. (2016, April). Smartphone-based identification of dangerous driving situations: algorithms and implementation. In 2016 18th Conference of Open Innovations Association and Seminar on Information Security and Protection of Information Technology (FRUCT-ISPIT) (pp. 306–313). IEEE.
[26] Chang, K., Oh, B. H., & Hong, K. S. (2014, January). An implementation of smartphone-based driver assistance system using front and rear camera. In 2014 IEEE International Conference on Consumer Electronics (ICCE) (pp. 280–281). IEEE.
[27] Xu, L., Li, S., Bian, K., Zhao, T., & Yan, W. (2014, February). Sober-Drive: A smartphone-assisted drowsy driving detection system. In 2014 International conference on computing, networking and communications (ICNC) (pp. 398–402). IEEE.
[28] Singh, P. K., Upadhyay, M., Gupta, A., & Lamba, P. S. (2021). CNN-Based Driver Drowsiness Detection System. In Concepts and Real-Time Applications of Deep Learning (pp. 153–166). Springer, Cham.
[29] Ambekar, S. N., Korde, M. R., & Patil, S. R. (2016). Driver drowsiness detection system. Int J Sci Technol Manage Res, 1(9).
[30] Singh, V., Elamvazuthi, I., Jeoti, V., & George, J. (2014, June). 3D reconstruction of ATFL ligament using ultrasound images. In 2014 5th International Conference on Intelligent and Advanced Systems (ICIAS) (pp. 1–5). IEEE.
[31] Bappaditya Mandal, Liyuan Liyuan Li, Gang Sam Wang, and JieLin “Towards detection of bus driver fatigue based on robust visual analysis of eye state”, IEEE transaction on intelligent transportation systems, 2016.
[32] Marimuthu, R., Suresh, A., Alamelu, M., & Kanagaraj, S. (2017). Driver fatigue detection using image processing and accident prevention. Int J Pure Appl Math, 116(11), 91–99.
[33] Hwang, T., Kim, M., Hong, S., & Park, K. S. (2016, August). Driver drowsiness detection using the in-ear EEG. In 2016 38th Annual International Conference of the IEEE Engineering in Medicine and Biology Society (EMBC) (pp. 4646–4649). IEEE.
[34] Joyce, G., Lilley, M., Barker, T., & Jefferies, A. (2016, July). Mobile application tutorials: perception of usefulness from an HCI expert perspective. In International Conference on Human-Computer Interaction (pp. 302–308). Springer, Cham.
[35] Kang, P., Wei, Y., & Wei, Z. (2017, May). Control system for granary ventilation based on embedded networking and Qt technology. In 2017 29th Chinese Control And Decision Conference (CCDC) (pp. 2275–2280). IEEE.
[36] Gupta, I., Garg, N., Aggarwal, A., Nepalia, N., & Verma, B. (2018, August). Real-time driver’s drowsiness monitoring based on dynamically varying threshold. In 2018 Eleventh International Conference on Contemporary Computing (IC3) (pp. 1–6). IEEE.
Biographies
Pritesh kumar Singh received Bachelor of Technology (B.Tech) in Information Technology from Bharati Vidyapeeth’s College Of Engineering (New Delhi) affiliated to Guru Gobind Singh Indraprastha University in 2021. He is currently working as Associate Software Engineer in Nagarro.
Archit Gupta received Bachelor of Technology (B.Tech) in Information Technology from Bharati Vidyapeeth’s College Of Engineering (New Delhi) affiliated to Guru Gobind Singh Indraprastha University in 2021. He is currently working as Associate Software Engineer in Nagarro.

Mayank Upadhyay received the bachelor degree (B-tech) in Information Technology from Bharati Vidyapeeth’s College Of Engineering, New Delhi, Guru Gobind Singh Indraprastha University in 2021. He is continuously working in the field of Data Science and AI which includes neural networks (ANN,RNN,CNN), openCV,Tensorflow,NLP etc.
Achin Jain is research scholar of University School of Information, Communication and Technology, GGSIPU, Sector 16 C, Dwarka, Delhi. He is currently associated as an Assistant Professor with Information Technology Department of Bharati Vidyapeeth’s College of Engineering. His main research areas are Sentiment Classification and Machine Learning using NLP techniques.

Manju Khari is an Associate Professor in Jawaharlal Nehru University, Delhi, India School of computer and Systems Sciences. She is also the Professor- In-charge of the IT Services of the Institute and has experience of more than twelve years in Network Planning & Management. She holds a Ph.D. in Computer Science & Engineering from National Institute of Technology Patna and she received her master’s degree in Information Security from Ambedkar Institute of Advanced Communication Technology and Research, formally this institute is known as Ambedkar Institute Of Technology affiliated with Guru Gobind Singh Indraprastha University, Delhi, India. Her research interests are software testing, information security, optimization, Image processing and machine learning. She has 70 published papers in refereed National/International Journals & Conferences (viz. IEEE, ACM, Springer, Inderscience, and Elsevier) and 10+ edited books from reputed publishers. She is also co-author of two books published by NCERT of Secondary and senior Secondary School.
Puneet Singh Lamba is currently working as Assistant Professor in Vivekananda Institute of Professional Studies-Technical Campus, School of Engineering and Technology. He received his PhD degree in Information Technology from USIC&T, GGSIPU. He obtained his master’s degree in Information Technology from USIC&T, GGSIPU. He completed his bachelor’s degree in Information Technology from USIC&T, GGSIPU. He has a total experience of 13 years. He has multiple publications in the area of Information Retrieval, Artificial Intelligence, and Image Processing. He has Qualified UGC NET(2015) and GATE (2010) Exam.
Journal of Mobile Multimedia, Vol. 19_2, 567–586.
doi: 10.13052/jmm1550-4646.19210
© 2022 River Publishers