MSI-RPi: Affordable, Portable, and Modular Multispectral Imaging Prototype Suited to Operate in UV, Visible and Mid-Infrared Regions
Ajay Arunachalam* and Henrik Andreasson
MRO LAB, Centre for Applied Autonomous Sensor Systems (AASS), Örebro University, Örebro, Sweden
E-mail: ajay.arunachalam@oru.se; henrik.andreasson@oru.se
*Corresponding Author
Received 25 August 2021; Accepted 02 November 2021; Publication 21 January 2022
Abstract
Digital plant inventory provides critical growth insights, given the associated data quality is good. Stable & high-quality image acquisition is critical for further examination. In this work, we showcase an affordable, portable, and modular spectral camera prototype, designed with open hardware’s and open-source software’s. The image sensors used were color, and infrared Pi micro-camera. The designed prototype presents the advantage as being low-cost and modular with respect to other general commercial market available spectral devices. The micro-size connected sensors make it a compact instrument that can be used for any general spectral acquisition purposes, along with the provision of custom selection of the bands, making the presented prototype design a Plug-nd-Play (PnP) setup that can be used in different wide application areas. The images acquired from our custom-built prototype were back-tested by performing image analysis and qualitative assessments. The image acquisition software, and processing algorithm has been programmed, which is bundled with our developed system. Further, an end-to-end automation script is integrated for the users to readily leverage the services on-demand. The design files, schematics, and all the related materials of the spectral block design is open-sourced with open-hardware license & is made available at https://github.com/ajayarunachalam/Multi-Spectral-Imaging-RaspberryPi-Design. The automated data acquisition scripts & the spectral image analysis done is made available at https://github.com/ajayarunachalam/SI-RPi.
Keywords: Spectral imaging technology, open-hardware, low-cost plant phenotype, image analysis, Raspberry Pi.
1 Introduction
1.1 Plant Phenotype Studies
The plant phenotype studies has seen tremendous research efforts over the past years, largely focusing on the quantitative estimation of the plant’s physical, morphological, and biochemical characteristics. The digital estimation of different measures & characteristics in plants is simply coined as plant phenotyping, in layman terms. The volume of digital content has risen exponentially with technology enhancement. Plant Phenotyping Systems is one of the key aspects of plant science and agricultural research directions. Over the decades, advancement in plant phenotyping has seen tremendous rise with high-end devices and technologies available. These systems provide value-addition as compared to the conventional techniques. Such, system automatically observes many plant samples to determine the characteristics of the plants. In this study, we discuss one such inhouse custom-build multi-spectral setup, to enable digital plant phenotyping.
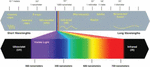
Technology driven agricultural practices & plant science research uses large volumes of vision data to extract insights and discover patterns [1]. Multispectral data provides crucial information & indirect mechanism for understanding the plant health and growth status. By breaking down the light spectrum into bands [2] (Refer Figure 1) determined by their associated wavelength, one can introspect how each band of light affects the plant health and their growth.
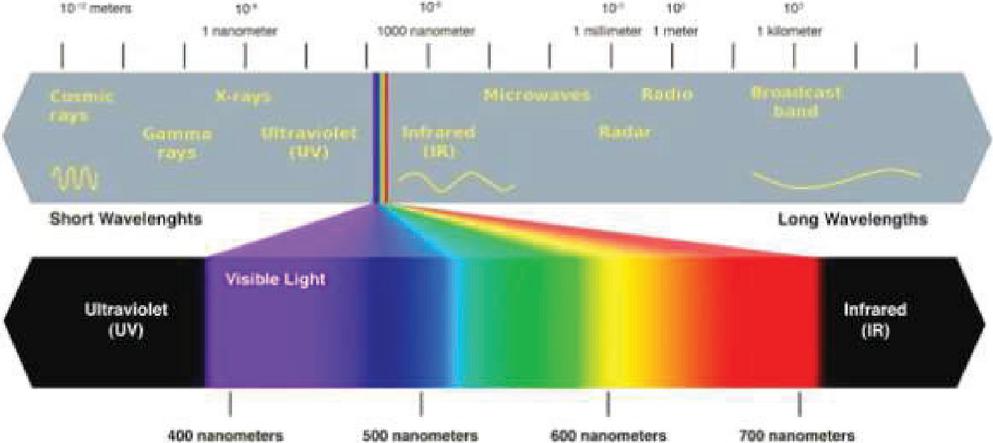
Figure 1 EM spectrum.

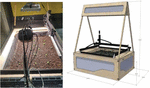
Figure 2 CNC cultivation testbed: Whole View (Right) and Camera View (Left).
1.2 Premise of Study
A 30 m lab environment at AASS, Örebro University was used where the robotic cultivation testbed is stationed (See Figure 2). The autonomous hotbed prototype (“LOMAS”), has growing area of 1.2 m, and is capable to contain plants up to 30–35 cm tall, that can be placed both in indoor/outdoor conditions. Similar systems also existed such as [3, 4]. But, our cultivation bed is well technologically advanced as it is equipped with a growing light (model TELOS-0006A with light output PPF (moles): 366), and further also accommodates different sensors (including gas, pH, ambient temperature, soil moisture, soil temperature, soil humidity, light, and quantum sensors) to maintain a controlled growing environment [5]. TELOS-0006A is a modern and efficient LED grow light, suitable for top-down growing applications in commercial greenhouses, and harsh environments. The average PPFD (umol/m/s) of 9.39 is obtained for a distance from the lamp of 4m with a coverage area (per unit) spanning 5.8 m 5.8 m. The cultivation bed is also equipped with a custom developed low-cost spectral imaging setup built with Raspberry Pi (Refer Figure 6) that was mounted over the physical manual manipulator arm [6, 7].
The growing bed was coupled with a fully automated 3-DoF robotic manipulator (Refer Figure 2), and the arm control is performed in Cartesian coordinates. The robotic arm is run by module composed of stepper motor, actuators, micro-controller, and single-board computer (Raspberry Pi). The low-level device control is run by Robot Operating System (ROS). The CNC-System operates with 3-DoF and uses firmata protocol & G-protocol for telemetry sensor and machine communication.
1.3 Contributions
The traditional spectral cameras are expensive, and the lab developed custom instruments includes complex illumination sources [10, 11]. Also, in most of the developed proposals, unstable light conditions hamper the image quality & largely requires parameterizing of the setup to negate the variable conditions which is very time-consuming. To alleviate these issues, we devised a cost-effective spectral model (also, referred as MSI-RPi) that is robust to different light conditions. Our spectral imaging unit has advantage of being non-expensive, portable, and easy to use. The choice of wavelength selection is filter-based making the prototype generic. The use of integrated micro-camera makes the system very compact.
The main contributions are summarized as follows: –
• An automated, robust, low-cost, portable, and easy-to-use plug & play multispectral imaging device is presented built using open hardware & open-source software’s.
• The images acquired from the spectral prototype were tested to validate the image quality obtained and were subject to other preliminary image analysis.
• We open-source the hardware design, automated image acquisition scripts, and image analysis studies, to leverage, if the design is adapted.
We organize the remaining part of the paper in the following order: Firstly, we introduce the environmental description of the system where it is currently in use. Then, in Section 2 we elaborate on the system design, and, in Section 3 the components used. In Section 4 a brief overview of the applicabilities are enlisted, further we also discuss on the related similar existing settings. Finally, Section 5 concludes the article.
2 Materials and Hardware Design
In this section, we describe the design of the prototype and the materials used in building the conceived spectral block.
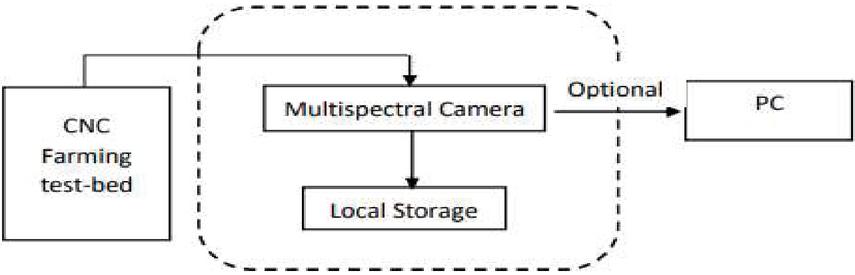
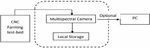
Figure 3 Block diagram of the spectral device with robotic cultivation test-bed layout.
2.1 System Architecture
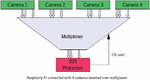
The workflow of the designed MS spectral device is as shown in Figure 3. The images of the sample or scene from the testbed is captured from one color camera (Raspberry Pi module v2), and three NoIR micro-camera (Raspberry Pi NoIR camera without IR filter) on which the different filters were mounted for selecting the bands of interest [12] designed one such multi-spectral setup that uses low-cost micro-camera.
The MSI-RPi setup is shown in Figure 4(Left) along with their corresponding acquired images for the different spectral bands. With skewed side-ways placement of the camera, the captured images were obtained with tilt as noticed in Figure 4(Right).

Figure 4 MSI-RPi setup (L–R: The camera setup front-view, Acquired images – 1st image (550 nm), 2nd image (1070 nm), 3rd image (RGB), 4th image (725 nm)).
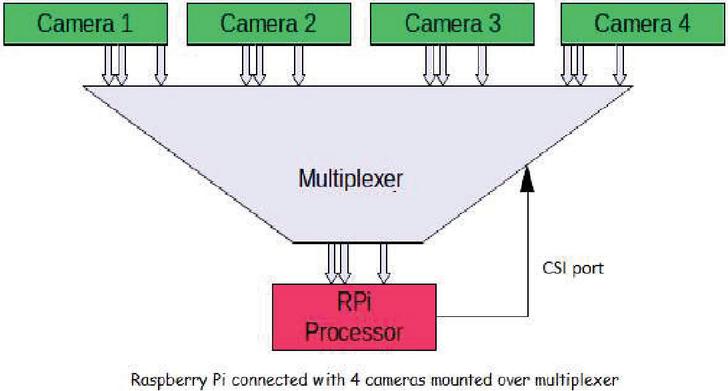
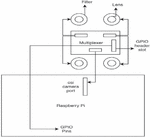
Figure 5 MSI-RPi configuration scheme.
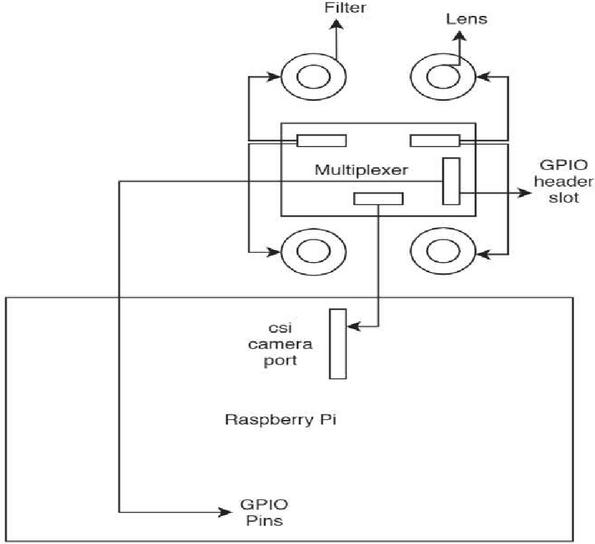
Figure 6 MSI-RPi schematic diagram.
2.2 Hardware Design
The conceived design is a low-cost, portable, and plug and play prototype based on the non-expensive components. The core design is based on open hardware’s. The cameras were interfaced to the multiplexer board with three GPIO pins while the multiplexer was interfaced on CSI port (Refer Figures 5 and 6). The complete finished prototype is presented in Figure 7.
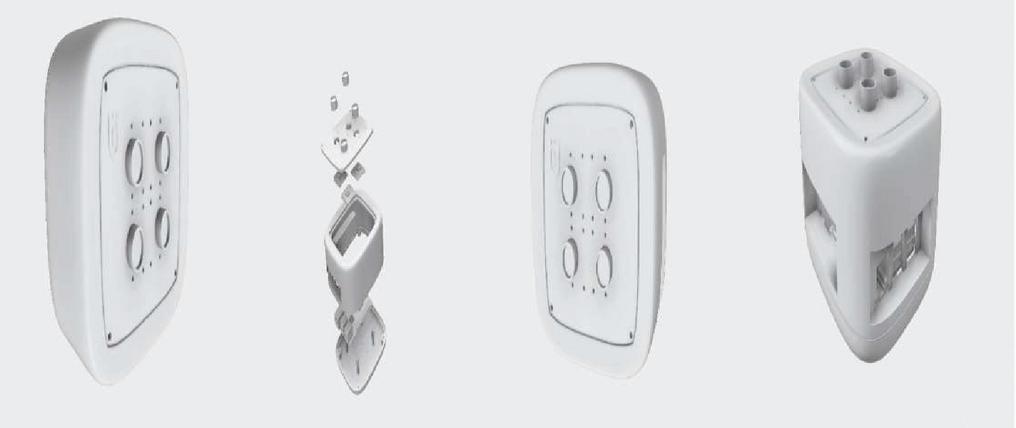
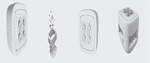
Figure 7 Multi-spectral finished product.
3 Components Used
Details of each of the used components in building the imaging setup are described below.
3.1 Raspberry Pi Computer, Pi Camera (Color & NoIR), and Multiplexer
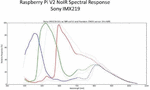
The Pi computer is a pocket-sized single board low-cost computer developed by Raspberry Pi Foundation (https://www.raspberrypi.org/). This state-of-the-art computing prototype is backbone of many practical deployed industrial systems used in varied fields. The image sensors used were RGB & NoIR Pi micro-camera that comes with two resolutions, i.e., 5M and 8M. The sensors were operated by Raspberry Pi that were mounted with different filter interfaced over a multiplexer. We used Arducam multi-camera adapter module v2.1 that is compatible with Raspberry Pi 4B/3B/3/2 model that works with 5/8/12.3 mega-pixel camera variants. Figure 8 shows the spectral sensitivity of the sensor.
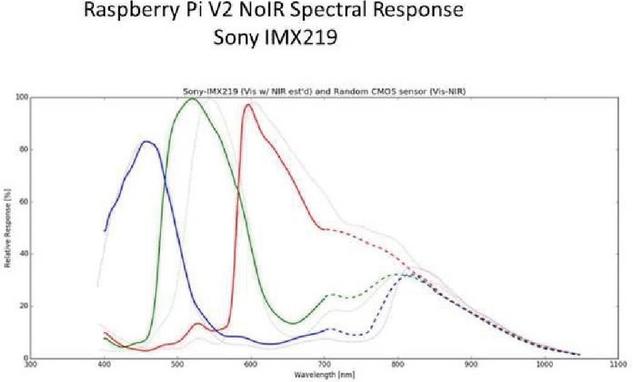
Figure 8 Sony IMX219 spectral response.
Table 1 Camera specifications
| FOV | Resolution | Aspect | Frame | ||
| Camera | Filter | (H, V) | (Pixels) | Ratio | Rates |
| RGB | 64, 49 | 3280 2464 | 4:3 | 1/10 FPS 15 | |
| NoIR | 550, 725, 1070 | ||||
| FOV – Field Of View, Filter: Spectrum Band (nm). | |||||
The technical specifications of the micro-cameras used along with the filter information is given in Table 1.
3.2 Filters
There are several imaging filters designed for agricultural applications. We discuss the ones used in our prototype given in Table 2. The used filters cover the visible range spectrum, and the mid InfraRed ranges. Alternatively, one can also use any desired specific filters as per their need to cater the UV light or SWIR spectrum bands. Table 2 below gives a short comparison, useful for easy interpretation about the utility of the filters.
Table 2 Filter’s overview
| Filter | Filter Type | Useful Range | Agricultural Utility |
| bp550 | UV-Block Visible Band Pass | 405–690 nm | Crop/Field inspection without discoloring the image |
| bi725 | Red Edge Band Pass | 717–732 nm | Selective control of 725 nm band useful for getting stress related status in terms of chlorophyll and nitrogen content |
| lp1070 | Long Pass | 1000–2300 nm | Help to improve contrast, resolution, and color separation while max. brightness of surrounding of the object under inspection or surveillance. |
4 Discussion
In this section, we provide the background, and the related works done. Further, we do a cost comparison analysis of the built prototype with the other similar commercial devices. Then, we introduce some example studies that can be explored within the scope of the hardware prototype. Spectral imaging analysis was introduced in the year 1985 as a technique for remote sensing [18]. Multispectral (MS) & Hyperspectral (HS) imaging in layman terms simply means acquisition of the same image along different wavelength regions [13]. Several works in the past were based on these (MS & HS) image analysis techniques [14–17]. One can select appropriate wavelength based on their requirement & objective of the study. The raspberry pi and the pi camera modules have also been widely used in the past [19] present a study on the use of raspberry pi for scientific applications. Several work using the Raspberry Pi camera have been done in the past applied to various fields [20–25]. A side-by-side comparison of the closely related works are given in Table 3.
Table 3 Side-by-side comparison of similar related spectral imaging setup for plant phenotype studies
| Choice of | Applicability to | ||||||
| Selection | Open-Hardware/ | Ease | Other Spectrum | ||||
| Ref, Year | Modular | Customizable | of Bands | Regions | Open-Source | of Use | Regions |
| [23], 2017 | Y | N | N | VIS, NIR | N | non-PnP | N |
| [24], 2017 | Y | Y | Y | UV, VIS, NIR | N | non-PnP | Y |
| [20], 2018 | N | N | N | VIS | N | non-PnP | N |
| [25], 2018 | Y | Y | N | VIS | Y | non-PnP | N |
| MSI-RPi (Ours) | Y | Y | Y | UV, VIS, NIR, IR SWIR | Y | PnP | Y |
| PnP – Plug and Play, UV – Ultraviolet, VIS – Visible, NIR – Near Infrared, IR – Infrared SWIR – Short wave Infrared. | |||||||
4.1 Cost Comparison
We did a cost analysis of the built prototype with few commercial cameras generally used. Table 4 shows the prices in USD. We further breakdown the costing of each individual sub-components used to give a detailed summary of the prototype in Table 5.
Table 4 Price comparisons
| # Of Bands | MS-RPi | Commercial Devices | Cost |
| 2-bands | – | DJI Inspire 4K | 4000 |
| 4-bands | 700 | Sequoia Multispectral Camera | 4300 |
| 5-bands | – | Mica Sense Red Edge Multispectral Camera | 4800 |
| 8-bands | 1000 | Any other brand with minimum 2 bands | 3500–5800 |
| 12-bands | 1200 | ||
| 16-bands | 1500 |
Table 5 MSI-RPi sub-component pricelist
| Components | Unit | Cost (USD) |
| Raspberry Pi 3 B | 1 | 42 |
| Pi RGB camera | 1 | 29 |
| Pi NoIR camera | 3 | 85 |
| Multiplexer | 1 | 55 |
| Filters | 3 | 300 |
| Materials & 3D Printing | 1 | 100 |
| Shipping | – | 80 |
| Total | 693 |
From the comparison, one can notice that for minimum two-bands on an average the prices range between 3500–5800 for the compared commercial systems.
4.2 Experimental Study
A scientific study was conducted at AASS Robot Lab, Örebro University, Sweden during autumn season in 2019. The experiments commenced from 03/10–19/11. The images from the spectral setup were logged every 30 minutes (which can be customized as per user’s requirement) inclined to the default timer ON-OFF settings of the artificial LED lamp used. A high-throughput phenotyping imaging setup, holding 4-channel, was designed to capture continuous images of pakchoi crop over the period of study operating between 8 am–6 pm, (i.e., 10 hrs. in total). The data analysis was done on the acquired images from the spectral setup, and a sample instance of each band is provided in our open-sourced repository. For validating the usability of the spectral imaging setup, firstly we investigated the quality of the acquired images. Different open-source available software’s like FIJI, PlantCV [26], OpenCV, etc. were used for this purpose.
4.2.1 Image quality analysis
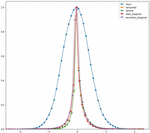
Image quality analysis & its related quality checks is a well-known researched area over the decades [27, 28]. It is divided into two streams, i.e., reference-based evaluation, and no-reference evaluation. The significant difference between both methods is that the former one depends on a high-quality image as a source to validate, while the latter one doesn’t require any base image as reference. For evaluating the quality, we performed a no-reference evaluation as we didn’t have any base image to evaluate the image quality with from any of those mentioned commercial cameras. BRISQUE is one of the well-known models used for no-reference evaluation. It uses image pixels to calculate different related features based on shape, variance, mean, etc. We calculate the MSCN coefficients, along with the products (pairwise) of neighbouring MSCN coefficients. Features needed to calculate image quality are the result of fitting the MSCN coefficients and shifted products to the GGD. We test the example image (Refer Figure 9) acquired from the spectral setup.

Figure 9 Acquired RGB image.
After calculating the MSCN coefficients, and the pairwise products, we verified the distributions as seen in Figure 10. It is observed that the distributions vary a lot. Next, a scale was used to verify the image quality that goes from 0–100. An image quality with score 100 means that the quality of the image is very sub-standard. For our analysed image, we got the score of 13.307 which signifies the stability and good quality of the acquired image.
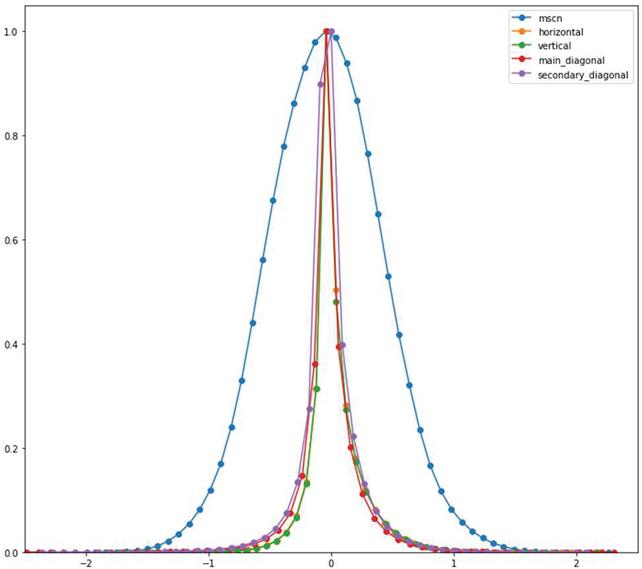
Figure 10 Distribution of the estimated features.
4.2.2 Documenting Plant Growth
Time-lapse data logging is a valuable tool for studying plants growth. The time-lapse images with multiple cameras help to explore the spatial and temporal parameters. The data logging was done at every 30-minutes interval and was automated with our developed script. The software for the image acquisition is developed in python v3.6.5 (https://www.python.org). The developed acquisition software was running on the Raspberry Pi and storing the images locally onto the SD card. The logging interval can be changed as per the end-user’s requirements. The images are stored with labels as: –
• C_1/2/3/4_CameraType_Band_YMD_HMS.png
where C_1/2/3/4 denotes Camera 1, Camera 2, Camera 3, Camera 4, the CameraType includes RGB/NoIR, and the band includes 550F, 1070F, 725F. The YMD denotes Year/Month/Date & HMS denotes Hour/Minute/Second.
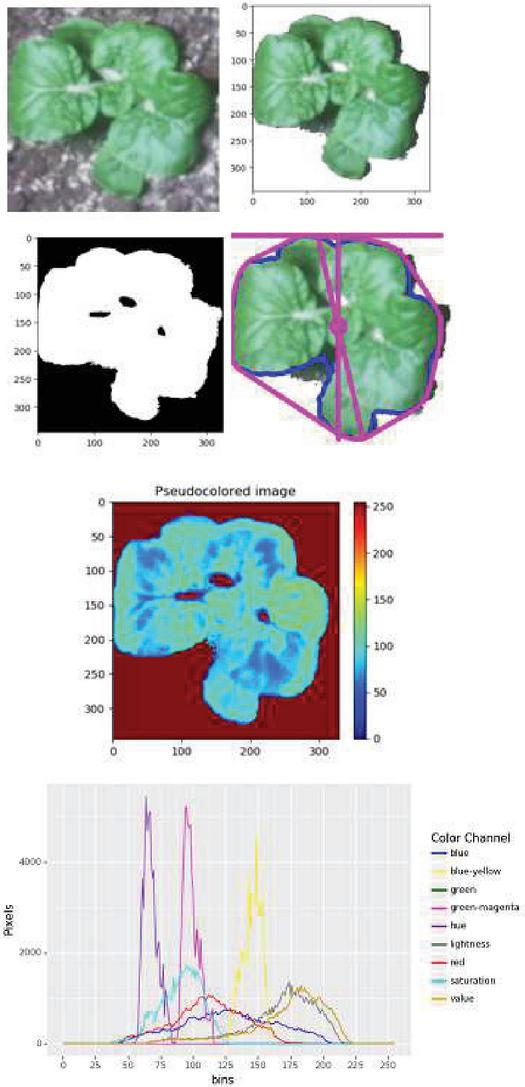
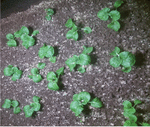
Figure 11 Camera-based insights (Left-Right: Extracted ROI, Sliced green ROI, binary threshold ROI, shape analysis, stress analysis, and color channel analysis).
This was inclined to the camera ordering on the prototype (Refer Figure 4). The images were updated daily to give users a live preview of what is happening on the field. So, one can monitor plant growth from anywhere without having to be physically present at the location.
4.2.3 Histogram Analysis
We performed histogram analysis to examine the distribution of image signal helping to select a value for binary thresholding. The plantCV tool was used for this purpose. We used an extracted ROI from the multi-plant frame image and examined it. Shape analysis of the image gives the outline, and boundary information of the plant. This can be tracked over a period to measure the plant growth. The plant boundary is represented in blue. The pseudo-coloured image helps to identify regions of growth and stress in the plant. The regions indicated in blue and green reflects good growth, and the regions in yellow and red depict the regions of stress. Finally, the distribution of signal is given by the color-channel analysis of the image as seen in the bottom (Refer Figure 11).
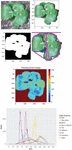
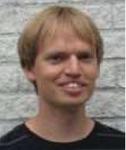
4.2.4 Overlapping Multi-Plant Frame Analysis
Detection of multi-objects (plants) in multi-plant frame becomes complicated & challenging given the plants overlap & become distinctly inseparable. We analysed such an overlapping multi-plant image frame with open-source phenotype tool like plantCV. We tested both the scenarios, i.e., non-overlapping (week-2 of the plant growth stage) and overlapping (week-7 before harvest). The results are shown in Figures 12 and 13. From the results, it is observed that widely used & popular phenotype tool ‘plantCV’ fails to identify and track the plants correctly when the plants start overlapping. One can certainly use machine learning model, i.e., say instance segmentation model to address this object overlapping task. But, it will require tons of labelled data for precise detection and recognition. To generate synthetic data labels useful for machine learning tasks, [29] proposed an AI-Assisted machine labelling solution inspired by weakly trained model and algorithmic data labelling module. Such labelled dataset can be leveraged to train an object detection model with overlapping instances.
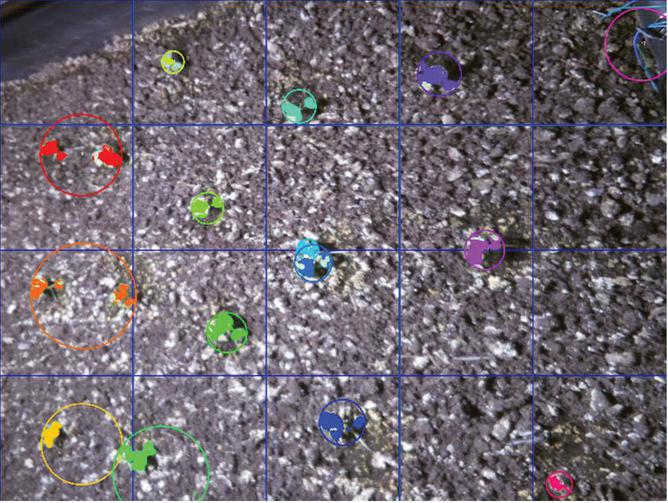
Figure 12 Non-overlapping scene (week-2).
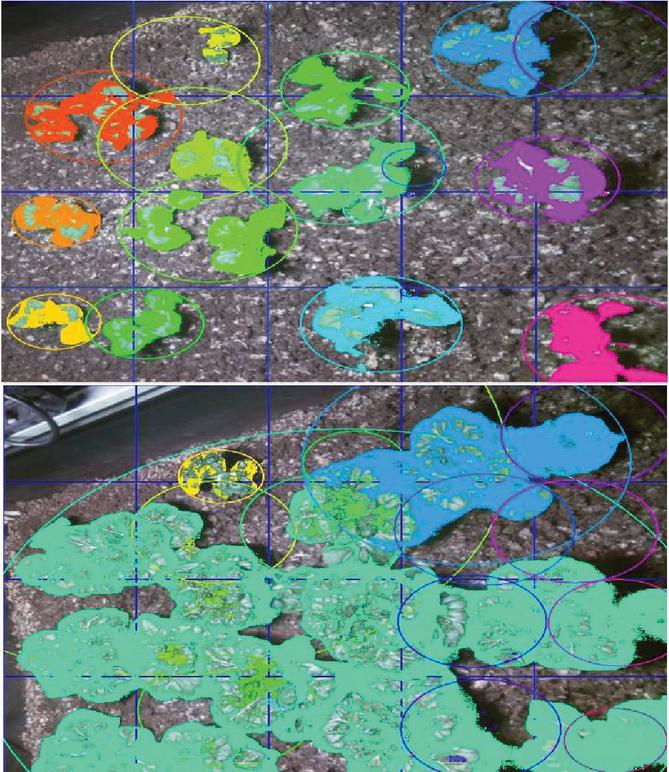
Figure 13 Overlapping scene (Top-Bottom: week-4, week-7).
4.2.5 Vegetation spectral traits
RGB images obtained from the imaging setup are suitable for estimating the well-known vegetation indices (e.g., GLI, SGR, RGR, NExG, NGRDI, etc.) using custom data processing algorithms. The estimated information can be outputted as csv file to be used for further analysis [1].
4.2.6 Morphological plant traits
Images obtained from the spectral camera are viable for extracting insights & quantifiable plant traits such as color, shape, leaf area, height, etc. with different open-source image analysis software’s like Fiji, plantCV, etc.
Our presented MSI-RPi, can further be used for any general spectral applications using the corresponding filters for the selection of the respective bands. Based on the above study & evaluations, it is observed that the spectral imaging setup obtained good-quality images that was further validated.
5 Conclusion
With open-source hardware components being cost effective, one can tap in the enormous potentiality to capitalize on building different utility products at ease. A cost affordable spectral imaging system is designed, developed, and tested towards the plant phenotype studies. A simple robust system is built with the readily available off-the-shelf open-source hardware components. The multi-spectral imaging system prototyped efficiently and effectively isolates Red, NIR, SWIR, and UV bands that are useful in monitoring health of the crops round-the-clock. This optical setup has a wide-angle field of view (FOV: 64) with almost constant and consistent spectral response. The key advantage of this design is its plug-nd-play flexibility making it convenient for changing the filters at ease whenever required, thereby potentially can be used for any application/domain & research studies. The setup is bundled with data acquisition module back tested with qualitative image analysis & evaluations making it suitable for the extended deployments. Our compact imaging prototype can be easily used for time-lapse imaging purposes, followed by the spectral analysis. The MSI-RPi size is about 5 4 2.5 cm and weighs less than 500 grams. The total cost of the conceived spectral block (4-channel) is less than USD 700. The images obtained were of good-quality, and stable which was further validated by doing qualitative analysis. Being lightweight the system can also be easily mounted over drones/UGV for large scale farm inspection. Further, it can be used with an extended options of 8, 12, 16 bands on a single unit. The proposed solution can scale well and provide remote monitoring service for any environment instantly.
Abbreviations
BRISQUE: Blind Reference less Image Spatial Quality Evaluator; EM: Electromagnetic; FOV: Field Of View; GLI: Green Leaf Index; GDD: Generalized Gaussian Distribution; HS: Hyperspectral; H: Horizontal; MS: Multispectral; MSCN: Mean Subtracted Contrast Normalized; NExG: Normalized Excess Green Index; NGRDI: Normalized Green-Red Difference Index; NIR: Near Infrared; RPi: Raspberry Pi; RGR: Red Green Ratio; ROI: Region Of Interest; SGR: Summed Green Reflectance; SWIR: Short-Wave Infrared; UV: Ultraviolet; V: Vertical; AI: Artificial Intelligence
Acknowledgments
We are thankful to Alfred Dalhberg for his continuous support with the experimental settings, and Per Lindström with the 3D-printing of the conceived low-cost multi-spectral prototype to make it a reality within short-time.
References
[1] A. Arunachalam, H. Andreasson, ‘Real-time plant phenomics under robotic farming setup: A vision-based platform for complex plant phenotyping tasks’, Computers and Electrical Engineering, June 2021.
[2] https://localharvestorganics.com/blog/f/plant-growth-and-the-light-spectrum
[3] FarmBot Genesis Documentation – https://genesis.farm.bot/v1.5/FarmBot-Genesis-V1.5/intro
[4] C.J. C. Moscoso et al., ‘Efficient implementation of a Cartesian Farmbot robot for agricultural applications in the region La Libertad-Peru’, IEEE Andean Conference, 2018.
[5] A. Arunachalam, H. Andreasson, ‘RaspberryPi-Arduino (RPA) powered smart mirrored and reconfigurable IoT facility for plant science research’, Internet Technology Letters, 2021.
[6] S. Paul et al., ‘Fuzzy Tuned PID Controller for Vibration Control of Agricultural Manipulator’, International Congress on Human-Computer Interaction, Optimization and Robotic Applications (HORA), 2020.
[7] S. Paul et al., ‘Fuzzy tuned pid controller for envisioned agricultural manipulator’, International Journal of Automation and Computing, 2021.
[8] M. Quigley et al., ‘ROS: an open-source Robot Operating System’, ICRA workshop on open source software, 2009.
[9] H-C. Steiner, ‘Firmata: Towards Making Microcontrollers Act Like Extensions of the Computer’, NIME, 2009.
[10] S. Tominaga et al., ‘Spectral imaging by synchronizing capture and illumination’, J. Opt. Soc. Am., 2012.
[11] H.T. Kim et al., ‘Design and fabrication of a 900–1700 nm hyper-spectral imaging spectrometer’, Opt. Commun., 2010.
[12] W. Huang et al., ‘Development of a multispectral imaging system for online detection of bruises on apples’, J. Food Eng., 2015.
[13] W. L. Wolfe, ‘Introduction to Imaging Spectrometers’, SPIE Press, 1997.
[14] R. Khodabakhshian et al., Development of a multispectral imaging system for online quality assessment of pomegranate fruit, Int. J. Food Prop., 2017.
[15] Lien et al., ‘A low-cost and open-source platform for automated imaging’, Plant Methods, 2019.
[16] A. Lowe et al., ‘Hyperspectral image analysis techniques for the detection and classification of the early onset of plant disease and stress’, Plant Methods, 2017.
[17] Da-Wen Sun, ‘Hyperspectral imaging for food quality analysis and control’, Academic Press, 2010.
[18] Goetz et al., ‘Imaging Spectrometry for Earth Remote Sensing’, Science, 1985.
[19] M. Pagnutti et al., ‘Laying the foundation to use Raspberry Pi 3 V2 camera module imagery for scientific and engineering purposes’, J. Electron. Imaging, 2017.
[20] J. Mei et al., ‘RPi macro camera: An inexpensive and handheld camera based on the Raspberry Pi computer for plant phenotype studies’, ASABE Annu. Int. Meet., 2018.
[21] Kilgus et al., ‘Application of a Novel Low-Cost Hyperspectral Imaging Setup Operating in the Mid-Infrared Region’, Proceedings, 2018.
[22] A. J. Hogan et al., ‘Low-cost multispectral vegetation imaging system for detecting leaking CO2 gas’, Appl. Opt., 2012.
[23] B. Valle et al., ‘PYM: A new, affordable, image-based method using a Raspberry Pi to phenotype plant leaf area in a wide diversity of environments’, Plant Methods, 2017.
[24] N. Lopez-Ruiz et al., ‘Portable multispectral imaging system based on Raspberry Pi’, Sens. Rev., 2017.
[25] C. J. Tovar et al., ‘Raspberry Pi–powered imaging for plant phenotyping’, Appl. Plant Sci., 2018.
[26] A. M. Gehan et al., ‘PlantCV v2: Image analysis software for high-throughput plant phenotyping’, PeerJ, 2017.
[27] Z. Wang et al., ‘Image quality assessment: From error visibility to structural similarity’, IEEE Trans. Image Process., 2004.
[28] A. Mittal et al., ‘No-reference image quality assessment in spatial domain’, IEEE Trans. Image Process., 2012.
[29] A. Arunachalam, V. Ravi, V. Acharya and T. D. Pham, ‘Toward Data-Model-Agnostic Autonomous Machine-Generated Data Labeling and Annotation Platform: COVID-19 Autoannotation Use Case’, in IEEE Transactions on Engineering Management, 2021.
Biographies

Ajay Arunachalam works as a researcher at the Centre for Applied Autonomous Sensor Systems (AASS), School of Science and Technology, Örebro University, Örebro, Sweden. His research areas include Machine Learning/Deep Learning, Opacity in AI systems, Optimization, Big Data, Computer Vision, NLP, and Distributed Systems & Wireless Networks.
Henrik Andreasson is an associate professor at the Centre for Applied Autonomous Sensor Systems (AASS), School of Science and Technology, Örebro University, Örebro, Sweden. He pursued his master’s from the Royal Institute of Technology (KTH), Stockholm, in 2001 and got his Ph.D. in computer science from Örebro University, in 2008. His research works are in mobile robotics, computer vision, and machine learning areas.
Journal of Mobile Multimedia, Vol. 18_3, 723–742.
doi: 10.13052/jmm1550-4646.18312
© 2022 River Publishers