Satellite Image Based Spatio-Temporal Variation Assessment in Captive Limestone Mines for Long-Term Viability
C. Venkata Sudhakar1,* and G. Umamaheswara Reddy2
1Department of ECE, Sree Vidyanikethan Engineering College, Tirupati, 517102, India
2Department of ECE, S.V.U. College of Engineering, S.V. University, Tirupati, 517502, India
E-mail: Sudhakar.chowdam@gmail.com; umaskit@gmail.com
*Corresponding Author
Received 29 August 2021; Accepted 06 November 2021; Publication 11 January 2022
Abstract
Land use and Land cover mapping are crucial applications for planning and disaster mitigation as well as prevention. Such mapping is possible via satellite imagery. Every pixel in the training set must be labelled in order to employ machine learning techniques combined with image analysis for such land cover mapping. This paper mainly concentrates on the mining sector for assessing sustainable land environmental management plans. Google Earth mapping is one of the most efficient, economical, and reliable methods for better understanding of spatial and temporal changes of limestone mining area with less human efforts. High-resolution Google Earth images are used in assessing the temporal changes of the Limestone mine area in Kadapa district from 2011 to 2020. Google Earth Pro open-source software was used to extract images of captive limestone mines, which were then clipped using a polygon tool to aid in the creation of a land-use region occupied by the active mining area. It was found that the active mining area variation rate is in the Dalmia Cement Limestone mine is 308.49% which is the highest compared to Bharathi Cement Limestone Mine mining area variation rate (240%), which is second, and the lowest mining area variation rate is found in the Niduzuvvi Limestone Block-1 area, which is 11.67%. Based on the overall impact of limestone mining in the study area, it is recommended that all stakeholders especially mine and cement plant owners; pay close attention to the area’s land environmental issues. The proposed technique is used for quality assessment in terms of prediction accuracy. The system so developed is observed to outperform existing systems implemented with the benchmarks counterparts.
Keywords: Limestone mining, cement industry, spatial-temporal change, Google Earth image, sustainable development.
Article Highlights
• Limestone Mine Temporal change assessment from space.
• High resolution Google Earth Images for 3 temporal resolutions.
• Industry Sustainable development and corporate social responsibility activities.
1 Introduction
Mining in developing countries provides much-needed jobs and revenue to both the local and national economies. In addition to the benefits of education, healthcare, and employment, the industry supplies infrastructure to communities and fosters ancillary industries. When it comes to distant areas, mining, on the other hand, tends to affect the social structure and traditions [1].
Limestone is a biological sedimentary rock that is known in nature as a non-metallic mineral of an inorganic origin. Calcite (calcium carbonate, CaCO3) and dolomite [CaMg(CO3)2] are the two most essential components of limestone. Limestone is used for a wide range of applications. Of the total consumption, 75% is used in the cement sector, 16% in the iron and steel industry, and 4% in the chemical industries. The remaining limestone is used in the paper, sugar, fertilizers, glass, rubber, and ferromanganese industries [2]. Figure 1 depicts the volume of limestone production in India from the financial year 2012 to 2020.
The majority of limestone is extracted from open quarries, resulting in the loss of vegetation and soil cover. Ecosystem service flows are disrupted. Toxic waste causes water pollution and some health concerns, whereas dust pollution is caused by automobile traffic on dusty mining roads, which affects nearby populations, and soil erosion around mines [3]. To address these problems, Fanan Ujoh et al. [3] studied the impact of limestone mining and cement manufacturing on vegetation for 32 years from 1996 to 2006 using multi-temporal satellite imagery from ILWIS and SPSS. Reforestation and improvements in limestone mining methods/techniques are among the initiatives advocated for sustainable mines. Elsy Ibrahim et al. (2020) [4] use freely accessible Sentinel-2 data to obtain a better knowledge of mining evolution in the research area from 2016 to 2019. They detect the locations of mining zones, such as mined bare soil and mining ponds, as well as other key land covers, such as vegetated and non-vegetated areas, and water bodies, during the research. Tim T. Werner et al. [5] used publicly accessible Google Earth images to identify the area occupied by open-cut pits, tailings storage facilities (TSFs), waste rock dumps (WRDs), infrastructure areas, and water storage ponds of 295 mines across 43 nations to better understand the spatial composition of mine regions. Haoteng Zhao et al. (2018) [6] used a combined method of modified random forest classification and quarry region analysis on long time-series data from the Landsat archive to investigate the annual change in the quarry area for 34 years from 1984 to 2017. Observations were used to reveal a relationship between quarry changes and socioeconomic dynamics. We briefly illustrated captive Limestone mines in the following parts, as well as the techniques and results of mapping and statistical analysis, and conclusions for a better understanding of captive Limestone mines land use.
1.1 An Overview of India’s Cement Sector
India is the world’s second-largest cement manufacturer; accounting for over 8% of global installed capacity in 2019. It is a vital part of the Indian economy. Indian cement manufacturers prescribed that cement grade limestone should have the following chemical composition CaO 42% (min), AlO 1 to 2%, FeO 1 to 2%, SiO 12 to 16%and MgO 4% (max). As of 1.4.2015, the total Reserves/Resources of limestone of all types and grades in the National Mineral Inventory (NMI) database based on the United Nations Framework Classification (UNFC) system is determined to be 2,03,224 million tonnes, of which 16,336 million tonnes (8%) are classified as Reserves and 1,86,889 million tonnes (92%) as available Resources. Karnataka is the most resource-rich state, accounting for 27% of total capital, followed by Andhra Pradesh and Rajasthan (12%), Gujarat (10%), Meghalaya (9%), Telangana (8%), Chhattisgarh, and Madhya Pradesh (5 percent each). The remaining 12% is shared by other states. ([7], https://ibm.gov.in/).
The production capacity of cement in India reached 329 million tonnes in FY20 and is expected to cross 381 MT by FY22. However, the consumption stood at 327 million tonnes in FY20, will increase to 379 MT by FY22, and is expected to reach 410.21 million tonnes by FY 2024, growing at a compound annual growth rate (CAGR) of 3.83% over the FY2019-FY2024 period due to the Government of India’s strong emphasis on infrastructure development to boost economic growth and its goal of 100 smart cities, demand in various sectors (such as industrial, housing, and commercial construction)(https://www.ibef.org/industry/cement-india.aspx). Figure 1 shows Limestone and Cement production volume in million metric tonnes in India from the financial year 2012 to 2020.
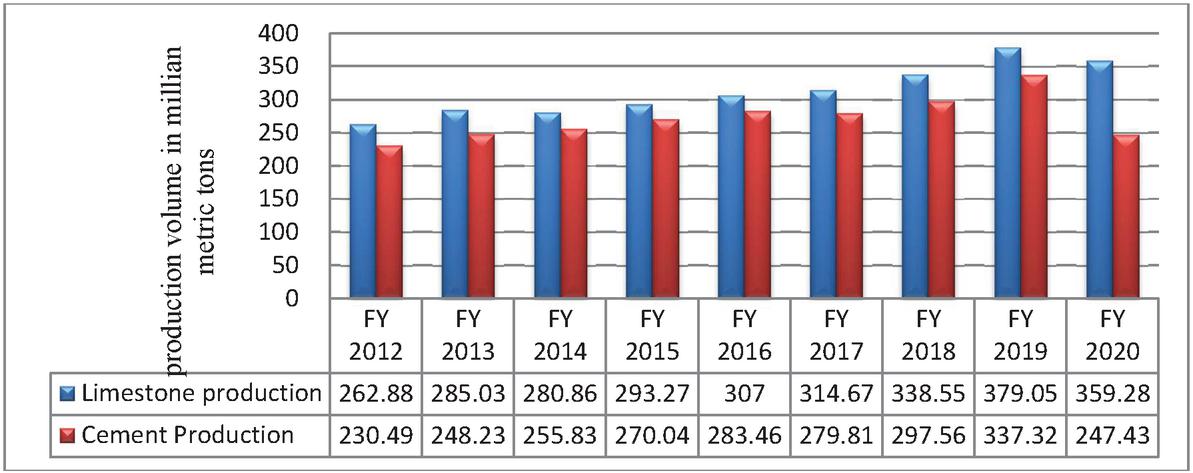
Figure 1 Limestone and Cement production volume in India from the financial year 2012 to 2020 (Source: https://www.statista.com/statistics/669208/india-limestone-production-volume/).
1.2 Mining Industry Sustainable Development Principles
Limestone extraction and exploration, as well as its use in cement manufacturing, have a significant effect on climate change and the environment. Natural resource loss, soil, water, and air pollution, landscape changes, and agricultural destruction are only a few examples. As a result, in the mining industry, climate and environmental sustainability (i.e., social, economic, and environmental dimensions) are critical [8].
In 2001, the International Council on Mining and Metals (ICMM) developed principles for the mining industry’s long-term sustainability (https://www.icmm.com/mining-principles). Sustainable mining practices include Economic development, Environmental leading practices, safety excellence, Optimum resource utilization, and Community engagement and support. These principles and practices are inculcated in the mining industry to ensure sustainable mining as well as the prevention of environmental degradation [9]. Environmental Impact Assessment, Ecological Risk Assessment, Ecological Footprint, GHGs Footprint [10], Material Flow Analysis, and Life Cycle Assessment are some of the instruments proposed by mine management for investigating the environmental performance of mining activities and evaluating ecological and social impacts over the mine’s entire lifespan [4].
1.3 A Brief History of the Study Area
The district (Cuddapah) was established under British rule in the early nineteenth century (1808), and it was renamed YSR Kadapa district in 2010 as a tribute to the late Andhra Pradesh Chief Minister Sri Dr. Y.S. Rajasekhara Reddy. The Kadapa district is located between 1343 and 1514 north latitude and 77 51 to 79 29 east longitude. Nellore, Anantapuramu, Kurnool, and Chittoor surrounded it on the east, west, north, and south, respectively. The District’s geographical area is 15,359 square kilometers [11].
The District is rich in barytes, asbestos, and limestone minerals. According to a 1983 geological survey of India study, there are 30 million tonnes of lead, 74 million tonnes of barytes, 27 thousand tonnes of asbestos deposits, and 4078 million tonnes of limestone (https://www.mines.ap.gov.in/miningportal/). Kadapa is well-known for its “Kadapa stone,” which is used in building construction and slabs throughout India, especially in the south [12].
Andhra Pradesh holds roughly one-third of the country’s total cement grade limestone reserves and is the country’s second-largest cement producer with 19.6 MT of limestone resources. Kadapa is one of Andhra Pradesh’s largest cement producers with a capacity of 11.238 MT per annum [7]. Cement-grade limestone deposits abound in the mandals of Yerraguntla, Jammalamadugu, and Kamalapuram (http://apmdc.ap.gov.in). Cement grade Limestone Mine (CGL mines) freehold areas and Mining locations are depicted in (Table 1) and Figure 2, respectively.
Table 1 Cement grade Limestone Mines (CGL Mines) [12]
| Name of the Mine | Name of the | CaptiveMine | |
| S.No. | Lease Holder | Limestone Mine | Area (Hectares) |
| 1. | India Cement Ltd, Chilamkur | Coromandel Limestone Mine South | 336.14 |
| Coromandel Limestone Mine North | 266.00 | ||
| 2. | India Cement Ltd, Yerraguntla | Niduzuvvi Limestone Mine | 335.06 |
| 3. | Zuari Cement Ltd, Yerraguntla | Zuvari cements Limestone mine | 656.68 |
| 4. | Bharathi Cement Corporation Ltd, Nallingayapalli | Bharati cements Limestone Mine | 827.57 |
| 5. | Dalmia Cement (Bharat) Ltd. Chinnakommerla | Dalmia Cements Limestone Mine | 407.05 |
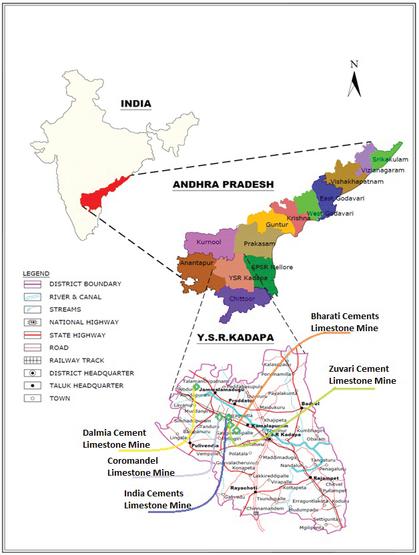
Figure 2 Cement Grade Limestone Mines in Kadapa district.
2 Captive Cement Grade Limestone Mines
2.1 Coromandel Limestone Mine
The India Cements Limited (ICL) Chilamkur owns the Coromandel Limestone Mine. It is adjacent to a cement factory, with a total lease area of 602.14 hectares. The Captive Mining Lease covers 266 hectares in the north and 336 hectares in the south. Between these two blocks is a railway track. The area lies between 14 38 51.0N to 14 40 31.1N in latitude and 78 27 55.4E to 78 29 40.4E in longitude with an average elevation of 175 m above Mean Sea Level (MSL). In 1984, mining activity began. The production rate of limestone is 7.7 MTPA. Mineral reserves and resources are estimated to total 276.06 million tonnes, according to estimates. The mine lease will expire on November 17, 2031. Out of the total lease area of 602.14 ha, an area of 0.16 ha will be held for infrastructure; 24.05 ha for roads; 67.52 ha for temporary topsoil storage; 12.10 ha for Barrier zone; 68.28 ha for railway safety zone; 54.53 ha for Non-Mineral zone; 181.737 ha for Undistributed area [13]. Figure 3 shows images of the ICL Chilamkur plant, mine surface texture, and plant and mine satellite images.
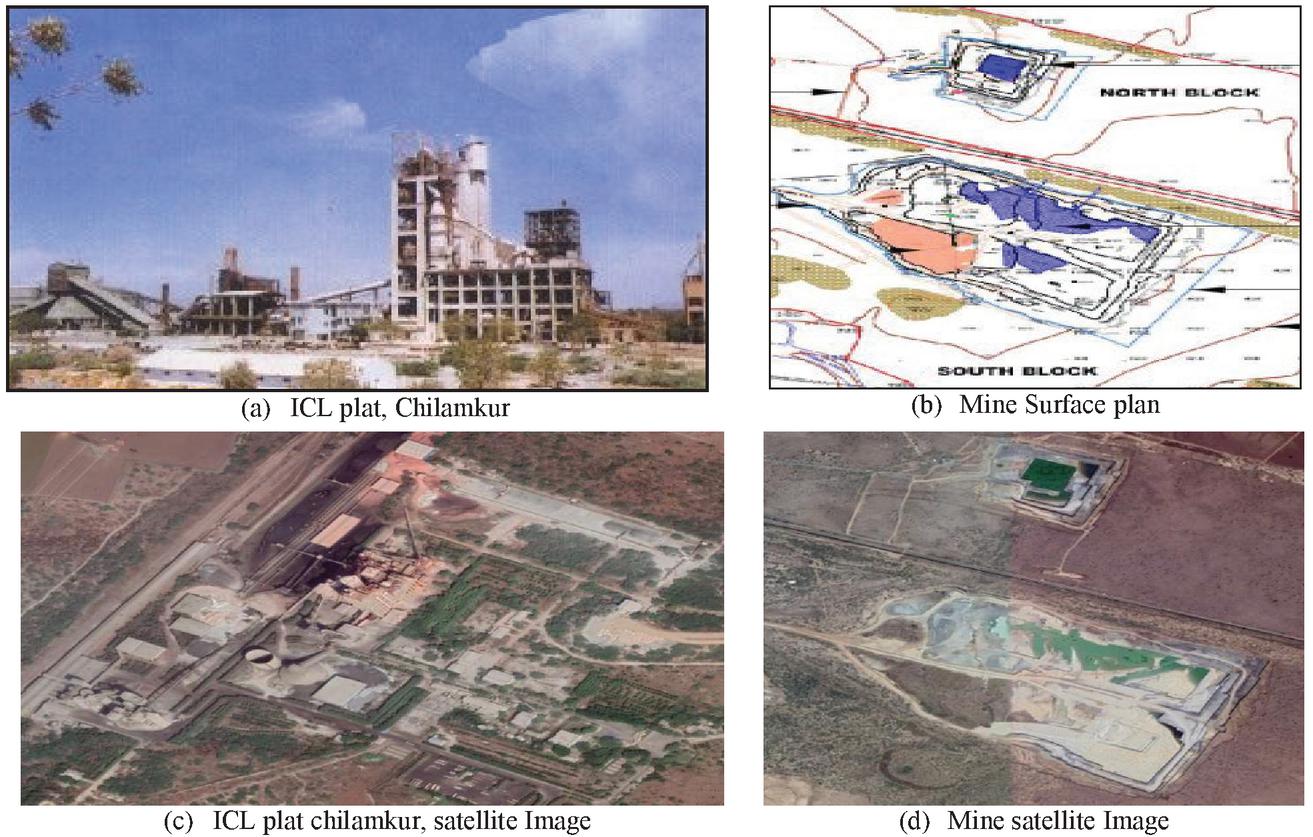
Figure 3 ICL chilamkur plant, Mine surface Plan, plnat and Mine satellite images.
2.2 Niduzuvvi Limestone Mine
Niduzuvvi Limestone Mine is a captive mine of The India Cements Limited Yeraaguntla’s plant. The mine’s total lease area is 335.06 Ha and is situated next to the plant in Niduzuvvi village. With an altitude of 100 m above mean sea level, the Mine site is located between the Latitudesof 143748.8 and 143919.9 North and the Longitudes of 782923.4 and 783114.2 East. In 1979, a mining operation began. Within the mining lease area, there are 83.98 million tonnes of mineable reserves. With a production rate of 1.0MTPA, the current reserve will last for 83 years over the mine’s lifetime. Out of the total lease area of 335.06 Ha, an area under the mining at the end of mining will be 98.86 Ha, an Overburden Dump will be 12.02 Ha, Infrastructure will be 1.04 Ha, Roads will be 3.02 Ha, Green Belt will be 35.96 Ha, and there will be 183.80 Ha of undisturbed natural vegetation [13]. The ICL Yerraguntla plant, mine surface plan, and satellite images of the plant and mine are shown in Figure 4.
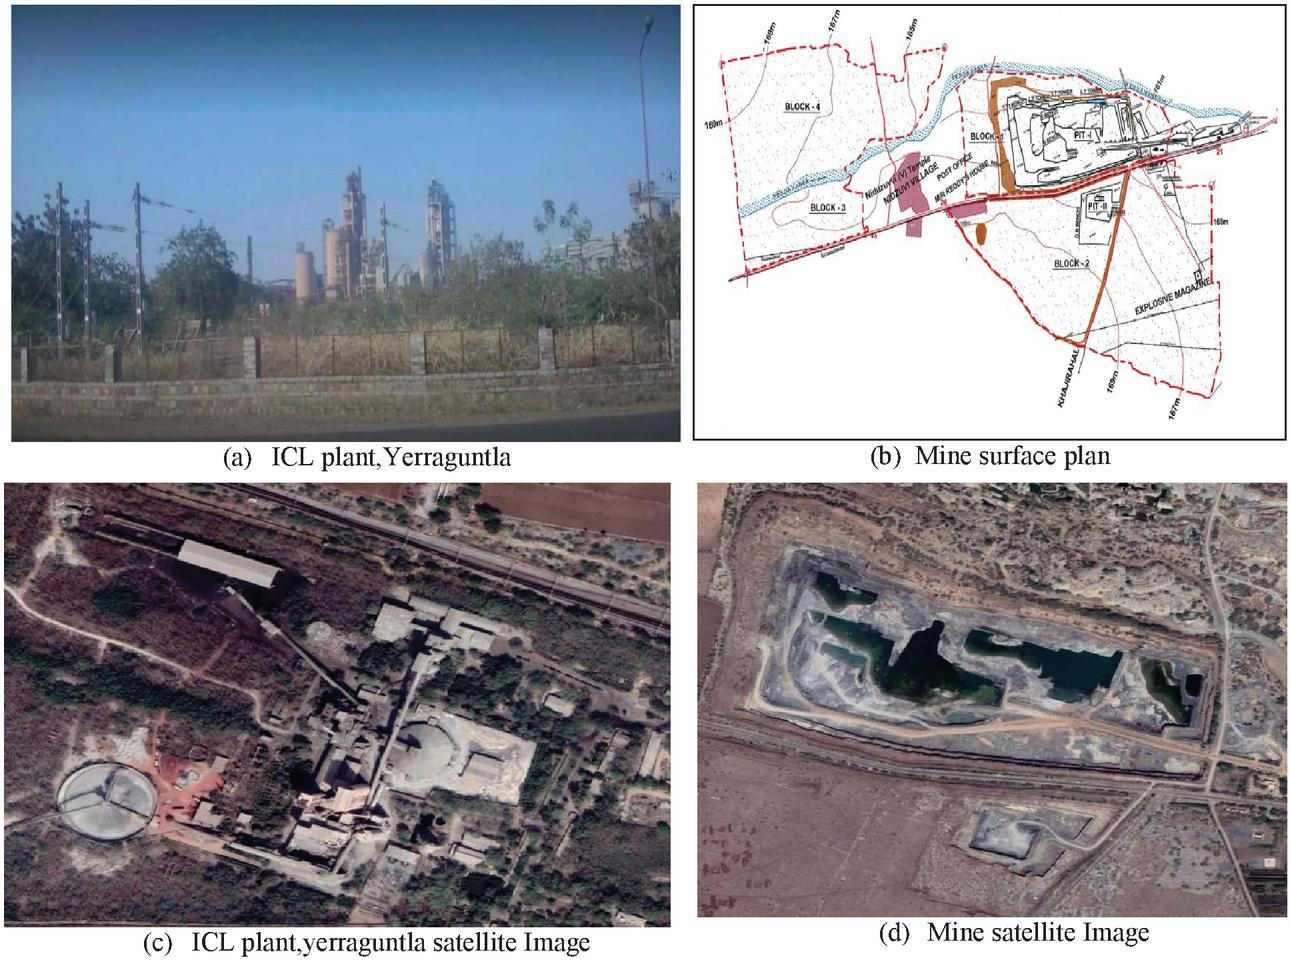
Figure 4 ICL Yerraguntla plant, mine surface plan, plant and mine satellite images.
2.3 Zuvari Cement Limestone Mine
Zuvari cement Limited operates a captive limestone mine in Krishnanagar, Yerraguntla, with latitudes ranging from 143610 to 143830 N and longitudes ranging from 783124 to 783330 E. The mine lease covers 656.68 hectares. The Zuari Limestone Mine began operations in 1984. The current capacity of the limestone mine is 7.0 million tonnes per year. Out of the total lease area of 656.68 hectares, the area of excavation at the end of mining will be 534.0 hectares, with 35 hectares allotted for infrastructure, 25 hectares for roads, and 62.68 hectares allocated for green belt production. There are 178.856 MT of mineable reserves. At the proposed rate of production, mine life would be 22 years. Mines would be dug to a depth of 27 meters below ground level (bgl), ([14], http://moef.gov.in/en/). Figure 5 shows the Zuvari cement plant, mine spatial view, and satellite images of the plant and mine.
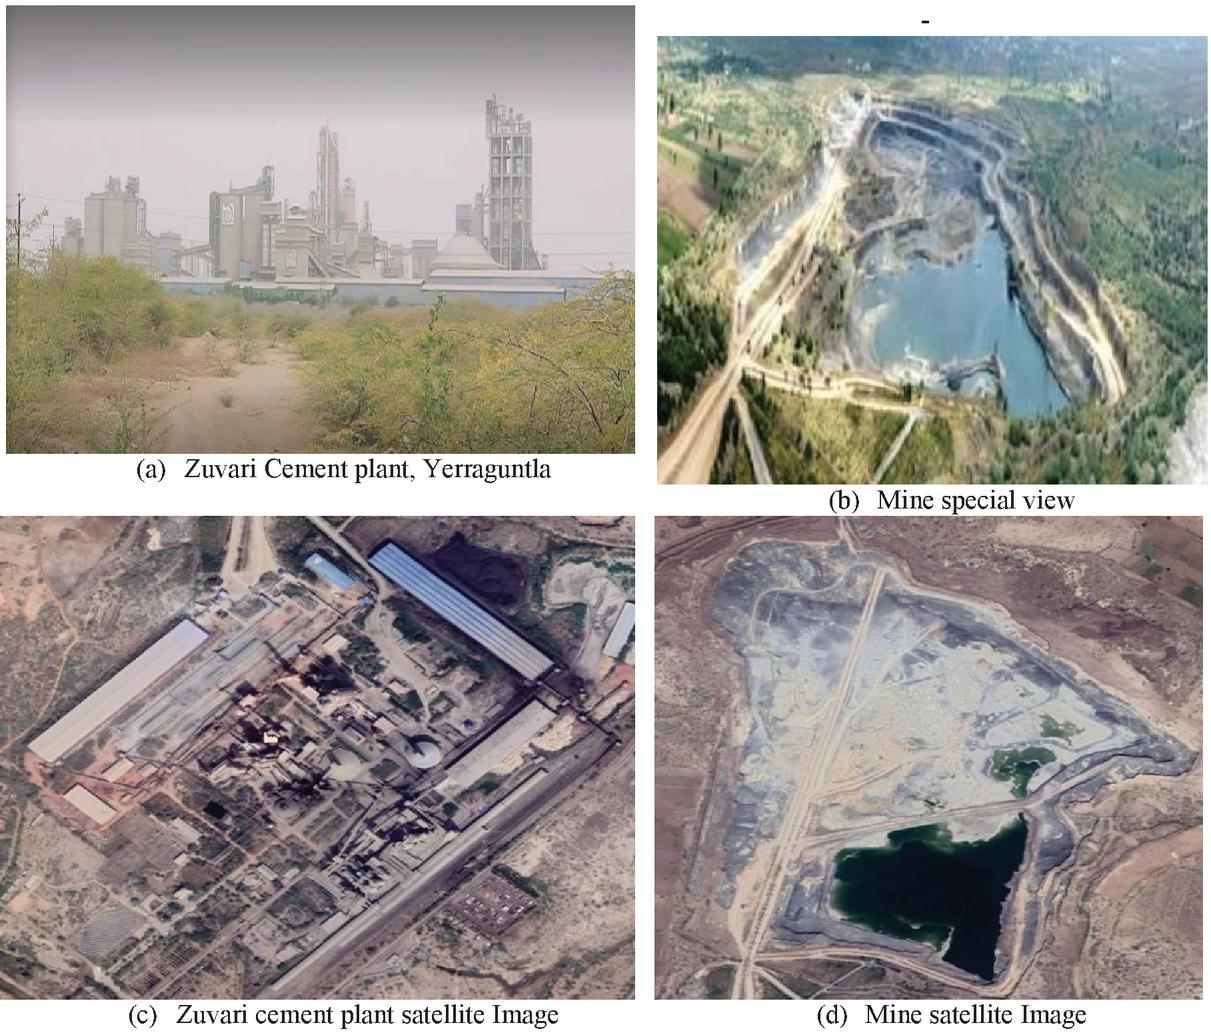
Figure 5 Zuvari cement plant, mine spacial view, plant and mine satellite images.
2.4 Bharathi Cement Limestone Mine
The mine is located in Nallalingayapalli Village, Kamalapuram Mandal, in the YSR Kadapa District of Andhra Pradesh, to meet the limestone requirement for the Bharathi Cement Corporation Private Limited, which was established in 2006, and is located at a latitude of 143402 to 143628 North and a longitude of 783335 to 783651 East at an elevation of 150 m above mean sea level. The mine lease covers 632.28 hectares. The current capacity of the limestone mine is 5.0 million tonnes per year. Mine lease for 30 years, until October 28, 2038 [15]. Figure 6 shows the Bharathi cement plant, mine surface design, and satellite images of the plant and mine.
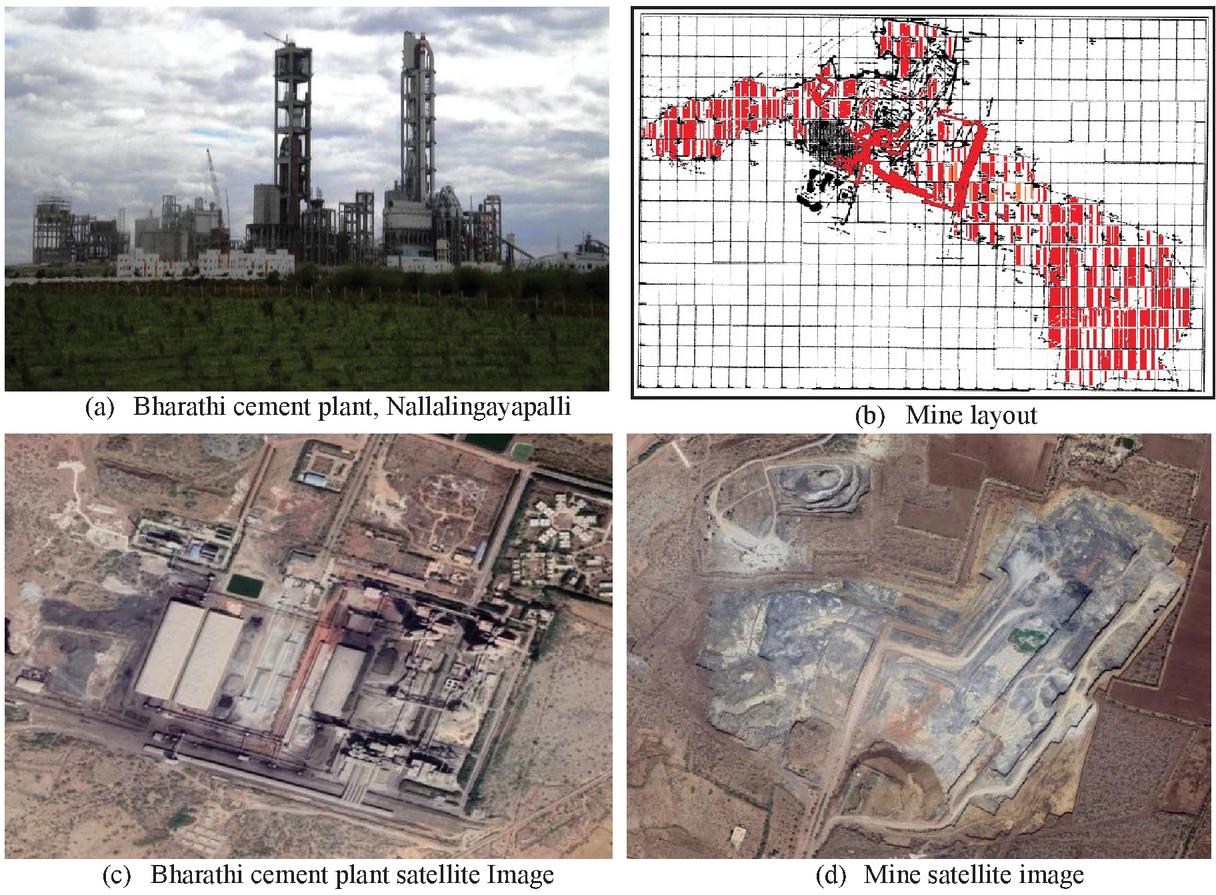
Figure 6 Bharathi cement plant, mine surface plan, plant and mine satellite images.
2.5 Dalmia Cement (Bharat) Limestone Mine
The mine located in Villages Talmanchipatnam and Nawabpet in Mylavaram Mandal, YSR Kadapa District, Andhra Pradesh near Dalmia Cement (Bharat) Ltd. to fulfill the limestone requirement of Dalmia Cement (Bharat) Limited, (https://www.apiic.in/) and same is identified between Latitude from 145618.3 to 14571.6 N and Longitude from 781853.9 to 782127.2 E. The Mine lease area is 407.05 Ha. In the year 2008, the Limestone Mine was formed. The annual production rate of limestone is 8.77 million tonnes. The Mining Lease is valid for 50 years [16]. Figure 7 depicts the Bharathi cement plant, mine surface design, and satellite images of the plant and mine.

Figure 7 Bharathi cement plant,mine surface plan, plant and mine satellite images.
3 Proposed Research Methodology
3.1 Data Collection
The USGS Earth Explorer, Landviewer, Copernicus Open Access Hub, Sentinel Hub, and others (https://eos.com/blog/free-satellite-imagery-sources/) provide satellite data for free to encourage research in the use of remotely sensed data. It does, however, have some limitations. The first is that the images only have a lower and medium spatial resolution in the range of 10 m to 1000 m, and are collected from sensors including Landsat Multispectral Scanner (MSS), Landsat Thematic Mapper (TM), Enhanced Thematic Mapper Plus (ETM), Operational Land Imager (OLI), Sentinel-2 MODIS, and others. Another limitation is that the most recent satellite data might not be available. Purchase recent high-resolution satellite imagery with spatial resolution less than or equivalent to 1 m from Indian remote sensing satellites like Cartosat-2 or US-based satellites like Worldview-2 or Quickbird to address the above limitations with satellite data providers. However, purchasing such high-resolution images could be more costly [17].
Another option is to download Google Earth Pro and utilize the satellite pictures to create a land use map for the area of interest in QGIS open source shown in Figure 8 based on image elements such as Color, Texture, Shape, Size, Pattern, and Association.
Determination of land-use area in Google Earth pro
1. Open Google Earth.
2. Search for a place of interest.
3. Create a polygon using the polygon tool.
4. Measure the area of a created polygon using the measurement tab.
5. Complete area measurement by double-click on the last point, or click done.
6. Repeat the steps 2 to 5 for various Limestone mine classes of interest
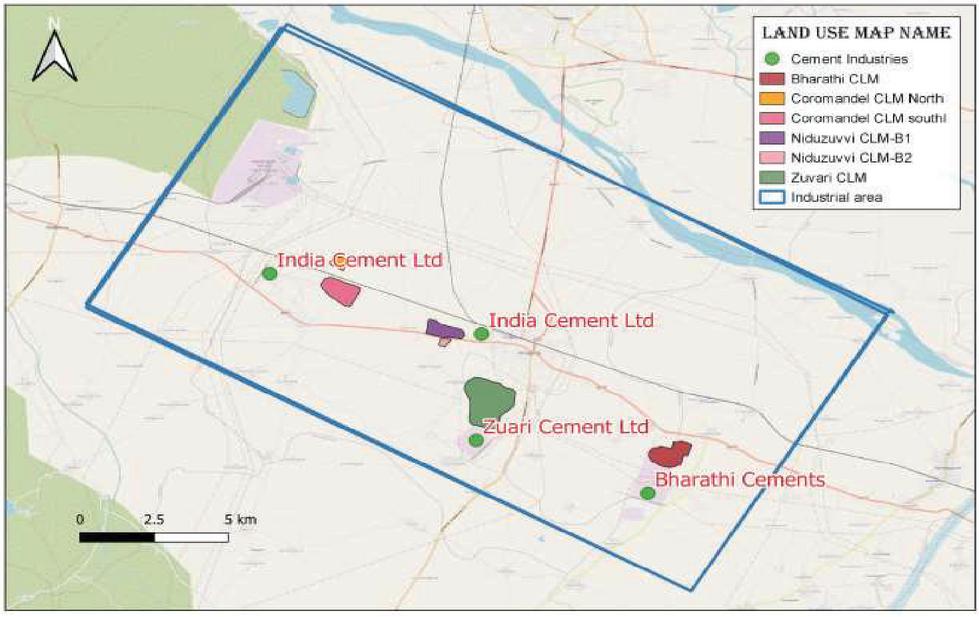
Figure 8 Captive Limestone Mine land use map prepared using Google Earth Images.
Google Earth has the advantage of displaying the most recent satellite imagery with a spatial resolution of less than 1 meter. In recent years, most popular image processing and GIS application software like ERDAS IMAGINE, ENVI, ArcGIS, and others, have added tools to visualize and import Google Earth images recent years. Another benefit of Google Earth is that it offers photographs from various periods, which would be extremely useful in land-use change identification studies [16, 17,21]. In the mining and cement industries, fieldwork has been conducted to determine the area under mining, an Overburden Dump, infrastructure, mine roads, green belt growth, and undisturbed natural vegetation.
3.2 Data Processing
Based on a detailed review of the Limestone mines’ environmental clearance reports, pre-feasibility reports, district survey reports, and satellite image processing-related literature, it is clear that remote sensing seems to be the only tool useful for monitoring temporal changes. As a result, Google Earth satellite images were chosen as the study database, and time-series changes for the years 2011, 2016, and 2020 were mapped, analyzed, and confirmed with ground truth data using GPS survey, field photos, and mine and industrial management. Figure 9 shows the overall methodological framework.
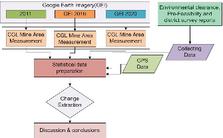
Figure 9 Steps in research methodology.
4 Environmental and Social Impacts
The mining operation, in conjunction with the cement factory, has improved the economic status of the people living near the mine. Cement sector development will boost the country’s GDP, but the processes will affect the climate, human health, and the socioeconomic status of the people living nearby and around the world. In the mining and cement industries, waste is produced (solid waste, CO2emission, etc.) at every stage of the process, causing environmental degradation (https://www.carbonbrief.org/qa-why-cement-emissions-matter-for-climate-change). The air and rainwater carry dust and slurry from these sites to nearby cropland areas, posing a serious threat to soil porosity, fertility, permeability, and crop yield [18–20]. During the dry summer months, dust becomes a significant source of pollutants in the surrounding areas. Noise and vibration from machinery and blasting in quarries have a huge impact on prevailing ecosystems; landscape deformation in preparation for mineral excavation has a huge impact on prevailing ecosystems; blasting can alter groundwater flow, which in turn can modify surface water flow; and effluent from cement plants causes water quality to change.
4.1 Sustainable Development Activities
The Limestone and Cement production industries have to take the steps Figure 10 mentioned below for reducing emissions from the industry and to make the industry Eco-friendly and sustainable development.
• Planting trees and implementing afforestation plans to keep the environment green.
• Develop Deep sumps for rainwater harvesting and groundwater recharging in mines. The same sump water would be used in the plat for dust suppression, plantation, and refining.
• Reclamation of abandoned mines for landscaping, construction of water reservoirs.
• Adopting more scientific mining techniques that inflict the least amount of environmental damage by reducing mining emissions.
• Use Noise pollution control methods such as a down-the-hole initiation system, Establish Greenbelts along the mine area’s border, around the plant and colony to reduce the effect of noise from mining operations on the community.
• Ambient air quality monitoring systems installation at sight locations for air quality measure and control.
• Install Air pollution control devices (Electrostatic Precipitator and Bag Filters) to reduce greenhouse gas (CO) emissions.
• To suppress dust perform water sprinkling at mine face and haulage roads regularly
• Land Environment: Mining-related topsoil would be used sparingly for green belt growth and backfilling.
• Conduct corporate social responsibility (CSR) activities (Healthcare Quality/Support Programs, Promotion of Education, Rural Development, Skill Development, and Self employment programs, etc.).
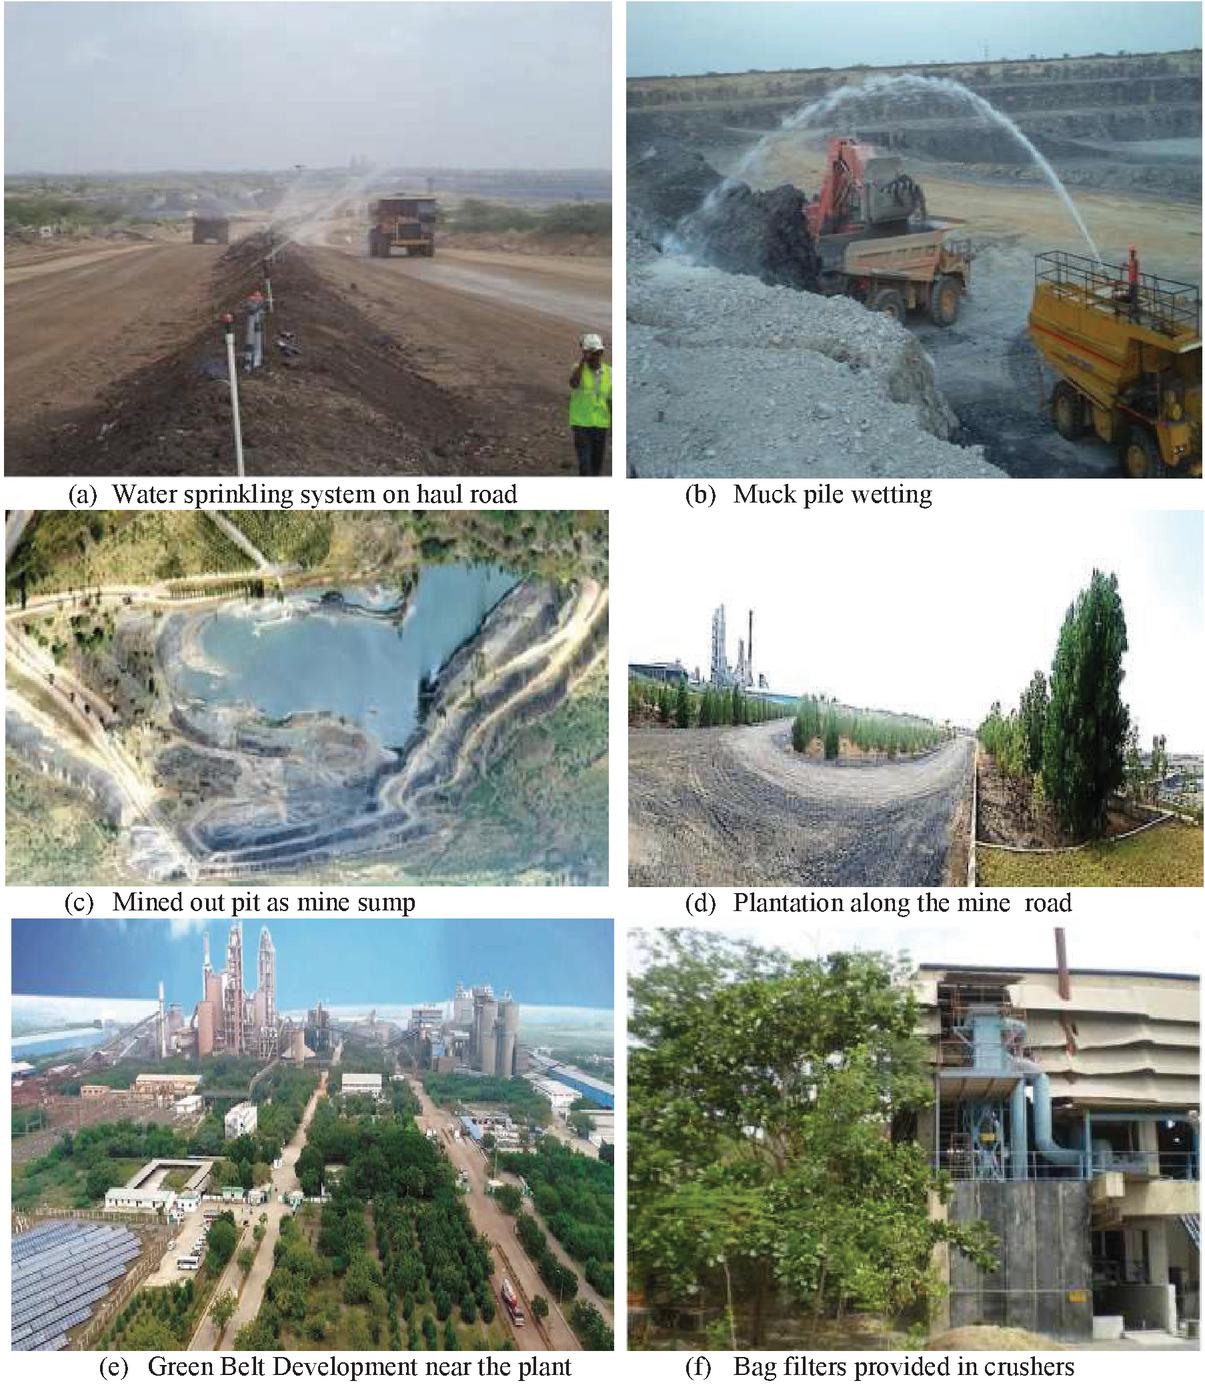
Figure 10 Mining and cement industry sustainable activities.
5 Results and Discussion
For the years 2011, 2016, and 2020, Cement Grade Limestone Mine Land Use imagery was extracted using the Google Earth Pro desktop tool based on image elements such as Color, Texture, Shape, Size, Pattern, and Association. The active mine area is represented by a yellow polygon, the dark blue tone due to the presence of water in the pits Figures 10–14. Because of a lack of data and a clear Google Earth image archive, the evaluation for the years before 2011 was not possible. As a result, starting in 2011, an assessment was conducted with 4, 5, and 9-year intervals.
5.1 Change Assessment
The CGL Mine land use dynamic change is well represented in (Table 2) for the years 2011, 2016, and 2020. The area was calculated by drawing a polygon on Google Earth satellite imagery. CGL Mine dynamic degree and area variation rate indexes were calculated to assess the annual variation rate.
Table 2 Land use dynamic degree of the CGL Mine area
| 2011 | 2016 | 2020 | |||||||
| Name of the | Mine | Mine | Mine | DD Change | DD Change | DD Change | |||
| Limestone | Area | Area | Area | Area | Area | Area | (2011–2016) | (2016–2020) | (2011–2020) |
| Mine | (Ha) | % | (Ha) | % | (Ha) | % | % | % | % |
| Coromandel Limestone south | 49.3 | 14.7 | 67.6 | 20.1 | 74.4 | 22.0 | 7.4 | 2.5 | 5.6 |
| Coromandel Limestone north | 7.38 | 2.7 | 9.81 | 3.6 | 12.5 | 4.6 | 6.5 | 6.8 | 7.7 |
| Niduzuvvi Limestone block-1 | 30.0 | 8.95 | 32.5 | 9.69 | 33.5 | 9.99 | 1.67 | 0.77 | 1.29 |
| Niduzuvvi Limestone block-2 | 1.73 | 0.51 | 3.0 | 0.80 | 3.42 | 1.02 | 14.6 | 3.50 | 10.85 |
| Zuvari cement Limestone | 91.5 | 13.9 | 116 | 17.6 | 144 | 17.3 | 5.35 | 6.03 | 6.37 |
| Bharati cements Limestone | 20.5 | 2.48 | 39.9 | 4.82 | 69.7 | 8.42 | 18.93 | 18.6 | 26.67 |
| Dalmia Cement Limestone | 10.6 | 2.60 | 28.3 | 6.95 | 43.3 | 10.6 | 33.3 | 13.25 | 34.2 |
5.2 Dynamic Degree Estimation
The annual variation rate of the CGL Mine area (2) is estimated using the land use dynamic degree (Dd). It can quantify the rate of change in the Mine [18]. For the three temporal resolutions of 5, 4, and 9 years we are used the Dd model (1) to represent the spatiotemporal characteristics of CGL Mine transition.
| (1) |
Where Dd is CGL Mine land use dynamic degree, A is the area of a land-use type at time t, and A is the area of land use type at t.
| (2) |
According to the index calculation formula, the dynamic degree of CGL Mine change in three periods (5, 4, and 9 years) was calculated as shown in (Table 2). The result from (Table 2) shows that Zuvari cement Limestone occupies the highest area 91.5 ha (13.9 %) of the total mine lease area 656.68 ha in 2011. In 2016, it was increased to 116 ha (17.6%) of the total mine lease area 2016, and then later in 2020, it was increased to 144 ha (17.3%). The maximum annual variation rate for Dalmia Cement Limestone was 34.2% between 2012 and 2020.
5.3 Area Variation Rate
The area variation rate (3) of CGL Mine land use refers to the specific value of the area differential value to the area in the initial period in two different periods for a CGL Mine land use category. Its calculation formula is as follows
| (3) |
Table 3 Area variation rate of the CGL Mine area
| 2011 | 2016 | 2020 | ||||
| Mine | Mine | Mine | Area | Area | Area | |
| Name of the | Area | Area | Area | Variation Rate | Variation Rate | Variation Rate |
| Limestone Mine | (Ha) | (Ha) | (Ha) | (2011–2016) % | (2016–2020) % | (2011–2020) % |
| Coromandel Limestone south | 49.3 | 67.6 | 74.4 | 37.12 | 10.06 | 50.91 |
| Coromandel Limestone north | 7.38 | 9.81 | 12.5 | 32.93 | 27.42 | 69.38 |
| Niduzuvvi Limestone block-1 | 30.0 | 32.5 | 33.5 | 8.33 | 3.08 | 11.67 |
| Niduzuvvi Limestone block-2 | 1.73 | 3.0 | 3.42 | 73.41 | 14.00 | 97.69 |
| Zuvari cement Limestone | 91.5 | 116 | 144 | 26.78 | 24.14 | 57.38 |
| Bharati cements Limestone | 20.5 | 39.9 | 69.7 | 94.63 | 74.69 | 240.00 |
| Dalmia Cement Limestone | 10.6 | 28.3 | 43.3 | 166.98 | 53.00 | 308.49 |
Where C is the CGL Mine’s area variance rate, A is the CGL mine’s area at t, and A is the CGL mine’s area at t [15]. The area variation rate of the CGL mine in the three periods was determined using the index measurement formula, as shown in (Table 3). According to the findings, the highest variation rate is found in the Dalmia Cement Limestone mine, which is 308.49%, followed by Bharathi Cement Limestone Mine(240%), which is second, and the lowest variation rate is found in the Niduzuvvi Limestone Block-1 area, which is 11.67 percent.
The structural expansion of the Coromandel CGL Mine south block is depicted in Figure 11(a) for the years 2011, 2016, and 2020. In 2011, the area was 49.3 hectares. In 2016 and 2020, this was increased to 67.6 ha and 74.4 ha, respectively. From 2011 to 2020, the annual variation rate is 5.6 percent. The structural expansion of the Coromandel CGL Mine North block is represented in Figure 11(b) for the years 2011, 2016, and 2020. In 2011, the area was 7.38 hectares. In 2016, this was increased to 12.5 ha and in 2020, it was increased to 9.81 ha. From 2011 to 2020, the annual variation rate is 7.7%.
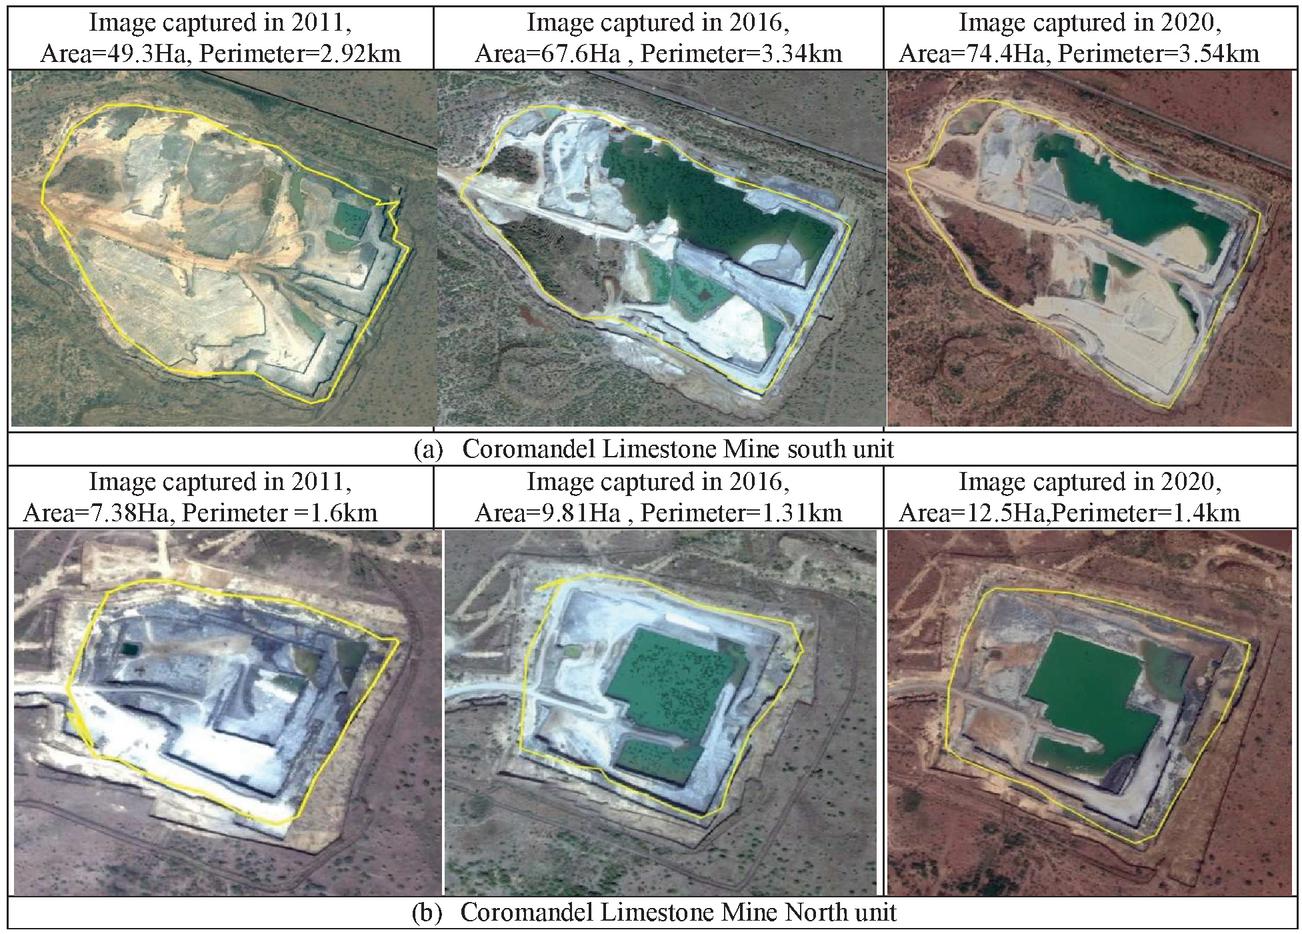
Figure 11 Coromandel Limestone Mine area structural transitions from year 2011 to 2020.
The structural change in the Zuvari cement Limestone Mine for the years 2011, 2016, and 2020 is depicted in Figure 12. The area was 91.5 hectares in 2011. This was increased to 144 hectares in 2016 and 116 hectares in 2020.
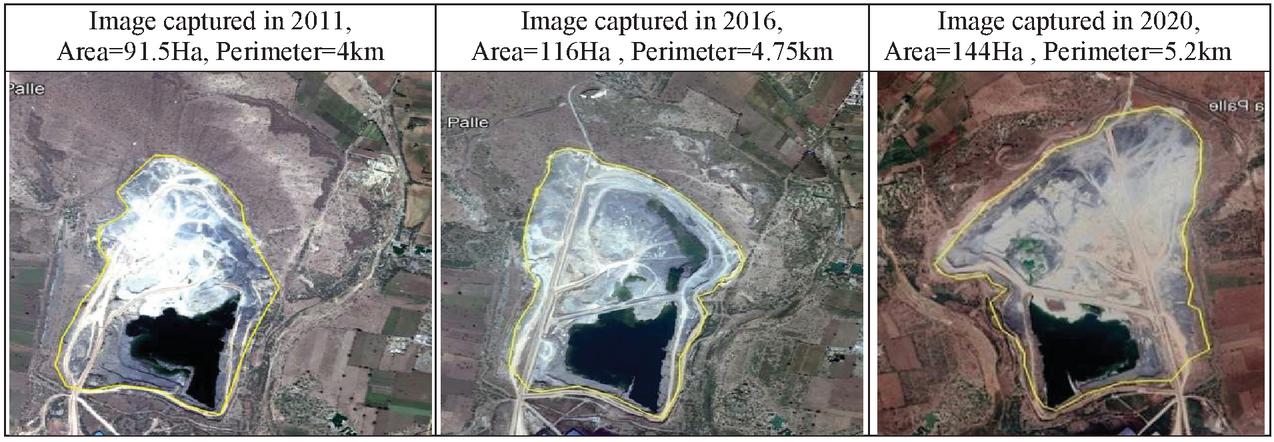
Figure 12 Zuvari cement Limestone Mine area transition from 2011 to 2020.
Figure 13(a) depicts the structural growth of the Niduzuvvi Limestone Mine Block-1 from 2011 to 2020. The area is 30 ha in 2011. In 2016, and 2020, this was increased from 32.5 ha to 33.5 ha. Figure 13(b) depicts the structural development of the Niduzuvvi Limestone Mine Block-2 for the years 2011, 2016, and 2020. In 2011, the area was 1.73 hectares. In 2016, this was increased to 3.42 ha and in 2020, it was increased to 3.42 ha. The region undermining operation is 37.72 hectares, according to the ICL EIA study of 2013. The total mine lease area is 335.06 ha, with 286.19 ha of barren undisturbed land and 12.69 ha of built-up and dump land [21].
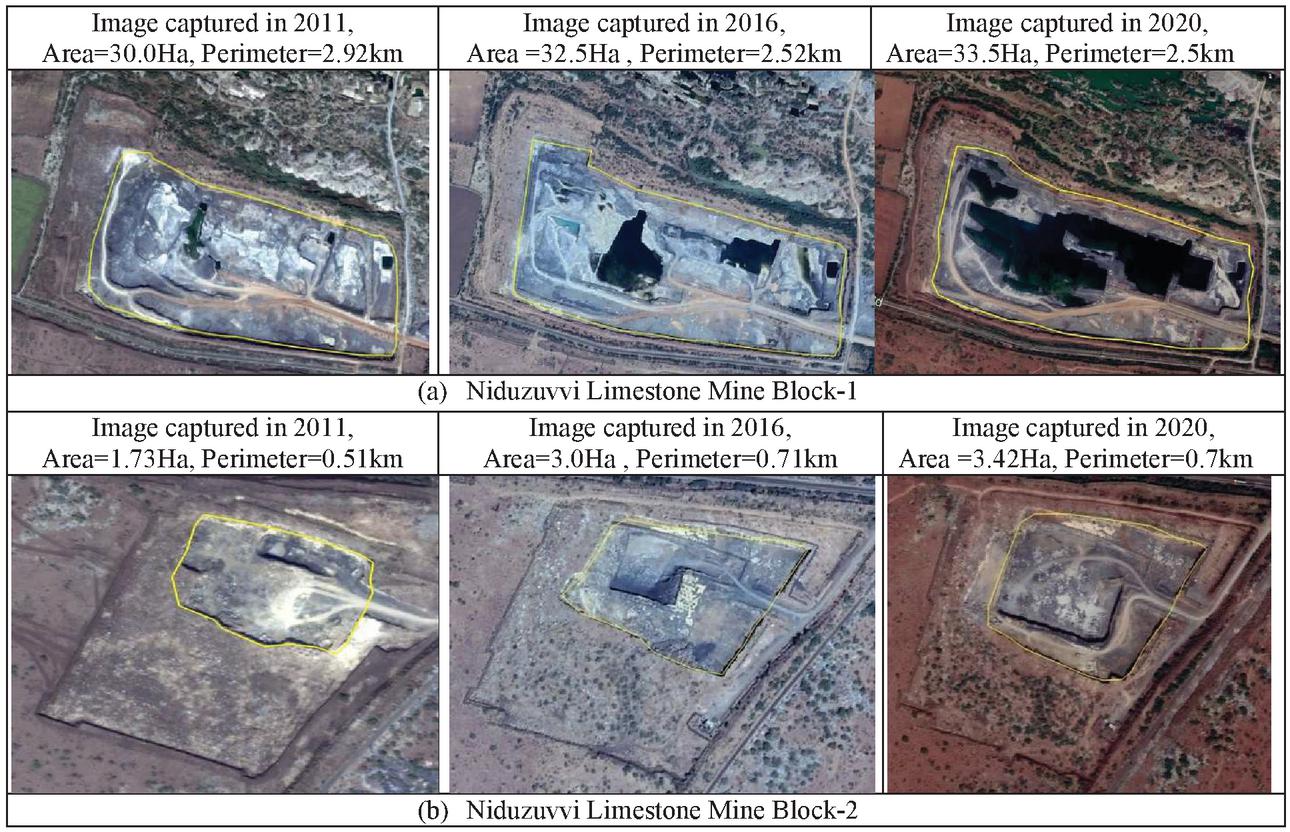
Figure 13 Transition of the Niduzuvvi Limestone Mine Field from 2011 to 2020.
The Bharathi cement Limestone Mine structural transformation for the years 2013, 2016, and 2020 is depicted in Figure 14. In 2013, the area was 20.5 hectares. This increased from 39.9 hectares in 2016 to 69.7 hectares in 2020.
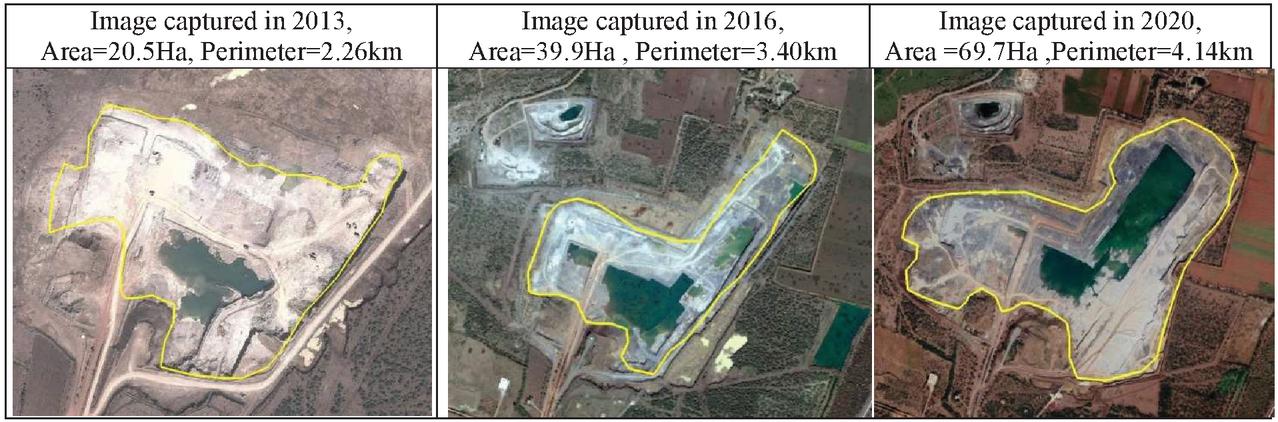
Figure 14 Bharathi cements Limestone Mine area transition from 2013 to 2020.
Figure 15 depicts the structural transformation at the Dalmia Cement (Bharat) Limestone Mine in 2012, 2016, and 2020. In 2012, the area was 10.6 hectares. This increased from 28.3 hectares in 2016 to 43.3 hectares in 2020.
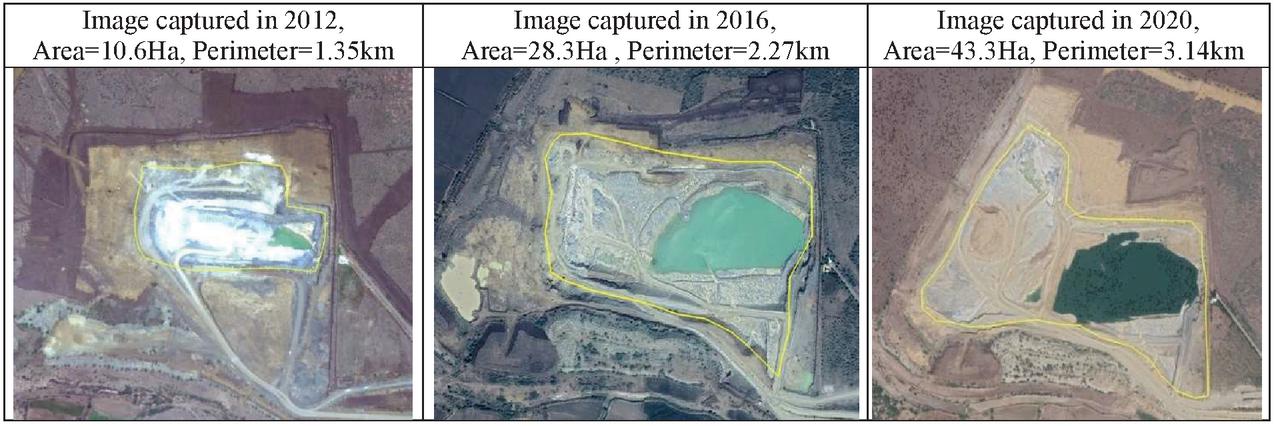
Figure 15 Dalmia Cement (Bharat) Limestone Mine area transition from 2012 to 2020.
5.4 Limitations
The limitation of Google Earth data is that the original multispectral band data might not be accessible. This means that getting the exact pixel numbers or brightness/reflectance values is impossible, and therefore image classification using unsupervised or supervised techniques is impossible. Since the spatial resolution is so high (from 15 cm to 30 cm), it is possible to see houses, roads, water sources, and other features on the image, and on-screen digitizing in GIS can be done quickly to prepare land use plans.
Conclusions
This study was carried out to assess the spatial-temporal change in captive cement grade limestone mines using Google Earth data. Google Earth data is a free, high-resolution, low-cost open-source for detecting spatial-temporal changes of the Mine region in less time. The Limestone Mine area change from 2011 to 2020 is revealed by the dynamic degree and area variation rate indexes. The results show that in the ten years since 2011, all CGL mines in the study area have seen a drastic change in climate, water, and vegetation density. For the preservation and enhancement of the land environment, the study suggested that better sustainable industrial practices be used in limestone mining methods and cement production. The result shows that Zuvari cement Limestone occupies the highest area 91.5 ha (13.9%) of the total mine lease area 656.68 ha in 2011. In 2016, it was increased to 116 ha (17.6%) of the total mine lease area 2016, and then later in 2020, it was increased to 144 ha (17.3%). The maximum annual variation rate for Dalmia Cement Limestone was 34.2% between 2012 and 2020.
Acknowledgements
The authors are grateful to the management of the Limestone Mine and Cement Industry for allowing him to conduct fieldwork in the study area. He also expresses gratitude to his colleagues for their contributions to the completion of this work.
References
[1] Githiria, Joseph Muchiri, and Onifade, Moshood (2020) The impact of mining on sustainable practices and the traditional culture of developing countries, Journal of Environmental Studies and Sciences. doi:10.1007/s13412-020-00613-w
[2] R. E. Lamare and O. P. Singh (2016) Application Of CCME Water Quality Index in Evaluating The Water Quality Status In Limestone Mining Area Of Meghalaya India, The Ecoscan An International Quarterly Journal Of Environmental science, 10 (1&2), pp. 149–154.
[3] Fanan Ujoh, Muhammad Mamman Alhassan and, Frederick Terkuma Ujoh (2014) Multi-temporal change detection at a limestone mining and cement production facility in Central Nigeria American Journal of Environmental protection volume 3(3), pp. 113–121.
[4] Ibrahim, Elsy; Lema, Luisa; Barnabe, Pierre; Lacroix, Pierre; Pirard, Eric (2020). Small-scale surface mining of gold placers: Detection, mapping, and temporal analysis through the use of free satellite imagery. International Journal of Applied Earth Observation and Geoinformation, 93, 102194–. doi:10.1016/j.jag.2020.102194
[5] Werner TT, Mudd GM, Schipper AM, Huijbregts MAJ, Taneja L, Northey SA (2020) Global-scale remote sensing of mine areas and analysis of factors explaining their extent, Global Environmental Change 60 (2020) 102007.
[6] Haoteng Zhao, Yong Ma, Fu Chen, Jianbo Liu, Liyuan Jiang, Wutao Yao and Jin Yang (2018) Monitoring Quarry Area with Landsat Long Time-Series for Socioeconomic Study”, Remote Sens. 2018, 10, 517; doi:10.3390/rs10040517
[7] Indian Bureau of Mines (IBM) (2019) Indian Minerals Yearbook 2018 (Part-III: Mineral Reviews) 57th Edition. https://ibm.gov.in/writereaddata/files/11272019155954LIMESTONE_OTHER_CALCAREOUS_2018.pdf
[8] Lamare R.E., Singh O.P. (2016) Limestone mining and its environmental implications in Meghalaya, India, ENVIS bulletin Himalayan ecology, vol. 24:p. 87–100.
[9] Harsh Ganapathi, Mayuri, Phukan (2020) Environmental Hazards of LimestoneMining and Adaptive Practices for Environment Management Plan. In: Environmental Processes and Management. Singh, R. M. et al., Water Science and Technology Library 91, Switzerland, pp. 121–134. doi:10.1007/978-3-030-38152-3_8
[10] Saneh Niyomthai, Annuwat Wattanawan (2014) Sustainable Mining in Thailand: Paradigm Shift in Environmental Management. Applied Environmental Research, 36(1): p. 55–63.
[11] Haque N, Norgate T (2015) Life cycle assessment of iron ore mining and processing. In: CSIRO Mineral Resources Flagship, Clayton South, VIC, Australia, p. 616–630.
[12] Venata Sudhar C, Umamaheswara Reddy G (2019) Land use/Land Cover Change Assessment of YSR Kadapa District, Andhra Pradesh, India using IRS Resources at-1/2 Liss III Multi-Temporal Open Source Data. International Journal of Recent Technology and Engineering, Volume-8(Issue-3), p. 8139–8159. doi:10.35940/ijrte.C6067.098319.
[13] Department of Mines and Geology (Andhra Pradesh) (2018) District Survey Report YSR Kadapa District. Andhra Pradesh Space Applications Centre (APSAC) ITE&C Department, Govt. of Andhra Pradesh, 139 p. Available from: https://www.mines.ap.gov.in/miningportal/downloads/applications/kadapa.pdf
[14] (Ministry of Environment, Forest and Climate Change Government of India) (2019) Pre-Feasibility Report of Coromandel Limestone Mine. The India Cements Limited, Chilamkur village, Yerraguntlamandal YSR Kadapa District Andhra Pradesh India, 197 p. Available from: http://environmentclearance.nic.in/writereaddata/Online/TOR/14_Dec_2018_152718407Z2OW89LRAnnexure-PreFeasibilityReport.pdf
[15] (Ministry of Environment,Forest and Climate ChangeGovernment of India) (2020) Final Environment Impact Assessment repot of Niduzuvvi Limestone Mine. The India cements Limited, yerraguntla, Kadapa district, Andhra Pradesh, India, 42 p. Available from: https://www.Indiacements.co.in/uploads/environment/pdf/16021408560yerraguntla_environment_clearance_compliancereport_ines.pdf
[16] (Ministry of Environment, Forest and Climate Change Government of India) (2019) Environmental Statement (Audit) for the financial Year 2018-2019. M/s. Zuari Limestone Mine (M/s. Zuari Cement Ltd.) Kirshna Nagar, Yerraguntla, Kadapa District, Andhra Pradesh, India. 33 p. Available from: http://www.Zuaricements.com/imagesZCl_ENV_STATEMENT_Mines-1.pdf
[17] (Ministry of Environment, Forest and Climate Change Government of India) (2017) Report on Environmental data. Bharathi cement corporation Pvt. Ltd, Nallalingayapalli, Kamalapurammandal, Kadapa District, Andhra Pradesh, India. 55 p. Available from: http://environmentclearance.nic.in/writereaddata/Compliance/14_Feb_2018_154736850JPK5V2LT11011379.pdf
[18] (Ministry of Environment, Forest and Climate Change Government of India) (2019) Pre-Feasibility report for expansion of limestone production capacity. M/s. Dalmia Cement (Bharat) Ltd. Mylavarammandal, YSR Kadapa District, Andhra Pradesh, India. 83 p. Available from: http://environmentclearance.nic.in/writereaddata/Online/TOR/08_May_2019_223113080U8VE7587Pre-FeasibilityReport.pdf
[19] Malarvizhi K, Vasantha Kumar S, Porchelvan P (2016) Use of High Resolution Google Earth Satellite Imagery in Landuse Map Preparation for Urban Related Applications. International Conference on Emerging Trends in Engineering, Science and Technology (ICETEST-2015), 9th to 11th December 2015; Trichur, Kerala, India, P. 1836–1842. doi: 10.1016/j.protcy.2016.05.231.
[20] Sudarshan Reddy Y, Suvarna B, Prasad M, Sunitha V, Ramakrishna Reddy M (2020) Temporal Changes of Solid Waste at Limestone Quarries in and around Yerraguntla, YSR District, A.P., using Google Earth Images. In: Urban Mining and Sustainable Waste Management, Sadhan Kumar, Ghosh. Springer Nature Singapore Pte Ltd., p. 99–109. https://link.springer.com/chapter/10.1007%2F978-981-15-0532-4_12.
[21] Zhang Hong, Li Hailin, Chen Zen (2011) Analysis of Land Use Dynamic Change and Its Impact on the Water Environment in Yunnan Plateau Lake Area—A Case Study of the Dianchi Lake Drainage Area. 3rd International Conference on Environmental Science and Information Application Technology (ESIAT 2011); 18–19 June 2011; Beijing, China, p. 2710–2716. doi: 10.1016/j.proenv.2011.09.421.
Biographies

C. Venkata Sudhakar Currently Working as an Assistant Professor in the Department of ECE at Sree Vidyanikethan Engineering College since 2011 and the Part Time research scholar in the Department of ECE at S. V. University Tirupati. He received the M.Tech., Degree in Digital systems and Computer Electronics from J.N.T.U.H. Kukatpally, Hyderabad, Telangana India in 2010, B.Tech Degree in Electronic Instrumentation and Control Engineering from S. V. University, Tirupati, Andhra Pradesh, India in 2006. Research area interests include the Remote sensing data/Image Analysis and classification, VLSI Architectures for Image processing application, Sensor Signal conditioning.

G. Umamaheswara Reddy, at present working as professor in the Department of ECE, SVU College of Engineering in the SV University Tirupati. Received Ph.D. degree in 2013 from S.V. University, Tirupati, India Received M. Tech degree in 1995 from S.V. University, Tirupati. He received B. Tech degree in 1992 from S.V. University, Tirupati – 517 502, India. He has 20 years of Teaching Experience. Research area of Interest include Signal/Image Denoising, System Identification, Spectral Estimation, Biomedical Signal Processing.
Journal of Mobile Multimedia, Vol. 18_3, 635–660.
doi: 10.13052/jmm1550-4646.1838
© 2022 River Publishers