Micronutrient Deficiency Detection with Fingernail Images Using Deep Learning Techniques
K. Tamil Selvi1,*, R. Thamilselvan2, R. Aarthi2, P. S. Priyadarsini1 and T. Ranjani1
1Department of Computer Science and Engineering, Kongu Engineering College, Erode, Tamil Nadu, India
2Department of Information Technology, Kongu Engineering College, Erode,
Tamil Nadu, India
E-mail: ktamilselvikec@gmail.com
*Corresponding Author
Received 07 September 2021; Accepted 26 November 2021; Publication 11 January 2022
Abstract
Micronutrient deficiencies have a significant impact on society’s overall health and well-being, necessitating supplementation. Clinical equipment is required to measure micronutrients such as iron, zinc, and vitamins using existing clinical methods. In rural and low-income areas, there is a trade-off between infrastructure, precision, invasiveness, and cost. Invasive blood sampling in paediatric patients is more uncomfortable, in addition to being cost prohibitive. There is a link between micronutrient deficiencies and subjective assessments of anatomical regions like finger nail beds. Artificial intelligence can detect micronutrient deficiency by looking at the colour and metadata of the fingernails. Convolutional neural network models are used in the proposed deep learning model to extract the features of the nails and predict the corresponding deficiencies. Various architectures such as ResNet, SqueezeNet, DenseNet, VGG and custom model are used to detect cutaneous abnormalities such as Melanonychia, Mycotic, and Buea’s lines. The real-time images are used to train the model, which is then validated with sample images for increased accuracy. With images collected from web crawlers, the proposed non-invasive model has an accuracy of 94%, and performance can be further improved by training with large variants of data and data augmentation. This prediction mechanism is used in primary health care settings and is linked to frontline workers for quick and easy diagnosis
Keywords: Non-invasive, micronutrients, fingernail, convolution neural network, classification.
1 Introduction
Micronutrient deficiency detection [1] is a deep learning-based application that aids in the detection of nutrient levels in humans. Nowadays, if a person wants to check his or her nutrient levels, he or she must go to a hospital or a specific lab, where a blood sample must be extracted and submitted for testing. It necessitates a greater number of manual actions, which can result in infection and waste time and effort. Patients may want to keep their nutrient levels and diet consistent. Having to be tested every time with blood samples is a time-consuming process that necessitates more physical activity. Micronutrients are vitamins and minerals that are essential for healthy growth and development. It is very important in the human body’s metabolic activities. Micronutrients must be consumed in sufficient amounts to keep the body healthy. Micronutrients come in a variety of forms, such as water-soluble vitamins, fat-soluble vitamins, trace minerals, and macro minerals, all of which are required in different amounts by the human body.
The system employs a non-invasive detection method that analyses nutrient levels based on colour, texture, and shape of body parts such as skin and nails. The level of each identified nutrient is used to classify the disease. The person can then receive treatment or medication based on the disease they have been diagnosed with. Deep learning is an artificial intelligence subset of machine learning that uses neural networks to learn unsupervised from unstructured or unlabelled data. Deep learning is a machine learning technique at its most basic level. The way the human brain filters information is the source of inspiration for deep learning. Its goal is to simulate how the human brain works in order to create realistic vision. Deep learning algorithms can handle almost any type of data and require a lot of computing power and data to solve complex problems.
To make this process easier, a system for detecting micronutrient levels using Convolution Neural Networks (CNN) [2] and the Fastai library is utilized. CNN is used to classify the image and provide a more accurate and efficient image analysis. CNNs are commonly used to detect anomalies, identify satellite images, process medical images, forecast time series, and identify anomalies. Fastai is a deep learning library that gives practitioners high-level components for producing state-of-the-art results in standard deep learning domains quickly and easily. It has organised around two main design goals: being approachable and productive quickly, as well as being deeply hackable and configurable. All of the previous work had something to do with invasive methods. The goal of our model is to make detecting micronutrient deficiency more straightforward. The model predicts micronutrient deficiency using fingernail images.
The following is how the article is organised. Section 2 looks at what is already out there. In Section 3, the classification models are described in detail. The proposed system methodologies are described in detail in Section 4. The detailed system architecture is overviewed in Section 5. The model’s operation is described in detail in Section 6. Section 7 contains the conclusion.
2 Related Research Works
The detection of micronutrient deficiencies and diseases in humans has been the subject of numerous studies and surveys. Our research is primarily focused on identifying three major diseases that are caused by a lack of micronutrients. Micronutrients are a type of nutrient that our bodies require in large quantities. Vitamins and minerals are among them. Vitamins are required for energy production, immune function, blood clotting, and a variety of other processes. Minerals, on the other hand, are essential for growth, bone health, fluid balance, and a variety of other processes. Micronutrients must be consumed in precise amounts to carry out their functions in the body. Excessive or insufficient amounts of a vitamin or mineral can cause negative side effects.
The micronutrient status of the Indian population [3] has been reviewed to provide insight on the current state of micronutrients in the country, taking into account all recent national surveys as well as recent studies conducted during that time period. It surveyed people of various ages, including pre-matured children, adolescent girls, married women, pregnant women, and adults. These figures demonstrate the significance of micronutrients in the human body. Many strategies [4] have been proposed to address the micronutrient malnutrition. Three main strategies for addressing micronutrient malnutrition are dietary diversification, fortification and supplementation. But most of the deficiencies can be effectively addressed through the dietary diversification.
Micronutrient levels are measured using a variety of invasive and non-invasive methods. A non-invasive procedure is one in which no break in the skin is made and no contact with the mucosa, skin break, or internal body cavity is made other than through a natural or artificial body wound. An invasive procedure involves cutting or puncturing the skin or inserting instruments into the body. Rectal examination, for example, is invasive, whereas an ultrasound scan is non-invasive. An invasive method consumes a person’s money and time. The test must also be conducted in a sterile environment with adequate equipment and skilled laboratorians. In terms of cost and time, non-invasive methods are more efficient than invasive methods.
An invasive system for detecting anaemia [5] is proposed for the infants of nine to twelve months old, with the recommendation check-up for infants in every six months. The lab-based test is used to determine the amount of haemoglobin (CHr) in the infant’s blood. However, when this test is performed on a hospitalized paediatric patient, it is discovered to have a flaw. The CHr varies from time to time depending on the severity of the infection. A non-invasive, on-demand diagnosis method using only the smart phone and the images captured by the patient, this method replaced common blood-based laboratory tests and results [6]. This application that calculates haemoglobin levels by analysing the colour and metadata of smartphone images of nail beds. This app allows non-affected and chronic anaemic patients to track their haemoglobin levels in real time and from anywhere. This method saves both money and time.
The nail abnormalities are investigated and some diseases are diagnosed [7]. This method discovered nail abnormalities linked to localized and systemic conditions like Dystrophic nails, Leukonychia, Beau lines [8], Longitudinal Melanonychia [9], and Onychomycosis [10], among others. And also identified all of the aetiologies that cause the disease, as well as some treatments for those diseases. Nutrition and nail disease are related to each other [11]. According to the work, every nutritional deficiency has an impact on nail growth in some way. Discussions have made for some anecdotal evidence of the use of nutritional and dietary supplements in the treatment of brittle nails. The main objective of the proposed work is summarized as follow:
• An intelligent non-invasive method for micronutrient deficiency detection using the nail images.
• The customed nail disease classifier from the web crawled images using fastai library with limited memory and higher computation speed
• The comparative analysis of the different classifier models and its impact on the training with the limited clinical data.
3 Proposed System
The proposed system is a deep learning-based application that simplifies the process of nutrient testing. To use this system, a person must first upload a photo of his or her fingernail. Before training to the required scale, the samples are augmented and loaded into the system. CNN learner and Fastai are used to analyse the data. Prior to the development of this system, there was a delay in processing patient blood samples and delivering reports. This system has been established in order to overcome the above-mentioned bottlenecks. The main goal of the proposed system is to make it easier for people to understand their nutrient levels. It aids in faster classification and the avoidance of a serious disease. It enables the user to keep track of their documents.
This project traverses many areas ranging from analysing images to disease classification, and required to perform several tasks to be able to achieve the project objective as shown in the Figure 1. This system produces the results by analysing the images of the fingernails. The results can be more efficiently classified, and users can make better use of them. Any time at any place, the desired information can be obtained. The individual will be able to more easily undergo treatment or take medication under supervision. The Fastai library provides deeper analysis and increased efficiency. The system will be implemented using image samples obtained from Google, with specific constraints. Because of its high accuracy, CNN is a type of deep learning that is used in image classification and analysis. The CNN employs a hierarchical model in which it builds a network in the shape of a funnel and then outputs a fully connected layer in which all neurons are connected to one another and the output is processed.
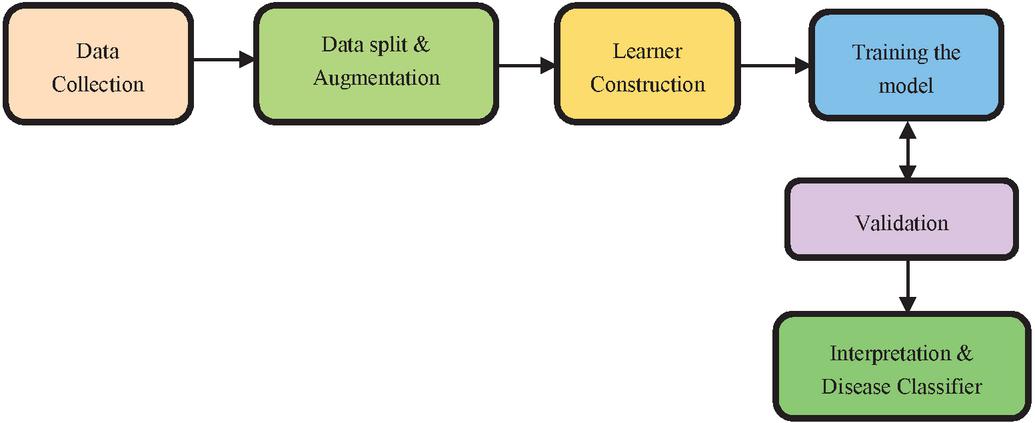
Figure 1 Fastai based framework for nail disease classification.
After classification of the nail diseases, the deficiency associated with the diseases are identified with the simple recommendation system or by the physicians. Nails are not only an important aspect of the external appearance, they are also mirroring of the internal constitution and nutritional status. Nail changes in nutritional deficiencies are mostly minor and non-specific. Nail-plate is constituted by a variety of nutrients in certain optimum proportions, almost any nutritional deficiency can produce significant changes in the nail plate. Some nutritional anomalies can also affect the nail bed. The changes may either be visible clinically or else on biochemical investigation. There is a correlation between the body and blood levels of nutrients and their concentrations in the nail plate.
Kwashiorkor is associated with nails that are soft and thin and marasmic children have fissured nails and impaired nail growth. Melanonychia refers to blackish discoloration of the nail plate. Terry’s nails can, especially in the elderly consisting of apparent leukonychia over the proximal nail bed. Beau’s lines are transverse linear depressions in the nail plate, which may be caused by any disease severe enough to disrupt normal nail growth. Brittle nail syndrome is a phenomenon, which can result from a multitude of causes in poorly nourished patients. Table 1 lists the nutritional deficiencies for nail diseases in human body. The proposed model considered the below mentioned class of nail diseases and assist the physicians for the precise prediction of nutritional deficiencies.
Table 1 Nail disease and deficiencies
| Nail Disease | Nutritional Deficiencies |
| Longitudinal Melanonychia | Malnutrition, vitamin B12 and vitamin D deficiencies |
| Beau’s lines | Protein deficiency, pellagra, hypocalcemia |
| Mycotic | Malnutrition, fungal infection, Zinc deficiency |
4 Methodologies
The first step in the proposed framework is the collection of the images. The images are collected from Google web crawler [12]. To train the system, the collected dataset samples are pre-processed to a required scale. The data is divided into two sets: training and validation sets. The model learns from the training set of data, and the validation set of data verifies how well the model performs. The dataset is split using RandomSplitter of fastai library. It generates two shuffled index sets. This function splits a list of objects into the majority of training instances and the remainder as the validation set. Splitting is done at random using the valid pct parameter. The seed is set up so that it always starts from the same place and extracts the same list for training.
The images collected comes in a variety of sizes and these images has to be converted into the same size in order to group them in a large array to go through the classification model. As a result, there is a need to add a transform to resize these images to the same proportions. The default augment transforms and RandomResizedCrop with an image size of 224px, which is standard for image classification. For grouping the data, batch tfms is used. The Datablock object is returned by this function. The Datablock can be used to make DataLoader, which specify the path to where images can be found. The DataLoader object dls is made up of standard PyTorch DataLoader. Training and validation of the model are included in a DataLoader. DataLoader is a class that feeds the GPU in batches of a few items at a time. It fetches 64 items per batch by default and stacks them into a single tensor.
Learner is a fastai object that uses transfer learning to fine-tune a pre-trained model by combining data and a training model. The learner downloads the pre-trained CNN [13] models from ImageNet and adapts them to the training model with a high degree of accuracy. Fastai metrics for error rate and accuracy are used to implement the learner function. The learning rate finder assists in determining the best learning rate. After each mini-batch, the learning rate is updated with the varying loss function.
5 Image Classification Models
5.1 ResNet152
The deepest neural network model with residual representation functions. Normally, the neural models provide single representation directly which increase the complexity of the learning model. The skip connection provides the passage from the previous layer to the next layer without any changes in the input. When the network become deeper, problems like vanishing and exploding gradients may occur which degrade the performance of the model. To avoid these problems, skip or short connection is used in the residual network [14] as shown in the Figure 2. It can be observed that, the output is shown in Equation (1) and the vanishing and exploring gradients are overcome by the weight layer with residual mapping as shown in Equation (2).
| (1) | ||
| (2) |
The identity mapping allows the model to back propagate in two ways. The optimal feature map is produced with identity mapping for the convolution, pooling and activation operations. This property enhances the performance of the network. During the learning process with back propagation, there are two ways with which the gradient can transit back to the input layer for weight updation. One path is through identity mapping and other through residual mapping. This is depicted in Figure 2. Consider the input as and output as , mathematically represented as shown in Equation (3). The residual block is containing weights based on the number of layers in the residual block, . For the next layer, the weight is updated with the Equation (4) in the residual block. The activation function is ReLU, and the identity mapping provides the second-level of non-linearity as shown in Equation (5). The gradient pathway is shown in Figure 3 in which path-1 provides the updation of weights and when the gradient vanishes, path-2 is taken for the weight updation.
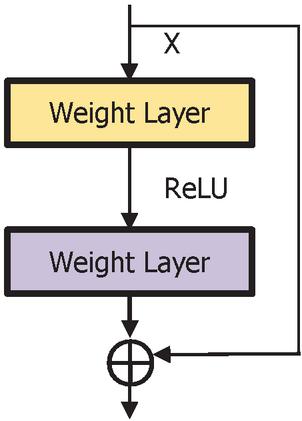
Figure 2 Building block of residual network.
The learner downloads the pre-trained CNN models from ImageNet and adapts them to our training model with a high degree of accuracy. Fastai metrics for error rate and accuracy are used to implement the learner function
| (3) | |
| (4) | |
| (5) |
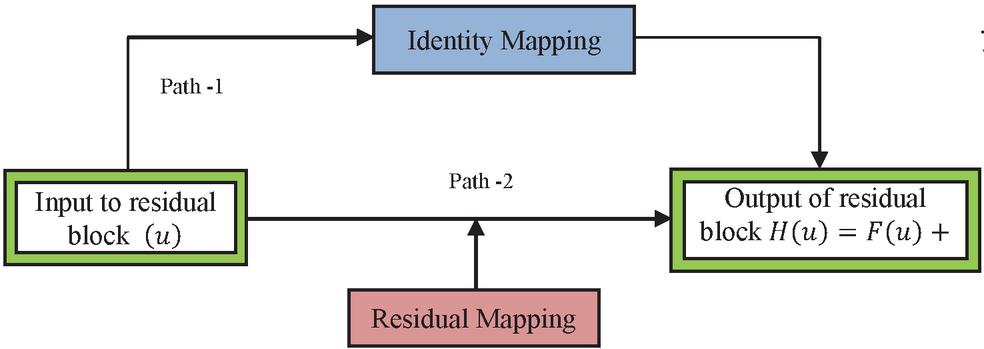
Figure 3 Gradient paths in ResNet.
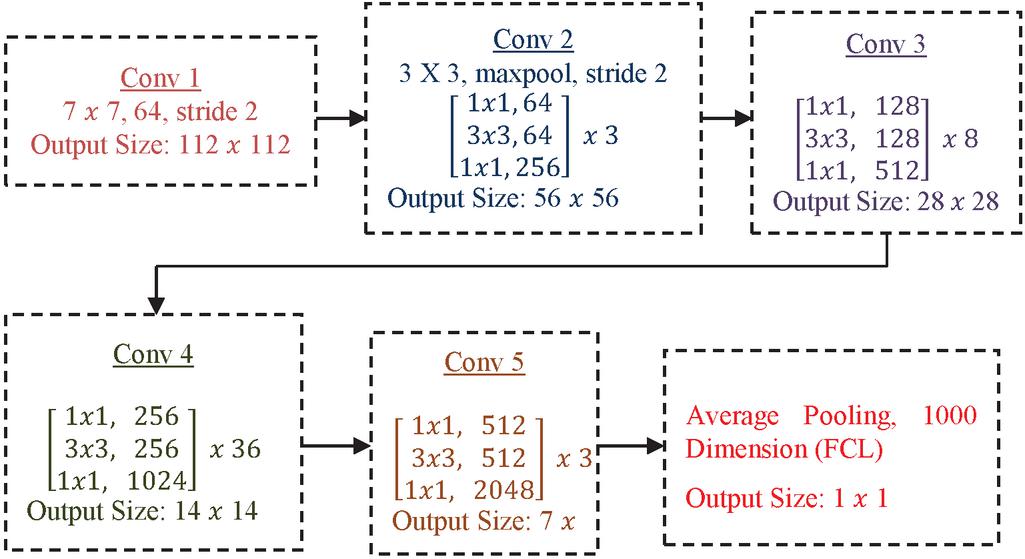
Figure 4 ResNet architecture.
The basic architecture of ResNet152 is shown in Figure 4. It consists of convolution operation with max pooling and also convolution. The convolution is also called as projection operation to control the feature map. It includes non-linearity with a smaller number of channels, reduced dimensions, reduced complexity and deeper network through bottle-neck layers.
5.2 Densenet121
Deeply connected network, Densenet provides simplified network connectivity pattern compared to residual networks. With the connectivity pattern, feature reuse with maximum gradient flow is achieved. Hence it requires minimum parameters without learning the redundant feature learning during the training process. The composite operations in feedforward neural network and skip operation in residual network is replaced by the concatenation operation in the Densenet architecture [15]. It will concatenate the output feature map with the incoming feature map rather than summing together for propagation. Consider the previous feature sets as . The feature map concatenation is given by Equation (6) with the activation function, .
| (6) |
The Densenet is divided into Dense blocks, with each Dense block contain same dimension of feature maps but number of filter changes with the block. The layer between the blocks is called transition layer with convolution and pooling. The hyperparameter growth rate changes effectively and is represented by Equation (7) for the generalization of layer . It regulates the amount of feature map that can be accessed between the layers. But each layer can access the preceding feature map and hence the collective knowledge can be obtained at each block. The architecture of Densenet121 is shown in Figure 5.
| (7) |
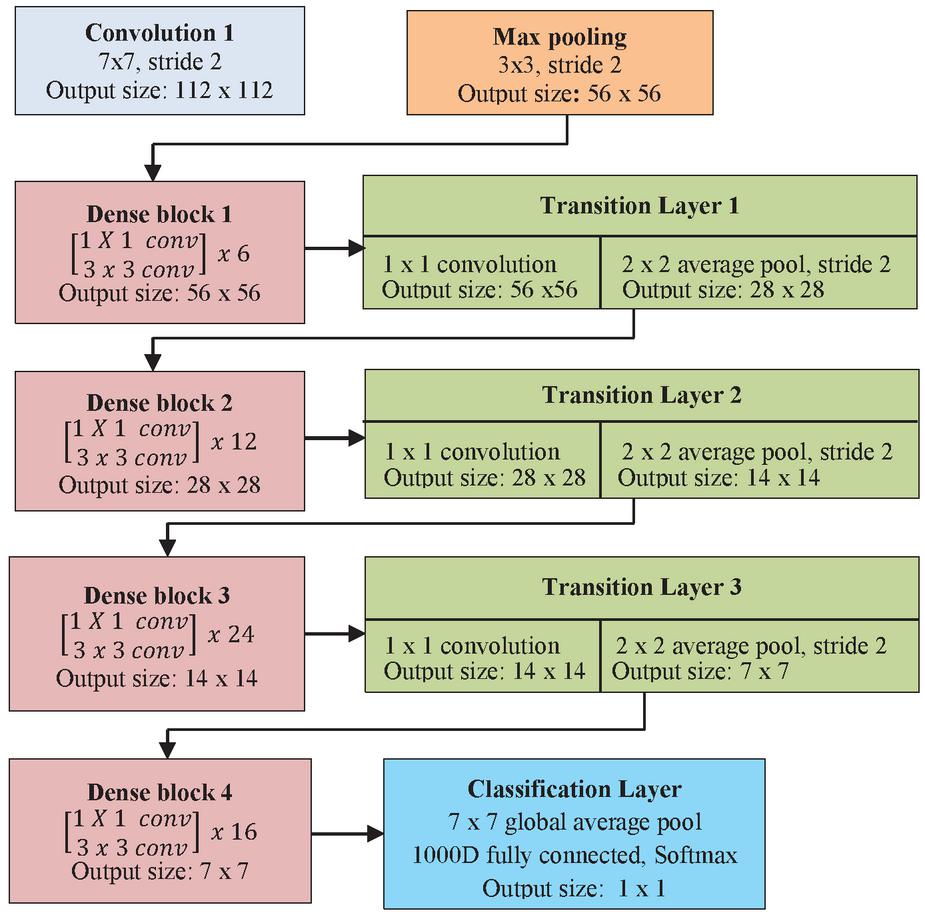
Figure 5 Densenet121 architecture.
5.3 VGG19
Visual Geometry Group 19 (VGG19) is a variant of VGG convolution network with 19 layers – convolution:16, Fully connected: 3, Maxpool: 5 and softmax:1. The convolution1(Conv1) consist of 3x3 with 64 filters. The second convolution is 3x3 with 128 filters followed by third convolution of 3x3 with 256 filters. It also has fourth and fifth convolution with 512 filters. In between the convolution layers, pooling operations are performance for optimized feature extraction [16]. The overall convolution operation is shown in Figure 6.
• Convolution 1: 3x3, 64 filters
• Convolution 2: 3x3, 128 filters
• Convolution 3: 3x3, 256 filters
• Convolution 4: 3x3, 512 filters
• Convolution 5: 3x3, 512 filters
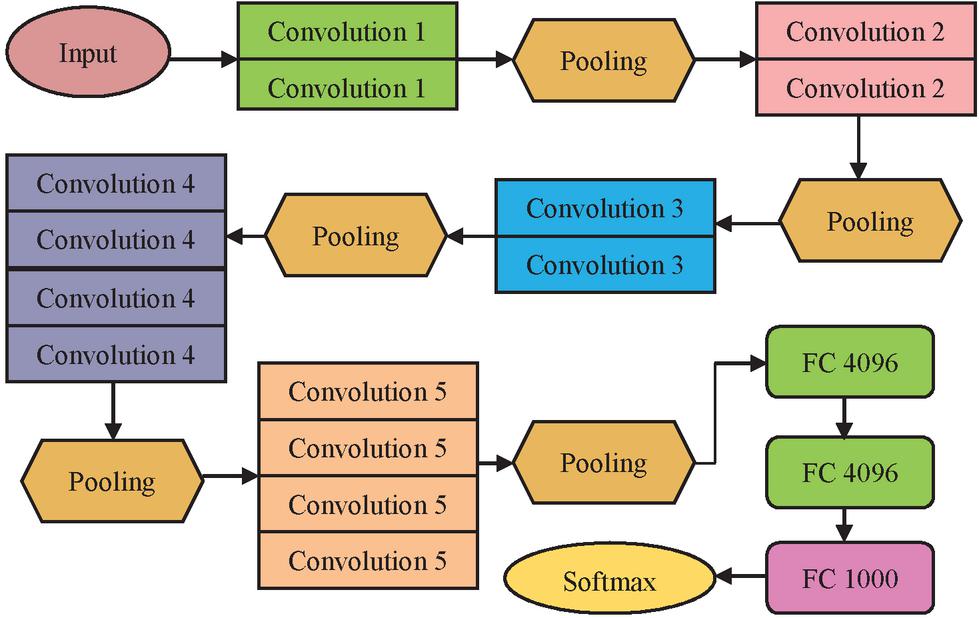
Figure 6 VGG 19 architecture.
5.4 SqueezeNet
The SqueezeNet is a compressed network with reduced number of parameters [17]. The architecture of SqueezeNet consist of squeeze and expand layers. The reduced parameters are achieved by the following ideas.
• The 3x3 kernel is replaced by 1x1 convolution
• The number of input channels are reduced to 3x3
• Late down sampling to get larger activation map for the convolution operation
The squeeze layer consists of only 1x1 convolution, whereas the expand layer consist of both 1x1 convolution and 3x3 convolution. The architecture is composed of convolution-max pool block, fire module and convolution-average pool block. The fire module as depicted in Figure 7 consists of the squeezed tensor with 1x1 convolution and 3x3 convolution applied on it is the concatenated output. The ReLU activation is used between the squeeze and expand layers in the fire module. To avoid overfitting, dropout layer is embedded with the probability of 0.5. The Network In Network (NIN) [18] mechanism avoids the need for fully connected layers. The model is trained with learning rate of 0.04 with Adam optimizer. The hyperparameter Squeeze Ratio (SR) is the ratio of number of filters in the squeeze to expand layer. The increased SR provides improved accuracy of the model. The architecture consists of 8 fire modules and hyperparameters and meta parameters. The expansion is based on the meta parameter and the expand filter as shown in Equation (8). The 1x1 filter and 3x3 filter are obtained using the Equations (9)–(10). The SqueezeNet uses meta parameter values , and SR 0.125.
| (8) | |
| (9) | |
| (10) |
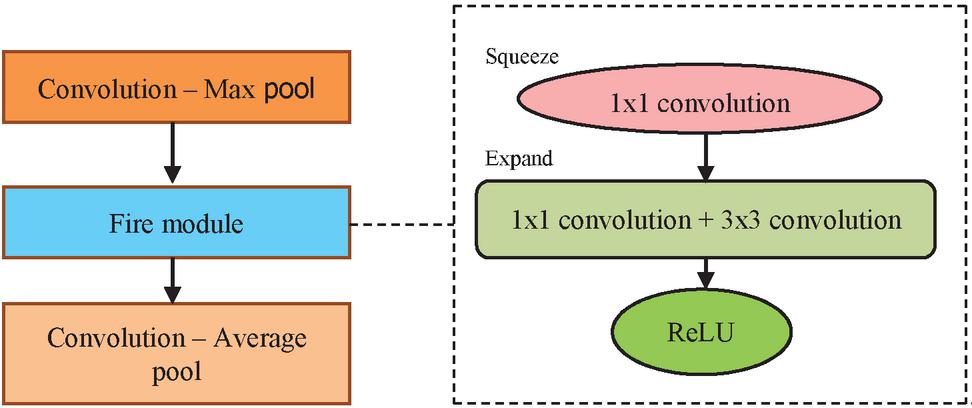
Figure 7 SqueezeNet Architecture with fire module.
5.5 Custom Model
A sequential model is used, which is suitable for a simple stack of layers with exactly one input tensor and one output tensor [19] in each layer. To produce a tensor of outputs, a convolutional 2D layer is created and convolved with the layer input with 48 neurons. The Pooling Layer is the next layer in the network, and it is in charge of approximating the feature maps created by the Convolutional layers. The Pooling Layer is also in charge of accounting for any spatial variance that could affect the network’s image recognition performance. Max pooling is used in this case. The Pooling Layer’s 2D output array is converted using the Flatten layer. The fully connected layers are a network of dense layers that are serially connected and used for classification. Every neuron in layer 1 is connected to every neuron in layer 2 in a fully connected network. The dense layers in this classification model have 128 neurons to achieve higher classification accuracy. The output layer is the final layer in CNN.
In a multiclass classification task, the number of neurons in this layer is equal to the number of distinct classes. Following the addition of the output layer to the network, the model must be compiled and then trained on a training dataset. The overall architecture of the custom nail disease classification is given by Figure 8.
5.6 Comparison of Models
Each convolution layer produces the feature map to identify the hidden pattern for the computer vision tasks. When the network become deeper, problems like vanishing gradients become common phenomenon which is addressed by ResNet with the skip connection. For the application that needs shallow network, VGG is the optimal choice and for deeper model ResNet can be opted. Table 2 provides the comprehensive summary of the utilized CNN models.
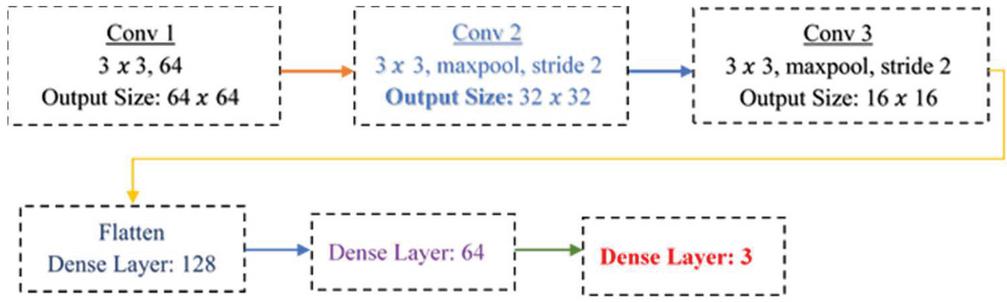
Figure 8 Custom model architecture for nail disease classification.
Table 2 Comparison of CNN models
| Network | Salient Feature | Top 5 Accuracy | Parameters | FLOP |
| ResNet152 | Skip connection | 95.51% | 60.3M | 11B |
| VGG19 | Fixed size kernel | 92.30 | 138M | 19.6B |
| DenseNet121 | Channel-wise concatenation | 93.34 | 10.4M | 5.6B |
| SqueezeNet | Fire module | 80.3 | 5M | 8.37B |
| Custom model | Minimal Layers | 94.3% | 0.14 M | 1.2B |
6 Experimental Setup
Fastai [20] library is used for the quicker classification of nail images for identification of diseases and further exploration of micronutrient deficiencies. It consists of three class and each class consists of 100 images and totally 300 images for the classifier. The training and test data are taken as 80:20 percentage for the CNN models. The simulation parameters are given in Table 3. The sample images of each class are shown in the Figure 9.

Figure 9 Sample nail images.
Table 3 Simulation parameters
| Simulation Parameters | Values |
| Environment | Fastai |
| Total images | 300 (100 in each class) |
| Training set: Test set | 80:20 |
| Epochs | 100 |
| Learning rate | 0.0001 |
| Batch size | 32 |
| Optimizer | Adam |
6.1 Evaluation Metrics
The performance of the model is evaluated by evaluation metrics like accuracy, precision, recall and F1-score. In the classification model, represents true positive, true negative, false positive and false negative respectively. Accuracy denotes the overall correctly classified samples by the classifier model as denoted in equation 11. The percentage true prediction among the give true samples is given by precision as given in Equation (12) and recall and F1-score are given by Equations (13) and (14) respectively.
| (11) | |
| (12) | |
| (13) | |
| (14) |
6.2 Result Analysis
The models defined in Fastai like RESNET152, DENSENET121, SQUEEZENET, VGG19 are implemented for the nail disease image classification. Most of the defined models have dense layers of neurons and needs more amount of data for training the models. Since the proposed problem statement needs the clinical data, the privacy of the patient data is a crucial one. So, the web crawlers provide only the limited images with less precision, these predefined models provide less classification accuracy. The dense neural network may lock with the vanishing gradients with the limited training data. To overcome these issues, custom model with the limited neural network layers is designed as shown in Figure 8. The overall performance metrics of all the models are shown in Table 4. The custom model provides the higher accuracy of 94% with the multiclass classification of nail disease images. Among the defined models in the fastai library, DENSENET121 outperforms all other models. The reason behind its performance is due to the dense blocks. The sequence of dense blocks forms the DENSENET and each dense block is capable of capturing the feature map of the images and hence higher accuracy. Figure 10 provides the graphical comparison of the classification models.
Table 4 Precision, Recall, F1-Score, Accuracy of the classification Models
| Model | Precision | Recall | F1-Score | Accuracy |
| RESNET152 | 46.6 | 60.0 | 52.4 | 60.0 |
| DENSENET121 | 73.3 | 80.0 | 80.0 | 80.0 |
| SQUEEZENET | 55.6 | 53.3 | 54.5 | 53.3 |
| VGG19 | 50.0 | 60.0 | 54.5 | 66.7 |
| CUSTOM | 95.4 | 93.18 | 94.3 | 93.18 |
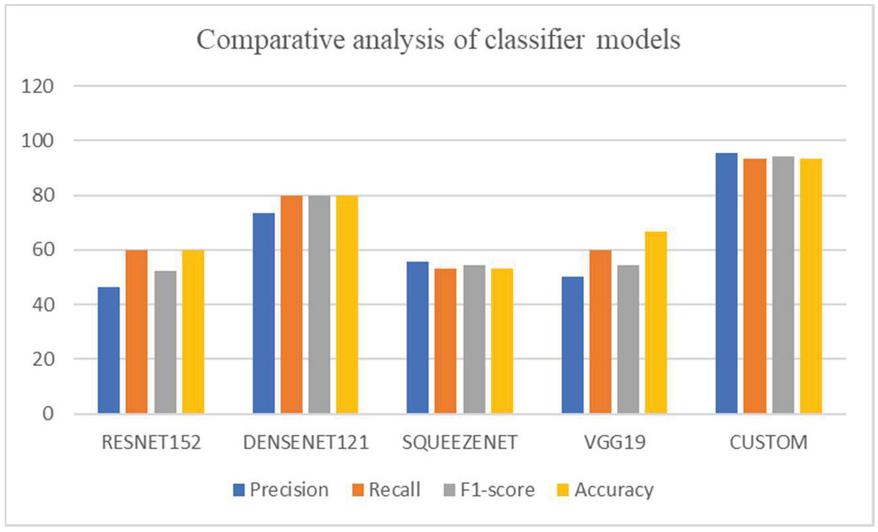
Figure 10 Comparative analysis of classification models.
Each network has its own salient features and find application in different scenarios. They are listed in Table 5. The floating-point operation is given by FLOP and network model has its own salient features. The dense block provides improved performance for the classifier model of nail disease. This block provides exploration of patterns in the given images with the dense feature maps. Since the feature maps are non-redundant, the number of parameters used in the operation is reduced compared to other models.
7 Conclusion
The nail disease classifiers provide the accurate classification of the nail images with the associated diseases. Based on the availability of the clinical data, the optimized model for the classification of the images is designed with fastai library. Even the dense models also provide the improved classification accuracy with its inherent features and its convolution operations. The classifier with the custom layer design provides higher rate of accuracy than the dense models prebuilt in the deep learning libraries. This classifier assists the physicians and frontline workers for the disease identification and detection of deficiency of micronutrients. The main benefit of the model is it is non-invasive method and need no intervention of clinical knowledge for the disease identification.
Table 5 Comparison of Classification model features
| Accuracy | ||||
| Network Model | Feature | (Top 5) | Param | FLOP |
| RESNET 152 | Residual – Shortcut connection | 95.51% | 60.3M | 11B |
| DENSENET 121 | Non-redundant feature maps | 93.24% | 29M | 8B |
| VGG 19 | Kernel size is fixed | 92.30% | 138M | 19.6B |
| SQUEEZENET | Late down sampling for big feature map | 89.3% | 1.25M | 352M |
The work can be further investigated for other nail diseases and associated micronutrient deficiencies using deep neural networks. And also, the federated learning model among the different clinical centers can be established for the improved accuracy of the classification model. The micronutrient supplements can be recommended for the identified disease. This work can be applied to the hotspots of the nutrient deficient areas where the government schemes can be employed for the betterment of the society.
References
[1] V. Sharma, V. Sharma, A. Khan, D. J. Wassmer, M. D. Schoenholtz, R. Hontecillas, et al., “Malnutrition, health and the role of machine learning in clinical setting,” Frontiers in nutrition, vol. 7, p. 44, 2020.
[2] M. M. Shahriar, M. S. Iqubal, S. Mitra, and A. K. Das, “A Deep Learning Approach to Predict Malnutrition Status of 0–59 Month’s Older Children in Bangladesh,” in 2019 IEEE International Conference on Industry 4.0, Artificial Intelligence, and Communications Technology (IAICT), 2019, pp. 145–149.
[3] S. Khare, S. Kavyashree, D. Gupta, and A. Jyotishi, “Investigation of nutritional status of children based on machine learning techniques using Indian demographic and health survey data,” Procedia computer science, vol. 115, pp. 338–349, 2017.
[4] A. Wakeel, M. Farooq, K. Bashir, and L. Ozturk, “Micronutrient Malnutrition and Biofortification: Recent advances and future perspectives,” Plant micronutrient use efficiency, pp. 225-243, 2018.
[5] R. Bamberg, “Occurrence and detection of iron-deficiency anemia in infants and toddlers,” Clinical Laboratory Science, vol. 21, p. 225, 2008.
[6] R. G. Mannino, D. R. Myers, E. A. Tyburski, C. Caruso, J. Boudreaux, T. Leong, et al., “Smartphone app for non-invasive detection of anemia using only patient-sourced photos,” Nature communications, vol. 9, pp. 1–10, 2018.
[7] K. P. Trayes, J. Studdiford, S. Pickle, and A. S. Tully, “Edema: diagnosis and management,” American family physician, vol. 88, pp. 102–110, 2013.
[8] R. Nijhawan, R. Verma, S. Bhushan, R. Dua, and A. Mittal, “An integrated deep learning framework approach for nail disease identification,” in 2017 13th International Conference on Signal-Image Technology & Internet-Based Systems (SITIS), 2017, pp. 197–202.
[9] M. M. Azad, A. Ganapathy, S. Vadlamudi, and H. Paruchuri, “Medical Diagnosis using Deep Learning Techniques: A Research Survey,” Annals of the Romanian Society for Cell Biology, vol. 25, pp. 5591–5600, 2021.
[10] S. S. Han, G. H. Park, W. Lim, M. S. Kim, J. I. Na, I. Park, et al., “Deep neural networks show an equivalent and often superior performance to dermatologists in onychomycosis diagnosis: Automatic construction of onychomycosis datasets by region-based convolutional deep neural network,” PLoS One, vol. 13, p. e0191493, 2018.
[11] M. W. Cashman and S. B. Sloan, “Nutrition and nail disease,” Clinics in dermatology, vol. 28, pp. 420–425, 2010.
[12] D. Swain, S. Bijawe, P. Akolkar, M. Mahajani, A. Shinde, and P. Maladhari, “Virtual Dermoscopy Using Deep Learning Approach,” in Cognitive Computing in Human Cognition, ed: Springer, 2020, pp. 61–71.
[13] M. Mehra, S. D’Costa, R. D’Mello, J. George, and D. Kalbande, “Leveraging Deep Learning for Nail Disease Diagnostic,” in 2021 4th Biennial International Conference on Nascent Technologies in Engineering (ICNTE), 2021, pp. 1–5.
[14] R. Reenadevi, T. Sathiya, and B. Sathiyabhama, “Breast Cancer Histopathological Image Classification Using Augmentation Based on Optimized Deep ResNet-152 Structure,” Annals of the Romanian Society for Cell Biology, vol. 25, pp. 5866–5874, 2021.
[15] M. M. Yapıcı, A. Tekerek, and N. Topaloğlu, “Performance comparison of convolutional neural network models on GPU,” in 2019 IEEE 13th International Conference on Application of Information and Communication Technologies (AICT), 2019, pp. 1–4.
[16] M. Shaha and M. Pawar, “Transfer learning for image classification,” in 2018 Second International Conference on Electronics, Communication and Aerospace Technology (ICECA), 2018, pp. 656–660.
[17] F. N. Iandola, S. Han, M. W. Moskewicz, K. Ashraf, W. J. Dally, and K. Keutzer, “SqueezeNet: AlexNet-level accuracy with 50x fewer parameters and 0.5 MB model size,” arXiv preprint arXiv:1602.07360, 2016.
[18] M. Lin, Q. Chen, and S. Yan, “Network in network,” arXiv preprint arXiv:1312.4400, 2013.
[19] M. Begum, A. Dhivya, A. J. Krishnan, and S. Keerthana, “Automated Detection of skin and nail disorders using Convolutional Neural Networks,” in 2021 5th International Conference on Trends in Electronics and Informatics (ICOEI), 2021, pp. 1309–1316.
[20] J. Howard and S. Gugger, “Fastai: a layered API for deep learning,” Information, vol. 11, p. 108, 2020.
Biographies
K. Tamil Selvi is an Assistant Professor in the Department of CSE, Kongu Engineering College, Tamil Nadu. She is pursuing PhD in the area of Traffic Engineering in Software Defined Networking (SDN). Her other areas of interest are Machine Learning, Deep Learning and Software Defined Networking. She has published more than 15 papers in international journals and conferences.

R. Thamilselvan is a professor in the Department of Information Technology, Kongu Engineering College, Tamil Nadu, India. He has completed his M.E Computer Science and Engineering in 2005 and PhD in Computer Science and Engineering in 2013 under Anna University Chennai. He has completed 18 years of teaching service. He has published 14 papers in International Journal, 7 papers in International Conference and 15 papers in National Conference. He has completed one research project sponsored by AICTE, New Delhi under the scheme Research Promotion Scheme (RPS) and organised 2 national level seminar and 1 faculty development programme sponsored by AICTE, New Delhi. His area of interest includes Grid and Cloud Computing, Parallel Processing, Big Data Analytics and Distributed Computing.
R. Aarthi received M.E in Computer Science and Engineering and having 10 years of experience. She is currently working as Assistant professor in the department of Information Technology at Kongu Engineering College, Erode, Tamil Nadu. Her research areas include networking, network security and deep learning. She has published more than 10 papers in national and international journals.

P. S. Priyadarsini is an undergraduate student in the department of CSE, Engineering College, Tamil Nadu, India. She is currently working in web development area in Informatica Solutions, Bengaluru. Her areas of interest include web development, machine learning and deep learning.
T. Ranjani is an undergraduate student in the department of CSE, Kongu Engineering College, Tamil Nadu, India. She is currently working Soliton solution. Her areas of interest are machine learning and deep learning.
Journal of Mobile Multimedia, Vol. 18_3, 683–704.
doi: 10.13052/jmm1550-4646.18310
© 2022 River Publishers