Mobile Crowd-sourced Data Fusion and Urban Traffic Estimation
Quang Tran Minh1, 2,*, Phat Nguyen Huu3 and Takeshi Tsuchiya4
1Faculty of Computer Science and Engineering, Ho Chi Minh City University of Technology (HCMUT), 268 Ly Thuong Kiet, District 10, Ho Chi Minh City, Vietnam
2Vietnam National University Ho Chi Minh City (VNU-HCM), Linh Trung Ward, Thu Duc District, Ho Chi Minh City, Vietnam
3School of Electrical and Electronic Engineering, Hanoi University of Science Technology, 1 Dai Co Viet Rd., Hanoi – Vietnam
4Suwa University of Science, Japan
E-mail: quangtran@hcmut.edu.vn; phat.nguyenhuu@hust.edu.vn; tsuchiya@rs.sus.ac.jp
*Corresponding Author
Received 09 October 2021; Accepted 18 December 2021; Publication 05 March 2022
Abstract
Urban traffic estimation is one of the critical tasks for intelligent transportation systems (ITS). To estimate traffic condition, accurately and timely traffic data must be sensed frequently at every location around the city utilizing multimedia data fusion and analytics. This paper proposes a novel approach to urban traffic data collection and analysis leveraging crowd-sourced data from drivers and mobile users. Concretely, we have proposed solutions for mobile crowd-sourced data fusion to which just the right traffic data is collected automatically by GPS modules equipped in mobile devices. In addition, mechanisms for data validation and analytics for traffic estimation have been devised. Consequently, a mobile application is developed and provided to public users so that they can conveniently collect and share traffic data to the system. Besides, users can access traffic information and ITS services such as routing recommendation freely. The proposed system has been deployed for a real-world application in Ho Chi Minh City (HCMC), the largest city in Vietnam. Experimental results from real-field data confirm the feasibility, effectiveness and efficiency of the proposed approaches.
Keywords: Urban traffic estimation, traffic condition, crowd-sourcing, GPS data, ITS.
1 Introduction
Traffic congestion and transportation safety are serious issues in almost every country all over the world, especially in developing countries where traffic infrastructures are not developed well to satisfy the development demands. Urban traffic estimation helps eliminating these issues and is a major research stream in the ITS sector. Accurate and in-time traffic information is crucial for various ITS services such as eliminating traffic congestion by helping commuters avoid entering heavy traffic locations, routing services, supporting authorities for their daily tasks on traffic management as well as urban policy planning [1, 2].
In order to effective estimate traffic condition, adequate traffic data including location, time, density, traffic flows’ average velocity, reasons caused such a traffic condition (e.g., construction, accidence, heavy rain), etc., at every road segment [3, 4] are required. In the conventional ITS systems, these data are commonly collected by road-side fixed sensor systems like RFID, camera systems, loop detectors [5, 6]. However, these approaches lead to essential drawbacks such as coverage limitation and implementation costs. Meanwhile, if we utilize data from communities such as drivers and mobile users via mobile devices then not only the coverage limitation can be overcome but traffic state can also be correctly estimated from such informative traffic data sources.
Various researches revealed that traffic congestion has a close relationship to driver behaviours [2, 4], especially in developing countries of chaotic traffic and multiple transportation modes including motorbikes. Meanwhile, if drivers can access in-time traffic information via navigation systems, traffic maps in mobile applications, or via radio channels they can find a better route to avoid congested locations [2, 4, 7, 8]. In addition, if drivers/commuters can contribute traffic data to a traffic estimation system then the analyzed traffic information could be more accurate providing more benefit to various stakeholders including drivers, mobile users and traffic management authorities. Therefore, mobile crowd-sourced data fusion and urban traffic analytics are potential approaches to traffic estimation issues.
With the advances of mobile technologies and social networks, mobile crowd-sourcing techniques are applied in various fields such as in disaster recovery, crowd-sourced designing, software development [9–11] and so on. Ushahi is a successful example of a crowd-sourcing approach to data sharing, analyzing and then disseminating evacuation instructions to on-site users and to help volunteers conducting effective rescue plans during the Haiti earthquake [12]. In the field of traffic estimation, traffic multimedia data such as GPS (global positioning systems), text data, images captured from mobile phones can be shared by mobile users who are available at every location in almost every time [4, 8].
Google Maps [13], Waze [14] are some of successful examples in this approach where traffic data such as velocities, locations of vehicles are collected from mobile devices equipped on vehicles or carried by drivers/passengers. However, there are several difficulties that hinder there applications in developing countries such as in Vietnam as (i) the traffic network data (i.e., the map) is not public leading to limitation in developing ITS services on top of their infrastructure and a huge usage cost (i.e., the fee for using map’s accessing APIs from Google), (ii) they mainly collect users’ mobility data without users’ awareness in many cases, and (iii) traffic estimation accuracy is commonly low, especially when the number of users is low and there are noises from GPS signals.
In order to overcome the aforementioned difficulties, several research issues need to be thoroughly resolved. For example, mobile crowd-sourced data may consist of various noises from the GPS errors or even from the different users’ knowledge about traffic condition (when they report traffic data). In this sense, we need to propose solutions to validate traffic data from users’ report to ensure the quality of the traffic analytic model. In addition, mobile devices are commonly limited in computation, storage and battery resources, hence the data fusion models from mobile devices need to be thoroughly investigated to ensure that the necessary traffic data are appropriately collected while saving mobile devices’ resources for their original tasks (e.g., for call and internet access services).
This work proposes holistic solutions for urban traffic estimation leveraging mobile crowd-sourced traffic data with main contributions as follows.
(i) We devise a novel framework for traffic condition estimation leveraging mobile crowd-sourced data including a crowd-sourced data validation model, effective data fusion mechanisms to ensure the quality of traffic data while improving the computational resource saving.
(ii) We have developed a mobile system for real-world application in Ho Chi Minh City, the largest city in Vietnam, to evaluate and confirm feasibility and the usefulness of the proposed solutions.
(iii) We have thoroughly conducted experiments and analyzed the results in real-field experiments. Experimental results confirm the effectiveness, the feasibility and the usefulness of the proposed solutions.
This paper is organized as follows: Literature review is described in Section 2. Section 3 presents a novel design features of the proposed system. Details on mobile crowd-sourced data fusion and traffic estimation are addressed in Section 4. The implementation of the proposed approaches for real-world system is presented in Section 5 while Section 6 presents and analyzes the evaluation results. Section 7 concludes the paper and draws out future work directions.
2 Related Work
Traffic estimation is an important issue in urban traffic management and ITS which attracts academic, industrial researches as well as urban planning sectors in the recent years [15]. Accurate traffic estimation can help users avoid entering heavy traffic locations thus contributes to eliminate traffic congestion, one of the headache issues in almost every large city. In order to provide accurate and real-time traffic information, traffic data need to be adequately collected. Conventional approaches which are mainly applied in developed countries rely on fixed-side sensors like RFID, camera systems equipped along road sides [16]. These systems have advantages in terms of accuracy while they are costly for implementation which leads coverage limitation. Consequently, these approaches could not be directly applied in developing countries.
In order to overcomes these difficulties, several researches focus on mobile approaches where traffic multimedia data (e.g., GPS, images captured from mobile phones, text data input by users,…) can be collected and shared by mobile users at mostly every location any time. This benefit comes from the advances of IoT, mobile technologies, and social networks [4, 8]. This current work pursues crowd-sourcing based approaches to enhance the strength of mobile technologies and contributions of communities (i.e., the crowd-sources) to resolve the inherent issues of coverage limitation in urban traffic estimation problems.
Several researches such as CityDrive [17] and GreenDrive [18] proposed mechanisms to collect real-time data of vehicles’ movements via GPS, then estimate volumes and velocities of traffic flows at particular intersections. This information is then used to advice drivers on slowing down or accelerating their speeds to reduce the waiting time at traffic lights hence saving fuel. To reach this target, the probabilities of left turn phases are analyzed by learning historical data extracted from GPS. These works reveal the feasibility of providing real-time traffic information and smart driving services using crowd-sourced data from drivers. This approach is different from our proposed method in the current paper as our focuses are large traffic environments of the whole city network rather than a microscopic environments of particular intersections.
Although the crowd-sourced based mobile multimedia traffic data collection approach helps to eliminate the coverage limitation, this issue is still challenging, especially when the system is in it early stage when the number of mobile users is not large enough [4, 8]. In addition, crowd-sourced data commonly consist of noises which degrade the quality of traffic estimation models. Various researches have discussed this issue [19, 20]. However a specific solution for validation mobile crowd-sourced traffic data extracted from GPS as those in this current paper has not been investigated thoroughly. Moreover, crowd-sourcing functions implemented in mobile devices require the mobile application executing frequently that leads to battery drained, hindering user acceptance. These issues need to be thoroughly studied in this current work.
This current paper is completely different to the above approaches as it proposes a novel framework for traffic condition estimation using mobile crowd-sourced traffic data contributed by drivers/mobile users. Essential issues in system designs to provide users friendly and easy means for traffic data collection and sharing, effective approaches to crowd-sourced data validation, and traffic estimation are proposed and thoroughly analyzed. A mobile application has been launched in a real-world traffic network of HCMC to confirm the feasibility, the effectiveness, and the efficiency of the proposed approaches.
3 Designed Features of the Urban Traffic Estimation System
3.1 Overall Architecture
The overall architecture of the proposed urban traffic estimation framework utilizing mobile crowd-sourced data is illustrated in Figure 1 which consists of three main components: (i) User applications for collecting crowd-sourced traffic data and retrieving traffic information, (ii) Traffic data processing and estimation, and (iii) Database systems including Data warehouses that store historical traffic information used for further analysis such as for mining traffic conditions at locations where real-time traffic data are missed. These components are briefly described as follows.
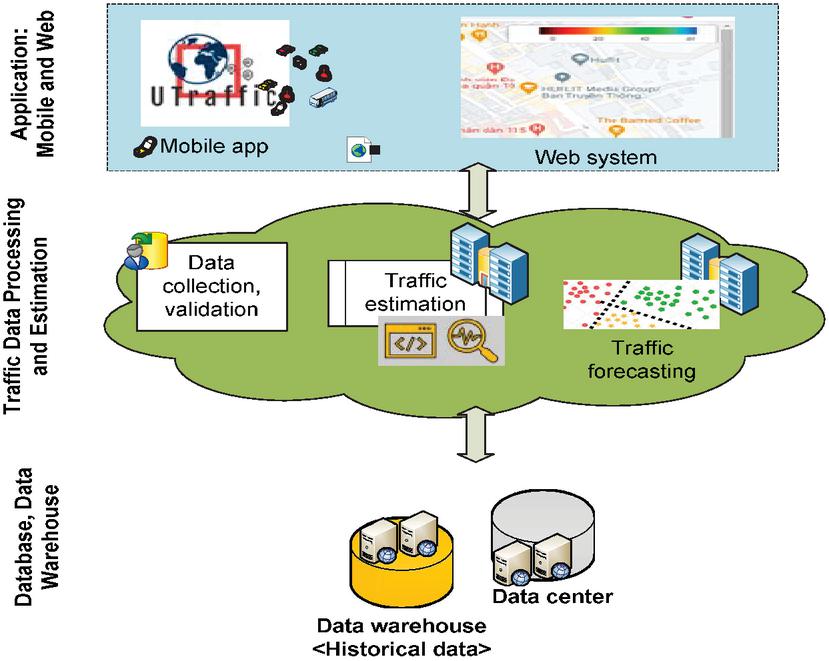
Figure 1 The overall architecture of the proposed framework for urban traffic estimation using mobile crowd-sourced data.
Applications: Mobile users including drivers, passengers or even common users can contribute traffic data to the system for traffic analytics. Therefore, it is critical to provide them an effective way for traffic data collection and sharing. In order to reach this target we have designed a mobile application and a web-based system where users can conveniently report traffic data and access traffic conditions. This component mainly leverages GPS (global positioning system) modules equipped in mobile devices to sense traffic data such as location, velocity and moving direction automatically.
Traffic data processing and estimation: This component consists of Data Collection and Validation, Traffic Estimation and Traffic forecasting. Obviously, crowd-sourced data commonly consist of noises rooted from GPS errors or from different knowledge/viewpoints of mobile users about traffic conditions (when users report traffic status to the system). Therefore, it is necessary to validate and improve the quality of these data at the Collection and Validation component before sending them to the Traffic Estimation component implemented at the analytic center. At this component, we also proposed a traffic forecasting sub-system to predict traffic conditions when real-time traffic data are missed.
Database systems: The analyzed traffic information provided by the Traffic estimation and forecasting components mentioned above is then disseminated to the publicity via urban traffic maps in the mobile application and the web-based system so that users/commuters can avoid entering congested areas. In addition, these data are also stored in the database systems including data warehouses for further analysis, especially for traffic forecasting as discussed above. Authorities and urban traffic policy makers can also utilize traffic information and statistical reports from the Databases/Data warehouses for their daily operations (e.g., traffic police) or decision making (policy makers).
In order to increase the effectiveness of the proposed approach, essential issues in each component mentioned above must be thoroughly resolved. For example, the Data collection component requires a convenient way to which original users can easily collect and share the data to the system without interference to their daily activities such as driving, working, etc. Therefore, the method for data collection should be designed in association with traffic condition estimation methods and the granularity level of traffic information. Solutions for these issues are presented in details in the following sub sections while issues related to data validation, data fusion optimization and traffic estimation models are presented in the next section.
3.2 Traffic Condition Granularity
In order to design a suitable model and then build an appropriate mobile application for crowd-sourced traffic data collection, we need to analyze the granularity level of the traffic estimation model that we are focusing on. Obviously, urban traffic network is large and the time is a continuous dimension thus we need to partition the computation space spatial-temporally in a suitable granularity.
Firstly, as for the time dimension, we have conducted several preliminary studies and real-field observations [2, 4] and revealed that traffic conditions do not change quickly but they need time for status transitions which is around 10 minutes to 15 minutes. In this work, we use a time frame of 10 minutes, naming the estimation period duration, to discretize the time dimension. In this sense, for one day we have time periods for traffic estimation which is small enough for saving the computation resources while keeping the traffic information updated.
Secondly, as for the spatial dimension, the urban traffic network should be divided into smaller parts. We divide the traffic network into road segments of relevant lengths which are not too long to keep traffic condition at any location in a particular road segment during a specific time period is identical. In addition, road segments should not be too short to keep the number of segments be small enough for saving the computation resources as well. We utilize the Open Street Map (OSM) [21] which is an open sourced map data. This data structure defines street, road segment (composes of two end nodes) and node as JSON structure depicted in Figures 2, 3, and 4, respectively.
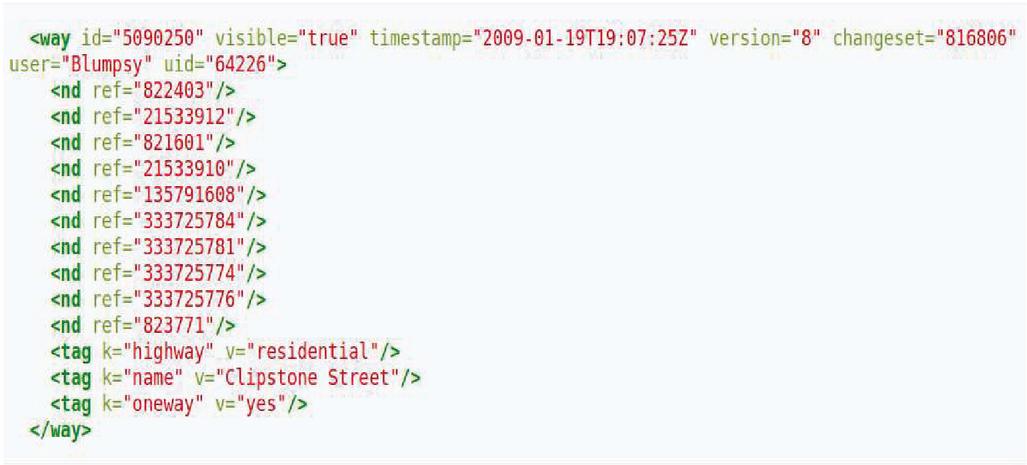
Figure 2 Structure of a way/street that consists of multiple road segments, each composes of 2 end nodes.
Figure 2 shows a street (or a way) that composes of 9 consecutive road segments. Here, each road segments is defined by two adjacent nodes. For example, road segment 1 is composed of two nodes denoted as nd ref = ”822403”/ and nd ref = ”21533912”/ and the two nodes composing road segment 2 are nd ref = ”21533912”/ and nd ref = ”821601”/ (please refer to the first three nodes in Figure 2). Figure 3 presents detailed information of a road segment (Id 56235) where lines 5 to 8 describe coordinates of two composing nodes (start and end nodes whose IDs are presented in lines 11, 12). The structure of a node is described in Figure 4.
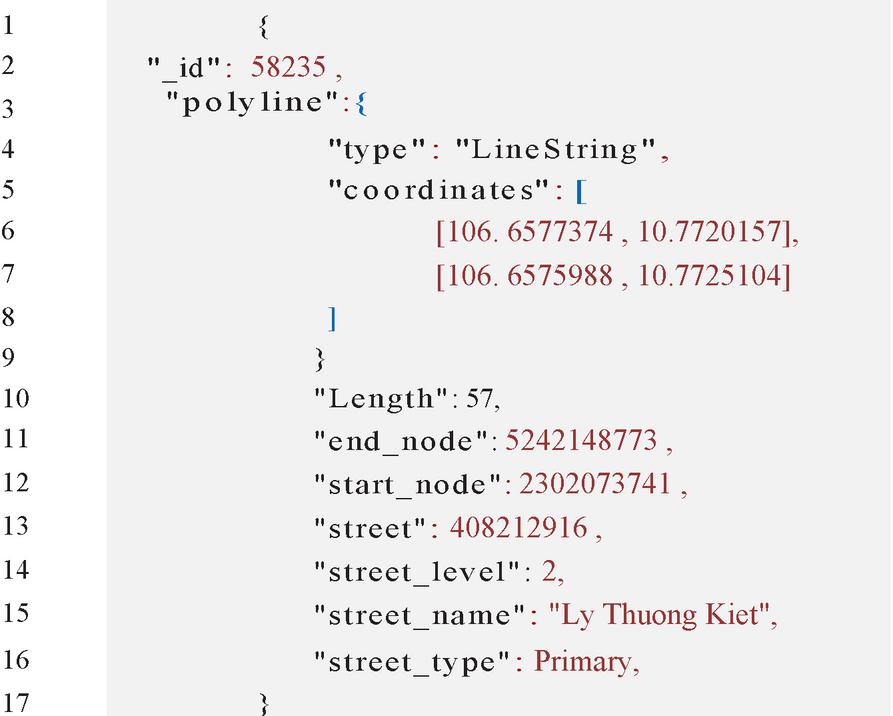
Figure 3 Structure of a road segment that composes of 2 end nodes.
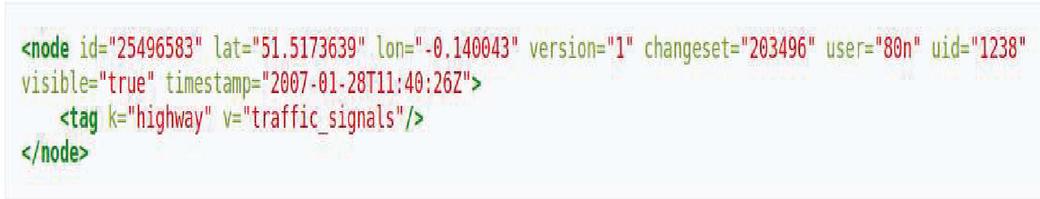
Figure 4 Structure of a node with its latitude (lat) and longitude (lon).
However, as an open sourced data, many road segments are not well structured in the OSM as many of them are too short. We have modified this dataset by combining too short and divided too long segments into suitable length ones. Table 1 shows the distribution of road segment lengths in our modified database of HCMC traffic network.
Table 1 The proportion of segment length in HCMC traffic network
| Segment Length | Proportion |
| 60 m – 80 m | 13% |
| 81 m – 100 m | 61% |
| 10 0m – 120 m | 26% |
3.3 Traffic Estimation Problem Definition
As presented previously, traffic condition is estimated in the granularity of road segment in a particular time period. We call this combination an estimation unit (spatial-temporally) denoted as (the level of condition at road segment X during period p). In this work, we use the average velocity of traffic flows within an estimation unit to represent the level of traffic condition which reveals how smooth/good flows are.
Given , the system (deployed in the server/cloud) collects traffic data from mobile users at road segment X during period p of time frame (e.g., 10 minutes). These data are then validated and integrated in a traffic Database to calculate average velocity of traffic flows in . This average velocity is then displayed on urban traffic map in the mobile application and be notified to users/commuters who are interested in (e.g., who are actively turning on the notification function and travelling on related road segments). Moreover, this analyzed traffic information is then stored in a data warehouse (DW) for further traffic management or urban policy making (see Figure 1).
In order to display traffic condition on urban map with different colors (e.g., from green to red representing from the best to the worst traffic conditions) conveniently, we propose to use level of service (LOS) that a road segment satisfies [2, 6]. This indicator is divided into 5 levels as shown in Table 2.
Table 2 Description of the LOS in accordance with average velocity
| LOS | Average Velocity of Traffic Flows in the City (km/h) |
| A | 35 |
| B | 25 – 35 |
| C | 20 – 25 |
| D | 15 – 20 |
| E | 15 |
4 Mobile Crowd-sourced Data Fusion and Traffic Estimation
4.1 Mobile Crowd-sourced Data Collection
In order to encourage and provide an easy mean for mobile users to collect and share traffic data, the mobile application must be well designed to which the “right” traffic data is collected without user interference. Traffic data should be simple enough while containing relevant information for traffic estimation. However, which is relevant enough data is not an easy question to answer. We have conducted several preliminary researches in [2, 4] to identify appropriate data attributes that need to be involved in the mobile application. According to the investigation of necessary traffic data in the real-world observations and evaluations utilizing our implemented prototypes, we reveal that required traffic data features are time, location (road segment), direction, traffic flow’s average velocity, while further attributes such as reason causing such traffic condition, comment by user are optional.
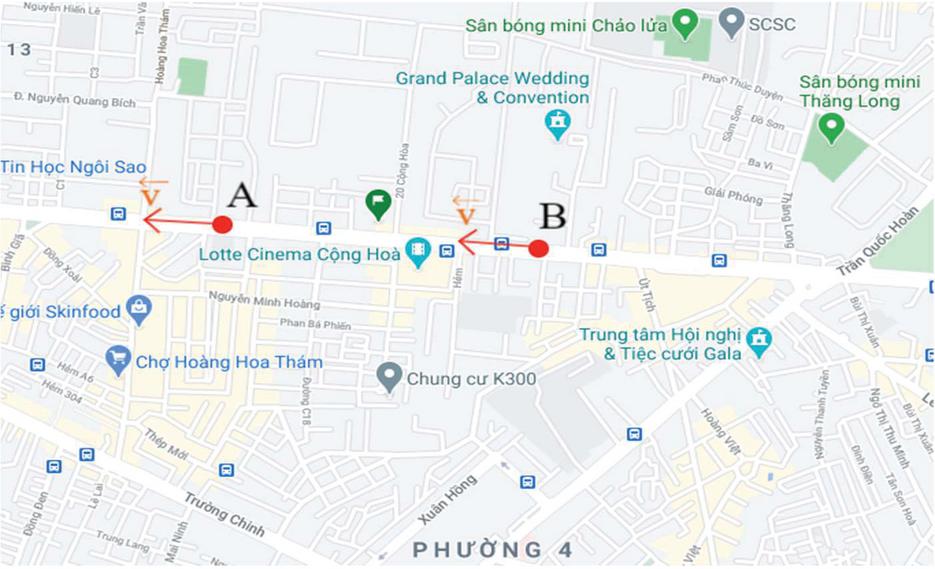
Figure 5 Velocity vectors of moving users are automatically identified using the GPS module in the hand-free mode.
The number of data fields mentioned above is small enough to be included in an input form of a mobile application which requires a small number of screen interactions from users. However, via the experiments by a proof-of-concept prototype, we recognized that users/drivers are commonly not free to interact with the mobile application for sharing data. We resolve this issue by providing hand-free mode in the mobile application where traffic data are automatically computed leveraging GPS modules equipped on mobile devices. This is one of the novelty of our proposed approach compared to the existing one which is described in details as follows.
In the hand-free mode, each mobile user represents as a moving node or a vehicle in a traffic flow whose location, direction, time, and velocity can be automatically extracted from the GPS. These data are then streamed or sent in batch to the system for further analytics. Figure 5 depicts two moving users A and B who velocity vectors (including location, direction, time, and magnitude) are identified automatically using GPS data.
In this approach, the magnitude of user’s velocity, which is called the average velocity of a moving object/vehicle is calculated by estimating the distance between two adjacent locations the object passed during a period of time as described in Equation (1).
| (1) |
Obviously, since GPS samples data frequently the selection of period will affect system performance. If is too small the average velocity in Equation (1) will be calculated frequently requiring more scarce resources in mobile devices and communication bandwidth, degrading the system performance. In contrast, if is too large, the accuracy of average velocity will be degraded. Therefore, it is required to identify an appropriate value for the . In this work we have conducted several observations and evaluation to identify this value as s with following rationales.
As discussed above, the proposed system aims at estimating traffic condition in the granularity level of road segment. Therefore, we need to ensure that during at least one location of a particular moving object A on the considering segment X is collected. This work estimates traffic condition in urban traffic network whose speed limitation is less than 40 km/h (about 11.11 m/s). In this sense, for s an object A can move for maximum 88.88 m. In addition, as shown in Table 1, the average length of road segments in our target traffic network, namely HCMC, is around 81 m to 120 m. Consequently, as s at least one data point will be sensed from the considered road segment where a particular object A is travelling.
4.2 Data Validation and Traffic Estimation
In this design, necessary traffic data such as timestamp, device/driver ID, location (latitude, longitude) and velocity are automatically collected by the mobile application using GPS data as discussed in Section 4.1. With the advances of GPS technologies the accuracy of GPS data is significant. However, GPS may contain noises affecting the average velocity analysis model. This section presents a novel noise removal mechanism along with traffic estimation models to resolve the aforementioned issue.
Denote a vector of m velocities reported by user in the spatial-temporal unit (presented in Section 3.3) which is sorted by increasing velocity values. We apply the inter-quartile range (IQR) to identify and remove the noises, namely V as shown in Equation (3). Here, IQR is defined in Equation (2), where Q1 is the 25th percentile and Q3 is the 75th percentile of the velocity range in the .
| (2) | |
| (3) |
Let of q elements be the set of qualified velocities after removing noises. The average velocity from data reported by user is computed in Equation (4).
| (4) |
Consequently, the average velocity of the considered traffic flow reported by n users from segment X during p (i.e., in the unit) is calculated in Equation (5).
| (5) |
The procedure for calculating the average velocity of traffic flows in , denoted as and its LOS, denoted as is presented in Algorithm 1. The input of this algorithm is and the output of its is both and at the considered road segment in X during a particular computation period p. From line 4 to line 9 is the process to remove noise data (if any) in the data collection reported by an individual user (among n users). Line 10, and line 11 calculate and , respectively. These values are returned in line 12.
4.3 Idle-Aware Data Fusion
The mechanism for timing data sensing presented in the previous section can help to reduce the sensing times significantly. However, there are still issues on fusing of many data that do not contributes to the average velocity calculation and traffic condition estimation. These situations occur when sensing data from stationary objects such as mobile phones carried by officers who are staying at their offices. Obviously, these object locations and velocities are not useful for traffic estimation while the mobile application is still executing leading to the battery drained. In order to overcome this issue, we have proposed the idle-aware data fusion method which is depicted in Figure 6 as follows.

Figure 6 Idle-aware data fusion process.
The data collection function implemented in the mobile application is designed in three states: collecting, idle, and stop and this mechanism is presented in procedure1 as follows.
Procedure 1: Sleep-wakeup based data fusion
Step 1 By default, when the mobile application is on, the data collection function is in the collecting state. Traffic data are collected using GPS signal within the interval s as described in Section 4.1.
Step 2 Parallel to the data collection, the system automatically tracks user movement to decide the next state. If user does not move during a significant period of time, the data collection function will change its state to idle without processing GPS data. The method of identifying user movement is described in details in the later part of this section.
Step 3 After idling for a significant period of time , the system will turn back to validating user movement.
If it detects that user has moved by comparing user’s current location and his/her previous location (at the idling time), it will turn on the collecting state. An essential issue here is on how to identify a suitable value of . Fortunately, we have already analyzed under real-field investigations about the traffic estimation period as discussed in Section 3.2. Therefore, it is suitable to select as the same as the traffic estimation period which is 10 minutes.
Step 4 The aforementioned state changing procedure repeats until user turns off the mobile application explicitly. At this time, the data collection function changes its state to stop.
Identifying user movement: The user movement should be understood as movement of a vehicle that is traveling on street with a relevant speed such as 5km/h during a relevant period of time such as 2 minutes (120s). The process of identifying user movement consists of two phases as described in procedure 2.
Procedure 2: Identifying user movement
Phase 1 Identifying a critical circle C(M,R), where M is the origin position of the mobile users and R is the critical radius. As we have assumed above, with a speed of 5km/h during 2 minutes (120 s) and if user moves in a straight line, then R 120 s*5000 m/3600 s 166.7 m.
Phase 2 Identifying user position during the evaluation time (i.e., 2 minutes). Let : be the set of adjacent user’s positions extracted from GPS data during the evaluation time. It should be noticed that, since the GPS sampling time is s as described in Section 4.1, n 120/8 15. Let k (0 k n) be the number of positions which are inside the circle . If , we can infer that the considering user does not move significantly as all of his or her positions are inside C(M,R). Otherwise, that user is moving.

Figure 7 System implementation model.
5 Implementation
This section presents the implementation of the proposed approaches in an integrated system which can be deployed for real-world applications. The system is implemented in a 3-tier model: Application, Computing server, and Database server as depicted in Figure 7.
• Application: The application is implemented in a mobile application allowing user to interact to the system for user to share GPS data and retrieve traffic information. Two types of functionalities including (i) automations on data collection and pre-processing as discussed in Section 4, and (ii) mobile application GUIs for user to retrieve traffic information and ITS services such as routing have implemented. The application layer connects with the database server via the API server. Figures 8 and 9 present two useful GUIs for mobile users as displaying real-time traffic status on the urban traffic map and providing routing suggestion based on current traffic conditions, respectively. We use this system for evaluating the effectiveness of our proposed methods that is presented in Section 6.

Figure 8 Displaying traffic status on urban traffic map in the mobile application.
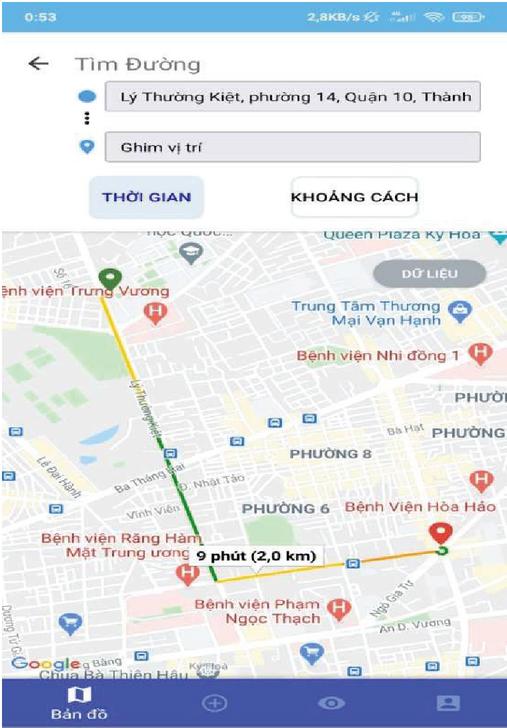
Figure 9 Routing suggestion based on current traffic conditions.
• Computing server: The computing server is the heart of the system that implements data analytic processes such as data validation and traffic estimation as described in Section 4. This component is deployed at the data center or in the cloud.
• Database server: This component stores GPS data reported from users for the computing server to compute traffic estimation. In addition, the analyzed traffic information is also stored to disseminate to users when requested later on. This information is also integrated as a data warehouse (see Figure 1) for further analysis such as to forecast traffic conditions when real-time data are missed or used for urban plan making. This work utilizes MongoDB for data management as it flexibly stores data in a document-based data using JSON format which is compatible with our data design of road segment and traffic status as discussed in Section 3. In addition, data format, indexing and sharding techniques supported by MongoDB can help the scalability of the system be more viable in the future when the system is expanded to apply in other cities rather than just in HCMC at its current stage.
6 Evaluation
This section evaluates and analyzes the feasibility, the effectiveness and the efficiency of the proposed approaches via real-field experiments using the real-world deployed system in Ho Chi Minh City, the largest city in Vietnam. Mobile users use Android smartphones to install our implemented mobile application for evaluation while the cloud server consists of Intel Xeon E-2640 (6 cores, 2.5GHz), RAM 32GB, Bandwidth 14Mbps.
Table 3 Distribution of users in gender
| Number of Samples | Valid Percent (%) | Cumulative Percent (%) | ||
| Valid | Male | 220 | 43.7 | 43.7 |
| Female | 279 | 55.5 | 99.2 | |
| Other | 4 | 0.8 | 100.0 | |
| Total | 503 | 100 |
Table 4 Distribution of users in age
| Number of Samples | Valid Percent (%) | Cumulative Percent (%) | ||
| Valid | Age 20 | 99 | 19.7 | 19.7 |
| 2030 | 280 | 55.7 | 75.3 | |
| 3040 | 97 | 19.3 | 94.6 | |
| 40 | 27 | 5.4 | 100 | |
| Total | 503 | 100 |
6.1 Feasibility
In order to validate the feasibility of the proposed approach, we have launched a website to introduce our project including a link for users to download the mobile application [22]. During 6 months from December 2020 to June 2021 there are more than 2000 users downloaded and used the mobile application. We have conducted a survey to users in order to understand their views about traffic condition in Ho Chi Minh City and their feedbacks on our proposed system in terms of providing useful traffic information and helping them to avoid entering congested areas. Tables 3 and 4 show user distributions in gender and age, respectively. After removing invalid responses we obtained 503 answers from 220 males, 270 females and 4 answers with unclear gender (other). This distribution is mostly balance (between male and female users). Table 4 shows that most of the answers come from users whose age is from 20 to 40 years old (cumulative percent is 94.6%). This fact is positive as young people (age from 20 to 40) is caring traffic information as they commute a lot for their work. On the other hand, young people has advantages in accepting new technologies for problem solving, in this case is using our mobile application for updating traffic information and optimizing their travel routes.
Table 5 shows detailed ratio of users who face to difficulties in terms of traffic condition when they commute in their daily activities and for their work. Here, more than 47% of users face to traffic congestion frequently. Meanwhile, other 49% of people sometimes faces to traffic congestion, revealing a cumulative percentage of 96.6% of people face to difficulties in their daily commuting. This data also explain while more than 90% of users who answered the survey provided positive feedbacks to our proposed mobile application and the system functionalities as they are useful for them.
Table 5 Frequency of users who face to traffic congestion in their daily commuting
| Number of Samples | Valid Percent (%) | Cumulative Percent (%) | ||
| Valid | Frequently | 238 | 47.3 | 47.3 |
| Sometimes | 248 | 49.3 | 96.6 | |
| Never | 17 | 3.4 | 100 | |
| Total | 503 | 100 |
6.2 Effectiveness
Parallel to the feasibility, we have evaluated the effectiveness of the proposed approaches by comparing the accuracy of our solution and the available system, namely TomTom [23]. We have selected a loop of streets whose length is around 5km composing of 110 road segments for experiments. It should be noted that TomTom is not viable at every location in the city, it just works in the city’s center where the density of its users is relevant. However, our system works at any location around the city as mobile users are available everywhere. Therefore, the loop of street selected above was carefully examined as it is in the city’s center and data from TomTom is available for comparison to our proposed method. We have conducted 2 types of experiments simultaneously as follows.
Firstly, we asked 20 volunteers to carry mobile phones installing our developed application and travel on the aforementioned streets in 15 days during time frames with heavy traffic, namely from 6:00AM – 8:00AM. The traffic data were automatically sensed and reported to the analytic server for computing traffic condition as presented in Section 4. Secondly, we used TomTom to collect traffic condition on the same road segments during the same times. Then we compared traffic conditions revealed by the two systems. Figure 10 shows velocities providing by our mobile application compared to those values from TomTom at experimented road segments. The result shows that our methods can estimate traffic state effectively compared to the TomTom. However, as discussed previously, our approach is more ubiquitous while TomTom is viable at limited locations. Therefore, the proposed approach is relevant enough to be applied in real-world application.
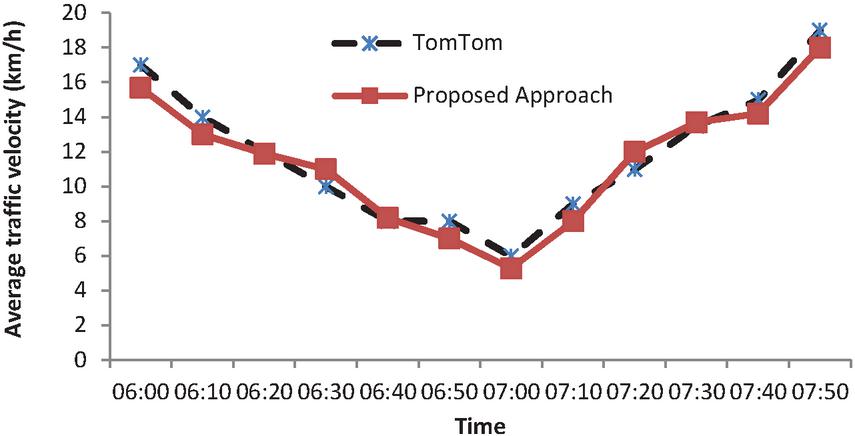
Figure 10 Traffic estimation by our mobile application utilizing GPS data compared to the TomTom.
In addition, we also validate the effectiveness of our proposed system with available systems that are currently being applied in Ho Chi Minh City such as Google Maps [13], the Department of Traffic and Transportation portal (DOTT) [1] and The Voice of Ho Chi Minh City (VOH) radio channel for urban traffic information [7]. Comparing the traffic conditions displayed in our mobile application’s map and those displayed in Google Maps, there are 80% of the cases the traffic conditions are similar. These other 20% (the differences) could come from the lack of real-time traffic data on Google Maps. In order to validate this view, we have analyzed the data from VOH [7] which are records of traffic conditions reported by volunteers to identify the “hot” location-time patterns. A hot pattern means at a given location and in a particular time frame (e.g., at intersection A from 6:30AM – 7:00AM) traffic congestion frequently occurs. From this analysis we obtained 500 hot location-time patterns. We selected 30 patterns from this dataset, named set A. Then, we selected other 30 patterns (location-time) which are not included in the aforementioned 500 hot patterns and named this set B. The purpose of this selection is to narrow the scope of our evaluation while keeping the characteristics of the two datasets completely different.
Validating our system and Google Maps against these two datasets we found that set A provides almost the same results from two systems while the differences come from set B. This result provides a hint for the first-glance opinion that Google Maps missed real-time data at un-hot location-time patterns since the number of its users is not adequate. In order to confirm the above finding, we use camera systems from DOTT [1] for validating which system is more effective. It should be noted that the DOTT does not provide traffic information like the average velocity, or the LOS presented in our work, it just provides real-time video streams about traffic situations. Therefore, we need manually watch on the cameras and compare the situations displayed on our mobile application and on Google Maps. We recognized that, in many cases Google Maps does not correctly represent traffic condition. Meanwhile, our mobile application is confirmable with the camera data. This result confirms the effectiveness of our proposed approach which better reflects to real-world situations and it is better compared to the state-of-the-art system, namely Google Maps. However, it should be noted that, this evaluation size is still small. We need to investigate better solutions for estimating traffic condition from DOTT such as those from video data analytic [24–26], data mining [27, 28]. These directions not only help to evaluate our currently proposed method better but also provides rich crowd-sourced data from camera to enhance the effectiveness and the robustness of our research in it bigger direction.
6.3 Efficiency
In order to confirm the efficiency of the proposed approach we evaluated the response times of main functionalities, the required memory (RAM) for running mobile application, as well as the battery usage compared to other systems.
Firstly, we evaluated the system’s main functions’ response time using Jmeter [29]. We have conducted 30 experiments with 50 concurrent requests for each of the following main functions: The 1st time loading traffic map (denoted as 1st load), location search (Search), Display 500 and 1000 segments’ traffic state (Dspl 500 Sgm, Dspl 1000 Sgm, respectively), Routing with 2km in distance that consists of from 2 to 4 intersections (denoted as Rtn_2km 2 – 4 intersections). The average response times were then compared with those from the prototype in [4, 8] and with similar functionalities in the DOTT system [1]. Table 6 shows that the proposed approach significantly improves the performance compared to its previous counterpart [4, 8] and the DOTT system. For example, it takes less than a second (930 ms) to display traffic state of 500 segments, while the previous prototype, and the DOTT app [1] requires 2026 ms and 980 ms, respectively. In addition, our approach provided appropriate routing functions to user and continuously reduced the response time from 880 ms to 590 ms compared to our previous work in [4, 8]. Meanwhile, the DOTT system does not work (time out) with this function.
Table 6 The efficiency of the proposed system
| Response Time (ms) | |||
| Functionality | Proposed Approach | Previous Work in [4, 8] | DOTT [1] |
| 1st load | 830 | 1151 | 818 |
| Search | 920 | 1205 | 860 |
| Dsp 500 Sgm | 930 | 2026 | 980 |
| Dsp 1000 Sgm | 1138 | 3292 | 1200 |
| Rtn_2km: from 2 to 4 | 590 | 880 | time out |
| intersections | |||
In addition to the response time, we have evaluated the memory (RAM) usage and battery consumption of the proposed mobile application compared to off-the-shelf mobile applications such as Google Play, YouTube, WhatsApp, and Twitter. We used Android Studio Profiler [30] to evaluate the RAM usage on mobile applications. As shown in Table 7, our proposed approach significantly outperforms the commercial ones as it consumes 262 MB RAM while off-the-shelf ones consume from 200 MB to 400 MB.
Table 7 Memory usage and battery consumption
| Average RAM Usage (MB) | |
| Proposed mobile application | 262 |
| Google Play | 200 |
| YouTube | 230 |
| 264 | |
| 400 |
For the energy saving, we have conducted statistical comparison on the battery consumption by our proposed mobile application and common functions on mobile devices such as the screen and Android system. We conducted the experiments on Xiaomi Mi 9T, Android version 10, CPU Snapdragon 730, 8 cores, RAM 6GB. We revealed that on average our proposed mobile application consumes 11.66% of the battery which is significantly lower than that in Screen and Android system consumptions which are 11.75% and 18.04%, respectively. This battery saving comes mainly from the idle-aware data fusion mechanism presented in Section 4.
The evaluation results presented above confirm the feasibility, effectiveness and efficiency of the proposed approach and the deployed mobile application leading to their readiness for real-world applications.
7 Conclusion
This paper proposed a novel approach to mobile crowd-sourced data fusion and urban traffic estimation. We have devised an effective system architecture which consists of mobile crowd-sourced traffic data fusion and traffic condition estimation. Appropriate models for crowd-sourced data validation to improve the quality of input data thus enhance the quality of the analyzed traffic condition has been proposed. The idle-awareness data confusion helps to save the scarce computational, communication resources, and battery thus improving the effectiveness and the efficiency of the proposed approaches.
Experimental results from real-field deployments of our proposed system in Ho Chi Minh City, the largest city in Vietnam, revealed the feasibility and the robustness of our proposed approaches. The proposed system provided accurate and in-time traffic information to different stakeholders including commuters and authorities for their operational tasks as well as urban policy making. We have conducted a thorough survey on mobile users to understand their need of a system that supports them updating traffic information, finding suitable routes, thus help eliminating traffic congestion in big cities. Surveyed data obtained from an adequate number of users reveal that the proposed system and mobile application for traffic estimation are useful for mobile users. In addition, the evaluation results also confirmed that the proposed approaches outperform the state-of-the-art systems in terms of effectiveness and efficiency. These results reveal that the proposed system is ready for applying to real-world applications, not only in Ho Chi Minh City but also in urban cities that are facing traffic congestion issues, especially in developing countries where traffic infrastructures have not yet been developed well.
This research also leads to potential research directions on enhancing the utilization of crowd-sourced data fusion and analytic to resolve traffic congestion issues. This work utilized only data from mobile users so that there still some limitations on the coverage, the availability of real-time data and the means for double-checking of data from different sources for data validation. In this sense, we need to investigate other traffic data sources which are already available but are not in a good structure for traffic estimation. For example, we can research on computer vision [24–26], data mining and machine learning [27, 28] techniques to analyze data from city’s camera systems for traffic estimation. In addition, data mining techniques are worth to be investigated and applied to predict traffic condition at locations where real-time data are missed to enhance the effectiveness of the proposed approaches. Another potential research direction is to study on incentive models such as game theory for data crowd sourcing to encourage user using our system thus contribute more data to improve the quality of traffic estimation models.
Acknowledgement
This research is funded by Vietnam National University HoChiMinh City (VNU-HCM) under grand number DS2021-20-01.
References
[1] Dept. of Traffic and Transportation (DOTT), “Road traffic portal, HCMC,” http://giaothong.hochiminhcity.gov.vn/, accessed Nov. 2021.
[2] Q. T. Minh, H. N. Pham-Nguyen, H. M. Tan, and N. X. Long, “Traffic congestion estimation based on crowd-sourced data,” International Conference on Advanced Computing and Applications, pp. 119–126, 2019.
[3] Ministry of Transport of Vietnam, “Table of speed specifications for all drivers.” https://luatvietnam.vn/tin-phap-luat/bang-quy-dinh-ve-toc-do-toi-da-moi-tai-xe-can-nho-230-18150-article.html, accessed Nov. 2021.
[4] H. M. Tan, H. N. P. Nguyen, N. H. Phat, T.M. Quang, “Traffic Condition Estimation Based on Historical Data Analysis,” the 8th International conference on communications and electronics, Phu Quoc, Vietnam, pp. 256–261, 2021.
[5] Japan Ministry of Land Infrastructure and Transport, “The system outline of VICS.” https://www.vics.or.jp/en/index.html, accessed Nov. 2021.
[6] Y. Zhao, Y. Zhang, T. Yu, T. Liu, X. Wang, X. Tian, and X. Liu, “Citydrive: A map-generating and speed-optimizing driving system,” INFOCOM, pp. 1986–1994, 2014.
[7] The Voice of Ho Chi Minh City (VOH), “Urban traffic channel FM 95.6 MHz,” http://voh.com.vn, accessed Nov. 2021.
[8] M. T Ha, P. N. Hoang-Nam, N. X. Long, T. M. Quang, “Mining Urban Traffic Condition From Crowd-Sourced Data,” SN COMPUT. SCI. 1:225, ISSN 2661-8907, (16 pages), 2020.
[9] D. Zanca, S. Melacci and M. Gori, “Toward Improving the Evaluation of Visual Attention Models: a Crowdsourcing Approach,” International Joint Conference on Neural Networks (IJCNN), pp. 1–8, 2020.
[10] Y. Cheng, T. Wang and L. Wang, “Crowd-sourcing user participant recruitment method based on geo-social network,” IEEE 4th Information Technology, Networking, Electronic and Automation Control Conference (ITNEC), pp. 2193–2197, 2020.
[11] B. Deanne, H. Katharine, L. Megan, O. B. James, “The use of crowd sourcing for gathering information about natural disasters”, Risk Fronter 11, 2011.
[12] Ushahidi, Ushahidi, read the crowd, Available: http://www.ushahidi.com, accessed Nov. 2021.
[13] Google Maps, https://www.google.com/maps, accessed Nov. 2021.
[14] Waze, https://www.waze.com/, accessed Nov. 2021.
[15] A. Essien, I. Petrounias, P. Sampaio and S. Sampaio, “Improving Urban Traffic Speed Prediction Using Data Source Fusion and Deep Learning,” IEEE International Conference on Big Data and Smart Computing (BigComp), Kyoto, Japan, pp. 1–8, 2019.
[16] R. Sciberras and F. Inguanez, “Road traffic flow estimation via public IP cameras,” IEEE 8th Int’l Conference on Consumer Electronics – Berlin, Berlin, pp. 1–5, 2018.
[17] Y. Zhao, Y. Zhang, T. Yu, T. Liu, X. Wang, X. Tian, and X. Liu, “City-drive: A map-generating and speed-optimizing driving system,” INFOCOM, pp. 1986–1994, 2014.
[18] Y. Zhao, S. Li, S. Hu, L. Su, S. Yao, H. Shao, H. Wang, and T. Ab-delzaher, “Greendrive: A smartphone-based intelligent speed adaptation system with real-time trafiic signal prediction,” ACM/IEEE 8th Int’l Conference on Cyber-Physical Systems, pp. 229–238, 2017.
[19] D. Wang, L. Kaplan, H. Le, T. Abdelzaher, On truth discovery in social sensing: A maximum likelihood estimation approach, in: the 11th In-ternational Conference on Information Processing in Sensor Networks, NY, USA: ACM, 2012, pp. 233–244 (2012).
[20] D. Wang, L. Kaplan, T. F. Abdelzaher, Maximum likelihood analysis of con?icting observations in social sensing, ACM Trans. Sen. Netw. 10(2) (2014) 1–27 (2014).
[21] Openstreetmap, https://www.openstreetmap.org/map=3/2.55/66.71, accessed Nov. 2021.
[22] Utraffic, https://bktraffic.com/home, accessed Nov. 2021.
[23] TomTom, “Tomtom navigation,” https://www.tomtom.com/enus/drive/car/, accessed Nov. 2021.
[24] T. Huang, “Traffic Speed Estimation from Surveillance Video Data: For the 2nd NVIDIA AI City Challenge Track 1,” IEEE/CVF Conference on Computer Vision and Pattern Recognition Workshops (CVPRW), pp. 161–1614, 2018.
[25] C. Liu, D. Q. Huynh, Y. Sun, M. Reynolds and S. Atkinson, “A Vision-Based Pipeline for Vehicle Counting, Speed Estimation, and Classification,” in IEEE Transactions on Intelligent Transportation Systems, vol. 22, no. 12, pp. 7547–7560, 2021.
[26] E. Ua-areemitr, A. Sumalee and W. H. K. Lam, “Low-Cost Road Traffic State Estimation System Using Time-Spatial Image Processing,” in IEEE Intelligent Transportation Systems Magazine, vol. 11, no. 3, pp. 69–79, 2019.
[27] A. K. Ikiriwatte, D. D. R. Perera, S. M. M. C. Samarakoon, D. M. W. C. B. Dissanayake and P. L. Rupasignhe, “Traffic Density Estimation and Traffic Control using Convolutional Neural Network,” International Conference on Advancements in Computing (ICAC), pp. 323–328, 2019.
[28] Y. Sekikawa, K. Ishikawa and H. Saito, “Constant Velocity 3D Convolution,” in IEEE Access, vol. 6, pp. 76490–76501, 2018.
[29] A. JMeter, “Apache jmeter,” https://jmeter.apache.org, accessed Nov. 2021.
[30] Android Profiler, https://developer.android.com/studio/profile/android-profiler, accessed Nov. 2021.
Biographies

Quang Tran Minh is an associate professor at Faculty of Computer Science and Engineering, Hochiminh City University of Technology, Vietnam and a visiting researcher at Shibaura Institute of Technology, Tokyo, Japan. He has been a researcher at Network Design Department, KDDI Research Inc., Japan (2014–2015) and a researcher at Principles of Informatics Research Division, National Institute of Informatics (NII), Japan (2012–2014). His research interests include mobile and ubiquitous computing, IoT, network design and traffic analysis, disaster recovery systems, data mining, and ITS systems. Prof. Quang received his Ph.D. in Functional Control Systems from Shibaura Institute of Technology. He is a member of IEEE, ACM.

Phat Nguyen Huu received his B.E. (2003), M.S. (2005) degrees in Electronics and Telecommunications at Hanoi University of Science and Technology (HUST), Vietnam, and Ph.D. degree (2012) in Computer Science at Shibaura Institute of Technology, Japan. Currently, he lecturer at School of Electronics and Telecommunications, HUST Vietnam. His research interests include digital image and video processing, wireless networks, ad hoc and sensor network, and intelligent traffic system (ITS) and internet of things (IoT). He received the best conference paper award in SoftCOM (2011), best student grant award in APNOMS (2011), hisayoshi yanai honorary award by Shibaura Institute of Technology, Japan in 2012.

Takeshi Tsuchiya received his Ph.D degree (2009) in Engineering at Waseda University, Japan. Currently, he is an Associate Professor of Department of Applied Information Engineering at Suwa University of Science. His recent interests include distributed collaborate system, distributed machine learning platform, and web marketing prediction system. He is member of IEICE, IPSJ, and IEEE.
Journal of Mobile Multimedia, Vol. 18_4, 1035–1062.
doi: 10.13052/jmm1550-4646.1844
© 2022 River Publishers