Thyroid Disease Prediction Using XGBoost Algorithms
S. Sankar1, Anupama Potti2, G. Naga Chandrika3 and Somula Ramasubbareddy3,*
1Department of CSE, Sona College of Technology, Salem, India
2Department of CSE, Sree Dattha Institute of Engineering and Science, Hyderabad, India
3Department of IT, VNRVJIET, Hyderabad, India
E-mail: sankarcsharp@gmail.com; anunithyalohith@gmail.com; gnchandrika@gmail.com; svramasubbareddy1219@gmail.com
*Corresponding Author
Received 11 October 2021; Accepted 03 December 2021; Publication 22 January 2022
Abstract
Nowadays, thyroid disease is increasing rapidly all over the world. Significantly, one out of ten people is affected by the thyroid in India. In recent years, many researchers have done various research works on thyroid disease detection. Therefore, the early stage of thyroid disease prediction is difficult to protect and avoid the worst health condition. In this regard, the machine learning plays a crucial role to detect the disease accurately. We consider the UC Irvin knowledge discovery dataset. So, this paper proposes the XGBoost algorithm to predict thyroid disease accurately. The best features are selected using XGBoost function. The proposed XGBoost algorithm’s efficacy is compared to decision tree, logistic regression, k-Nearest Neighbor (kNN) methods. The performance of all four algorithms is compared and analyzed. It is observed that the accuracy of the XGBoost algorithm increases by 2% than the KNN algorithm.
Keywords: Classification algorithm, disease prediction, hormone, k-Nearest neighbor, machine leaning, thyroid disease, XGBoost.
1 Introduction
Nowadays, computer biology uses recent advancements in technology to collect and store patient details. In addition, disease prediction algorithms play a predominant role in detecting and diagnosing the disease at the early stages. The medical information system contains numerous datasets. But there is no traditional algorithm to predict the disease accurately in each stage. However, machine learning plays a crucial role in solving complex problems. The optimal and better disease prediction model is required to select the features and classify the diseases. Otherwise, the misclassification may occur to predict wrongly in the dataset [1].
The thyroid is a gland that produces hormones and controls the metabolism of the body. As per the survey, ten out of one person is affected by thyroid disease in India. Thyroid disease has mainly affected women’s and their ages between 17 and 54 [2, 3]. The final stage of the thyroid causes cardiovascular diseases, increases blood pressure in the human body, increases cholesterol values, and creates mind depression. The thyroid gland generates hormones, namely L-thyroxin (T4) and tri-iodothyroxine (T3). It relates to various activities like producing heat, utilization of carbohydrates, fat and protein [4].
The thyroid is categorized into two types, namely hyperthyroidism and hypothyroidism. Hyperthyroidism is caused by producing an extra amount of thyroid hormones. The symptoms of hyperthyroidism are increasing sensitivity, body temperature, weight loss, blood pressure and heart rate, enlargement of the neck, nervousness, shortened menstrual period, etc. Hypothyroidism is caused by producing fewer amounts of thyroid hormones. The symptoms of hypothyroidism are obesity, neck swelling, hair loss, lengthened menstrual period, etc. [5–7].
In the healthcare domain, Machine Learning (ML) algorithms play a major role in accurately classifying and predicting thyroid disease. We consider the UC Irvin knowledge discovery dataset [8–10]. In general, the data is gathered from health organizations, meaningless until the data has transformed into useful information. So, this paper proposes the XGBoost algorithm to predict thyroid disease accurately. The proposed XGBoost algorithm’s efficacy is compared to decision tree, logistic regression, k-Nearest Neighbor (kNN) methods. It has been noticed that the XGBoost method outperforms other categorization algorithms in terms of accuracy.
The contribution of the paper is given below:
• This paper proposes the XGBoost algorithm to predict thyroid disease accurately. The best features are selected using XGBoost function.
• The proposed XGBoost algorithm’s efficacy is compared to decision tree, logistic regression, k-Nearest Neighbor (kNN) methods. It is observed that the accuracy of the XGBoost algorithm increases by 2% than the KNN algorithm.
In the following order, the paper is structured: Section 2 outlines the related work. Section 3 presents various ML algorithms. Section 4 proposes XGBoost algorithm. Section 5 provides the conclusion and future work of this comparative study.
2 Related Work
Section 2 examines different thyroid illness prediction systems that use machine learning techniques.
Chaubey et al. [11] analyzed thyroid disease prediction using various ML algorithms. This work is compared the accuracy of logistic regression, kNN and decision tree. The primary aim of this research is to demonstrate how to predict thyroid illness and how to improve thyroid prediction accuracy. The new thyroid dataset from the UCI repository was used in this work. From this comparative study, we observed that the accuracy of kNN is better than logistic regression and decision tree. It is mainly due to the consideration of distance metrics to select the features from the given dataset. However, the accuracy of all the above-mentioned algorithms reaches up to 96%.
Temurtas [12] proposed a comparative study of thyroid disease prediction. The thyroid is a gland that generates hormones. It regulates the body metabolism. It is categorized into two types, namely hypo and hyperthyroid. Thyroid disease classification is a challenging task in the thyroid dataset. A comparative research on thyroid illness detection was conducted in this paper utilizing a multilayer neural network; a learning vector quantization based neural network, and a probability-based neural network. It is noticed that the probability-based neural network provides superior performance than other neural networks. However, it needs to increase the accuracy percentage to diagnosis the disease.
Data mining approaches were developed by Begum and Parkavi [13] to predict thyroid illness. In the healthcare sector, the vital challenge is diagnosing the disease early and providing the appropriate treatment. The traditional way of thyroid disease is diagnosed through clinical examination and blood test. The primary objective is used to increase the accuracy of the thyroid disease datasets. Therefore, data mining techniques are beneficial and vital in the healthcare sector for diagnosing the disease. This paper main intention is to identify the category accurately. However, it is analyzed with old techniques.
Tyagi et al. [14] proposed thyroid disease prediction using ML algorithms. There are several essential organs in our body that are controlled by the thyroid gland. Generally, the thyroid is categorized into two types, namely hypo and hyperthyroidism. The data is generated from the human body in the health organization. Then, the data is preprocessed using the data cleansing method. In this case, machine learning is essential for illness detection. The dataset was obtained from the University of California, Irvine’s repository. This paper has performed the comparison of various ML algorithms, namely SVM and KNN, to predict thyroid disease.
Asif et al. [15] proposed CAD-based Thyroid diagnosis system using ML algorithms. Detecting the early stage of thyroid disease is important to provide useful treatment to the affected persons. The dataset was obtained from the University of California, Irvine’s repository. This paper proposed a multilayer perceptron to increase the accuracy of thyroid diseases. The proposed multilayer perceptron’s performance is evaluated to that of KNN, AdaBoost, SVM, and Gradient Boosting classifiers. The proposed multilayer perceptron classification provides better accuracy than other classification algorithms. However, the different classifiers are also nearer to the accuracy of the multilayer perceptron classifier.
Salman and Sonuc [16] proposed thyroid disease classification using ML algorithms. In the healthcare sector, dealing with large scale data is very difficult. So, this paper focused on ML algorithms. In this paper, the authors have used the dataset, which is collected from the Iraqi people. It contains three types of the gland, namely hypothyroidism, normal and hyperthyroidism. The authors used ML algorithms to predict thyroid category, namely SVM, random forest, KNN, naïve Bayes, and Multilayer perceptron. The performance of various ML algorithms is implemented and compared. However, it needs to increase the classification accuracy.
Rehman et al. [17] proposed a K nearest algorithm to analyze thyroid disease. This work is consists of three ways: KNN without feature selection, KNN with chi-square based feature selection, KNN with L1 based feature selection. The dataset is taken from the KEEL dataset repository and real-time data is taken from Pakistan hospital. The newly generated dataset is included new features such as Body Mass Index (BMI), pulse rate, and Blood pressure. The performance of the three techniques is compared and the chi-square-based feature selection provided higher accuracy than other techniques, especially for the new datasets.
Riajuliislam et al. [18] proposed an early prediction of Hypothyroid using classification algorithms. Hypothyroidism shows the typical changes in female patients. It is slowly changed into a dangerous disease. Predicting disease in the early stage is a critical task. So, machine learning plays a major role in predicting the conditions. This paper is used recursive feature selection, principal component analysis, and univariate feature selection with various classification algorithms, namely SVM, Decision tree, logistic regression, and random forest. The result shows that recursive feature selection is provided 99.3% accuracy. However, it is suitable for only hypothyroid diseases.
The research gap is identified from the related works. In Section 2, various ML algorithms are proposed to increase the accuracy of thyroid disease prediction. From the related works, we identified certain disadvantages, namely less prediction accuracy and older techniques. To increase the prediction accuracy, this paper proposes the XGBoost algorithm to predict thyroid disease accurately. The proposed XGBoost method is compared against logistic regression, k-Nearest Neighbour (kNN), XGBoost, and decision tree algorithms in order to compare its performance. Thus, it shows the performance of the prediction accuracy level. Table 1 shows the various classification algorithms are used in related works.
Table 1 Various classification algorithms in related works
| Author’s | Classification Algorithms | Advantages | Limitations |
| Chaubey et al. [11] | Comparision of logistic regression, kNN and decision tree | Increased the accuracy | It is reached maximum accuracy 96% |
| Temurtas [12] | multilayer neural network; a learning vector quantization based neural network, and a probability-based neural network | Increased the accuracy | It is not provided the accuracy at maximum level. |
| Begum and Parkavi [13] | Data mining approaches | Identified the disease category accurately | It is old technique |
| Tyagi et al. [14] | SVM and KNN | Increased the accuracy | It is not up to the level |
| Asif et al. [15] | KNN, AdaBoost, SVM, and Gradient Boosting | Provided better accuracy | It is nearer to the accuracy of the multilayer perceptron classifier |
| Salman and Sonuc [16] | SVM, random forest, KNN, naïve Bayes, and Multilayer perceptron | Increased the accuracy to certain extent | It needs to increase the classification accuracy. |
| Rehman et al. [17] | KNN with chi-square based feature selection, KNN with L1 based feature selection | chi-square-based feature selection provided higher accuracy | It needs to increase the classification accuracy. |
| Riajuliislam et al. [18] | SVM, Decision tree, logistic regression, and random forest | recursive feature selection is provided 99.3% accuracy | It is suitable for only hypothyroid diseases. |
3 Existing Classification Algorithms
This section discusses various classification algorithms which are already used to predict the thyroid disease prediction.
3.1 Logistic Regression
Logistic regression is a type of supervised learning technique that is frequently used to solve classification issues. It is a type of predictive analytic method that is predicated on the idea of probability. It calculates the complicated cost function from the sigmoid function. The cost function of Logistic Regression is between 0 and 1 [19]. The hypothesis of Logistic Regression is represented using Equation (1).
| (1) |
where indicates the hypothesis of logistic regression’s cost function.
3.2 Decision Tree
The decision tree method is one of the supervised learning algorithms, and it is used to address classification and regression issues in data science and engineering. The main objective of the decision tree is to develop a training model that can be used to forecast the class of interest. In general, the decision tree starts with the tree’s root node for indicating the class label. The values of the root attribute are then compared to the values of the dataset attribute. The condition check goes on to the next branch of the tree based on the results of the comparison. The decision tree has the following assumptions: Initially, the entire training set is treated as the root node. It is generally categorized into two types, namely categorical and continuous variable decision trees. The categorical decision tree contains a target variable with a categorical value. The continuous decision tree contains target variables with continuous values. Categorical values are most preferable in the feature values. The attribute values are recursively distributed from the records [20].
3.3 K-Nearest Neighbor Algorithm
The K-Nearest Neighbor (KNN) algorithm is a supervised learning method that is used to find the nearest neighbour. It is suitable for classification and regression problems. It assumes the similarity between new data and old data. It assigns the new data into a similarly matched category. It has two properties, namely lazy and non-parametric learning algorithms [21].
• Lazy learning: It does not have separate training set and uses complete dataset for training.
• Non-parametric learning: It does not consider anything for underlying the data.
4 Proposed Thyroid Classification Algorithm
This paper proposes the use of the XGBoost algorithm to reliably forecast thyroid illness. It takes input data from the thyroid dataset. The data set is split into three categories: training data, testing data, and validation data. The training data is applied to the proposed XGBoost algorithm to evaluate the best feature and classify the data using the XGBoost decision function. The test data will be tested using an already trained XGBoost model. Finally, it predicts thyroid disease accurately. The proposed XGBoost algorithm workflow is shown in Figure 1.
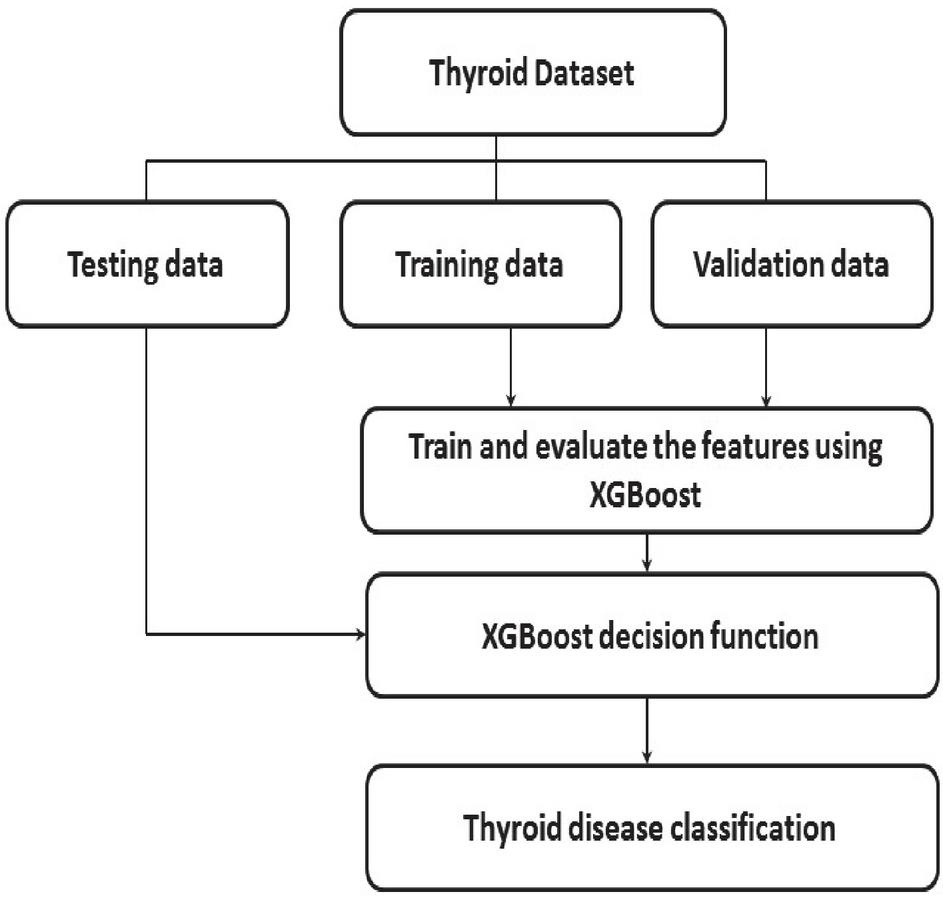
Figure 1 Workflow of proposed XGBoost algorithm.
4.1 Dataset Description
The thyroid dataset used in this study was obtained from the University of California, Irvine (UCI) repository [22]. The reason behind the dataset is prevalent and most of them using the dataset for thyroid disease classification. The dataset contains 3 classes, namely normal, hyper and hypothyroid. The dataset has a total of 215 instances. The instance count in normal, hyper and hypo thyroids are 150, 35 and 30, respectively. The thyroid dataset contains five features. The features are T3 resin value, total serum thyroxin value, total serum triiodothyronine value, thyroid stimulating hormone value and Major difference between Thyroid stimulating hormone and after taking thyrotropin injection. The name of the features are shown in Table 2.
Table 2 Thyroid dataset features
| Features | Values |
| 1 | T3 resin value |
| 2 | Total serum thyroxin value |
| 3 | Total serum triiodothyronine value |
| 4 | Thyroid stimulating hormone value |
| 5 | Major difference between Thyroid stimulating hormone and after taking thyrotropin injection. |
4.2 Proposed XGBoost Algorithm
Extreme Gradient Boosting (XGBoost) is an ensemble tree that follows a gradient descent structure to enhance the weak learners [23]. It is a level by level additive modelling. Initially, XGBoost fits the data to the weak classifier. Later, it fits the data to another weak classifier for increasing the ith accuracy without affecting the current model. The same process continues until it provides the best accuracy. The overall workflow is summarized as follows:
Let consider the input dataset DS and it is represented in Equation (2).
| (2) |
where n is the number of occurrences, m denotes the number of features, and b and c denote the features and target variable, respectively.
The thyroid dataset contains n 125 instances and m 5 features. The sum of the predicted scores in k trees are calculated using Equation (3).
| (3) |
where indicates the instance in the th boost, indicates th instance of training set.
The value of th tree is represented by and all the values of decision tree is represented by F. The XGBoost reduces the lose function and it is given Equation (4).
| (4) |
XGBoost defines the learning rate and hyper parameter values and it is given in Table 3.
Table 3 XGBoost parameters
| Parameter | Default Value |
| Nthread | max |
| Minimum child weight | 1 |
| Maximum depth | 6 |
| 0 | |
| Learning rate | 0.3 |
| A | 0 |
| 1 | |
| Number of trees to fit | 100 |
In XGBoost, the objective function considers the loss function and regularization term to choose predicate function. The Objective Function (OF) of XGBoost is given in Equation (5).
| (5) |
Where L indicates the loss function, indicates predicted label and indicates actual label. R(f) indicates penalizing computing function in the training tree.
To define the complexity, we first define the tree function f(b), which is given in Equation (6).
| (6) |
where w indicates the leaf score of the tree, q indicates mapping function between data samples and corresponding leaf. The L indicates number of leaves in the tree.
The complexity of penalize model’s calculation is given in Equation (7).
| (7) |
Where and are constant values, each leaf value is represented by . indicates weight value of the tree.
The XGBoost follows an additive model which indicates the curve tree result with previous tree result. At th step, the Objective Function (OF) is calculated and it is given in Equation (8).
| (8) |
Where indicates minimization of objective function and c is a constant.
Further, we compute the second order Taylor series and it is given in Equation (9).
The calculation of and are given in Equations (10) and (11).
| (10) | ||
| (11) |
In order to remove constant, we obtain Equation (12) by adding regularization term from Equation (7).
| (12) |
Finally, the XGBoost algorithm is selected good features and predicts the disease accurately. The overall XGBoost classification process is given in Algorithm 1.
Algorithm 1 Proposed XGBoost
1: Thyroid dataset
2: Prediction of thyroid disease
3: Dataset is split into training, testing and validation set
4: sum of predicted tree is calculated using Equation (3)
5: XGBoost loss function is calculated using Equation (4).
6: Objective function calculation process
7: XGBoost tree construction is defined in Equation (6).
8: The complexity of penalize model is calculated using Equation (7).
9: Final tree construction process is calculated using Equation (12).
10: The test set is matched with XGboost decision function
11: Prediction of thyroid diseases.
Table 4 Performance comparison of various machine learning algorithms
| Logistic | Decision | KNN | XGBoost | |
| Regression (%) | Tree (%) | (%) | (Proposed) (%) | |
| Test misclassification (%) | 18.75 | 12.5 | 3.125 | 2.15 |
| Validation misclassification (%) | 15.625 | 3.12 | 6.25 | 5.50 |
| Accuracy (%) | 81.25 | 87.5 | 96.875 | 98.59 |

Figure 2 Performance comparison of various machine learning algorithms.
5 Result and Discussions
Various ML algorithms are implemented and applied to the UCI thyroid dataset to predict the accuracy. This paper proposed the XGBoost algorithm to increase the prediction accuracy among other ML algorithms, namely logistic regression, decision tree and KNN. Table 4 shows the performance comparison of various ML algorithms. Here, this paper considers the percentage of training, testing and validation are 70%, 15% and 15%, respectively. The test misclassifications in logistic regression, decision tree, KNN and XGBoost are 18.75%, 12.5%, 3.125% and 2.15%, respectively. The validation misclassification in logistic regression, decision tree, KNN and XGBoost are 15.625%, 3.12%, 6.25% and 5.50%, respectively. The accuracy in logistic regression, decision tree, KNN and XGBoost is 81.25%, 87.5%, 96.875% and 98.59%, respectively. It is mainly due to the consideration of the XGBoost algorithm to select the features in the thyroid dataset appropriately. The accuracy is calculated in Equation (13).
| (13) |
Where true positive, true negative, false negative, and false positive, respectively, are denoted as TP, TN, FN, and FP.
Figure 2 compares the performance of several machine learning methods. The proposed XGBoost algorithm’s performance is compared against logistic regression, decision trees, and KNN. The accuracy of the proposed XGBoost increases by 2%, 12% and 17% compared to KNN, Decision tree and logistic regression.
6 Conclusion and Future Work
An early stage of thyroid disease prediction is difficult to protect and avoid the worst health condition. We consider the UC Irvin knowledge discovery dataset. So, this paper proposes the XGBoost algorithm to predict thyroid disease accurately. The proposed XGBoost algorithm’s efficacy is compared to decision tree, logistic regression, k-Nearest Neighbor (kNN) methods. The performance of all four algorithms is compared and analyzed. The accuracy of the proposed XGBoost increases by 2%, 12% and 17% compared to KNN, Decision tree and logistic regression.
In the future work, we planned to adapt Long Term Short Memory (LSTM) algorithms to analyze the real-time healthcare data. Thus, developing algorithms and thyroid illness predictive models that use minimal attributes to detect thyroid disease saves money and time.
References
[1] Jha, R., Bhattacharjee, V., and Mustafi, A. (2021). Increasing the Prediction Accuracy for Thyroid Disease: A Step Towards Better Health for Society. Wireless Personal Communications, 1–18.
[2] Shahajalal, M., Rahman, M., Pranto, S., Ema, R. R., Islam, T., and Raihan, M. (2022). Utilization of Machine Learning Algorithms for Thyroid Disease Prediction. In International Conference on Innovative Computing and Communications (pp. 57-69). Springer, Singapore.
[3] Rajeswari, C., Sathiyabhama, B., Devendiran, S., and Manivannan, K. (2014). Bearing fault diagnosis using wavelet packet transform, hybrid PSO and support vector machine. Procedia Engineering, 97, 1772–1783.
[4] Hosseinzadeh, M., Ahmed, O. H., Ghafour, M. Y., Safara, F., Ali, S., Vo, B., and Chiang, H. S. (2021). A multiple multilayer perceptron neural network with an adaptive learning algorithm for thyroid disease diagnosis in the internet of medical things. The Journal of Supercomputing, 77(4), 3616–3637.
[5] Rehman, H. A. U., Lin, C. Y., Mushtaq, Z., and Su, S. F. (2021). Performance Analysis of Machine Learning Algorithms for Thyroid Disease. Arabian Journal for Science and Engineering, 1–13.
[6] Vadivu, P. S. (2021, June). Improved Ensemble Classification Method for Thyroid Disease Using Data Mining Technologies. In 2021 5th International Conference on Trends in Electronics and Informatics (ICOEI) (pp. 1–7). IEEE.
[7] Vinodhini, V., Vishalakshi, A., Chandrika, G. N., Sankar, S., and Ramasubbareddy, S. (2022). Predicting Vasovagal Syncope for Paraplegia Patients Using Average Weighted Ensemble Technique. Journal of Mobile Multimedia, 135–162.
[8] Revathi, T. K., Sathiyabhama, B., and Sankar, S. (2021). A Deep Learning based approach for Diagnosing Coronary Inflammation with Multi-Scale Coronary Response Dynamic Balloon Tracking (MSCAR-DBT) based artery Segmentation in Coronary Computed Tomography Angiography (CCTA). Annals of the Romanian Society for Cell Biology, 25(6), 4936–4948.
[9] Revathi, T. K., Sathiyabhama, B., and Sankar, S. (2021). Diagnosing Cardio Vascular Disease (CVD) using Generative Adversarial Network (GAN) in Retinal Fundus Images. Annals of the Romanian Society for Cell Biology, 2563–2572.
[10] Vinodhini, V., Sathiyabhama, B., Sankar, S., and Somula, R. (2020). A Deep Structured Model for Video Captioning. International Journal of Gaming and Computer-Mediated Simulations (IJGCMS), 12(2), 44–56.
[11] Chaubey, G., Bisen, D., Arjaria, S., and Yadav, V. (2021). Thyroid disease prediction using machine learning approaches. National Academy Science Letters, 44(3), 233–238.
[12] Temurtas, F. (2009). A comparative study on thyroid disease diagnosis using neural networks. Expert Systems with Applications, 36(1), 944–949.
[13] Begum, A., and Parkavi, A. (2019, March). Prediction of thyroid disease using data mining techniques. In 2019 5th International Conference on Advanced Computing & Communication Systems (ICACCS) (pp. 342–345). IEEE.
[14] Tyagi, A., Mehra, R., and Saxena, A. (2018, December). Interactive thyroid disease prediction system using machine learning technique. In 2018 Fifth International Conference on Parallel, Distributed and Grid Computing (PDGC) (pp. 689–693). IEEE.
[15] Asif, M. A. A. R., Nishat, M. M., Faisal, F., Shikder, M. F., Udoy, M. H., Dip, R. R., and Ahsan, R. (2020, December). Computer Aided Diagnosis of Thyroid Disease Using Machine Learning Algorithms. In 2020 11th International Conference on Electrical and Computer Engineering (ICECE) (pp. 222–225). IEEE.
[16] Sonuç, E. (2021, July). Thyroid Disease Classification Using Machine Learning Algorithms. In Journal of Physics: Conference Series (Vol. 1963, No. 1, p. 012140). IOP Publishing.
[17] Abbad Ur Rehman, H., Lin, C. Y., and Mushtaq, Z. (2021). Effective K-Nearest Neighbor Algorithms Performance Analysis of Thyroid Disease. Journal of the Chinese Institute of Engineers, 44(1), 77–87.
[18] Riajuliislam, M., Rahim, K. Z., and Mahmud, A. (2021, February). Prediction of Thyroid Disease (Hypothyroid) in Early Stage Using Feature Selection and Classification Techniques. In 2021 International Conference on Information and Communication Technology for Sustainable Development (ICICT4SD) (pp. 60–64). IEEE.
[19] Nusinovici, S., Tham, Y. C., Yan, M. Y. C., Ting, D. S. W., Li, J., Sabanayagam, C., … and Cheng, C. Y. (2020). Logistic regression was as good as machine learning for predicting major chronic diseases. Journal of clinical epidemiology, 122, 56–69.
[20] Charbuty, B., and Abdulazeez, A. (2021). Classification based on decision tree algorithm for machine learning. Journal of Applied Science and Technology Trends, 2(01), 20–28.
[21] Tjahjadi, H., and Ramli, K. (2020). Noninvasive blood pressure classification based on photoplethysmography using k-nearest neighbors algorithm: A feasibility study. Information, 11(2), 93.
[22] https://archive.ics.uci.edu/ml/datasets/Thyroid+Disease
[23] Chen, T., Guestrin, C., 2016. XGBoost: A scalable tree boosting system. In: Proc. 22nd ACM SIGKDD Int. Conf. Knowl. Discovery Data Mining, Aug. 2016, pp. 785–794.
Biographies

S. Sankar received M.E degree from Anna University and PhD degree from VIT University, Vellore, India in 2019. He is currently working as an Assistant Professor in Sona college of Technology, Salem. Research interest includes Internet of Things, Wireless Sensor Networks and Machine Learning. He has published various papers in international journals and conferences.

Anupama Potti currently working as Assistant Professor in Department of Computer Science and Engineering in Sree Dattha Engineering And Science. She Completed Master’s degree from JNTU Hyderabad and Bachelor Degree from Andhra University in Computer Science and Engineering. Interested Research areas are Machine Learning, Network Security. She has 7 years of teaching experience.

G. Naga Chandrika received the B. Tech degree in Computer Science and Information Technology from JNTU, Hyderabad in 2002 and M. Tech degree in Software Engineering from JNTU, Hyderabad, in 2004. She is currently pursuing Ph.D degree in Computer Science and Engineering at ANU, Guntur, AP, India. Since 2011, she has been an Assistant Professor with the Information Technology Department, VNRVJIET, Hyderabad, India. Her research interests include Data Mining, Machine Learning.

Somula Ramasubbareddy is pursuing his PhD in Computer Science and Engineering (CSE), from VIT University, Vellore, India. He did his M.tech from JNTUA, Anantapur, India in 2015. His research areas are Mobile Cloud Computing, Network security, Distributed Computing, Computer Communications (Networks) and Algorithms, IOT
Journal of Mobile Multimedia, Vol. 18_3, 917–934.
doi: 10.13052/jmm1550-4646.18322
© 2022 River Publishers