The Osteoporosis Disease Diagnosis and Classification Using U-net Deep Learning Process
D. Thrivikrama Rao1, 2,*, K. S. Ramesh2, V. S. Ghali2 and M. Venugopala Rao2
1Hindustan Aeronautics Limited, Bengaluru, Karnataka, India
2Department of Electronics and Communication Engineering, Koneru Lakshmaiah Education Foundation, Vaddeswaram, Andhra Pradesh, India
E-mail: vikram.research16@gmail.com; dr.ramesh@kluniversity.in; gvs0raos@gmail.com; mvgr03@kluniversity.in
*Corresponding Author
Received 22 October 2021; Accepted 29 December 2021; Publication 05 March 2022
Abstract
The purpose of this research has been used to detect osteoporosis disease for Knee radiography. It can improve diagnostic performance over using the scan thermal image mode alone. During 2016 and 2021, researchers gathered CT, MRI, CTA, ultra sound images from individuals who had both skeletal bone density assessment and knee radiology at a local medical clinic for subjective labelling. But following models are most complicate to detect diagnosis of osteoporosis. Therefore, five level convolutional neural networks (CNN) models were used to diagnose osteoporosis from knee radiography. They also looked at ensemble models that included clinical variables in each U-Net. Every net was given an efficiency, accuracy, recall, sensitivity, negative predictive value (npv), F1 measure, and area under curve (AUC) rating. Exclusively knee rays were used to test the U-Net model, but GoogleNet, S-transform, ResNet and FCNN had the lowest accuracy, precision, and specificity. Whenever patient’s data were added, Efficient U-Net had the highest accuracy 99.23%, recall 98.76%, npv 0.93%, F1 score 99.23%, and AUC 99.72% scores among five level prediction methods. The U-Net models correctly identified osteoporosis from Knee radiography, and their performance had improved even more when clinical variables from health records were complex. This u-net based osteoporosis diagnosis is most helpful for future generation for better pre-detections.
Keywords: Osteoporosis, U-Net, deep learning, classification.
Introduction
Nowadays, medical diagnostics play an essential role in identifying bone fracture diseases. The diagnosis of osteoporosis illness may be made using 11bit pulsed s-transform coded thermal wave imaging in this study. Furthermore, using frequency focused phase analysis, the realisation of osteoporosis illness diagnosis is identified. This implementation calculates the proportion of bone fractures and damages, as well as their density and location. The performance metrics, such as density variation signal towards noise ratio & thermal characteristics, is compared to previous techniques at the end of the process. The suggested approach outperforms the experimental results and competes with current technology, according to the findings. In their lifespan, about 50% of females & 20% of men may suffer musculoskeletal disorders [1]. Dual-energy X-ray echocardiography is the main technique of detecting osteoporosis by measuring bone mineral density (BMD) in the femur & lumbar spine (DXA). The US Preventive Services Task Force recommends BMD testing for osteoporosis in women 65 and older to help avoid fractures due to osteoporosis [2]. Because therapeutic medication therapies are more successful in the acute phase before damage occurs, early osteoporosis diagnosis is important for preventing osteoporotic fractures. The presence of substantial inaccuracies produced by the surrounding soft tissues is one drawback of utilising DXA [3, 4]. Radiation exposure & expensive equipment prices are two further drawbacks [5, 6]. It’s critical to have easy access to bone densitometry tests, especially in developing countries [7, 8].
Osteoporosis is a deceptive musculoskeletal illness in which bone density (& calcium content) declines; X-rays may help identify it [9]. The Singh index [10] is a commonly used categorization method for cervical spine bone density based on the qualitative visibility of trabecular types. Quantitative evaluation utilising hip X-ray imaging, on the other side, has also been done since around 1971 [11], for example, calculating the cortical width to overall width ratio [12]. The cortical-thickness score has been shown to have a strong relationship between BMD at the femoral neck & fracture-risk screening tool projections [13, 14]. Furthermore, using receiver operating characteristic (ROC) edge detection, the canal bone ratio has the largest overall effect on osteoporosis and is highly correlated with the T-score [15]. Clinicians have used the bone morphology of hip radiography to diagnose osteoporosis in this way. Artificial intelligence (AI) has been utilised as a screening tool and as an auxiliary technology for image interpretation [16, 17]. Latest advances in AI have led to practical applications helping osteoporosis detection, according to a research paper published in 2019 [18]. The use of dental radiographs [19] spinal radiographs [20], hand and wrist radiographs [21], DXA imaging [19], and spine computed tomography [20] has all been reported. Two studies, however, have used machine learning to identify osteoporosis in hip x-rays [22]. To the best of my knowledge, no studies are available on the use of deep understanding with hip radiographs to diagnose osteoporosis (DL) [23, 24].
To supplement human perceptions, image-only simulations may be employed. And there has been DL research on different image-based fracture prediction techniques; they have not considered clinical variables, which physicians utilise when calculating the pre-test likelihood during the decision process. Structures are imprinted in observable health records by public and care processing parameters, and these patterns may be learnt using statistical learning algorithms [25]. The diagnosis of hip fractures could be anticipated fairly well from pictures alone (AUC 0.78), and it may be enhanced by integrating image characteristics by patient data (AUC 0.86) [26]. Best circumstances of DL image models containing predictor variables may enhance model performance, which is very helpful in clinical settings [27]. Image characteristics combined with patient data should enhance osteoporosis diagnostic precision, according to our theory [28]. The study’s objective was to determine if the addition of clinical data enhances the diagnosis accuracy in comparison to using just the imaging modality while looking for osteoarthritis in hip radiography [29].
2 Resources and Systems
2.1 Study Design
The objective of this research is to identify the occurrence of osteoporosis in the knee joint using Knee radiography images. To replicate the diagnostic spectrum of fractures in the DXA technique, we utilised a divided dataset. The information was further supplemented with clinical variables taken through hospital data. To detect osteoporosis via knee radiography, researchers utilised a variety of convolutional neural networks (CNNs). The effectiveness of the predicted diagnosis of osteoporosis using a mix of clinical variables and different U-net models was examined.
The U-Net based deep learning process is more useful for osteoporosis disease detection at critical diagnosis. In this contest one more thing identified that it is very complex to diagnosis osteoporosis compared to all other organ related diagnosis i.e heart disease, brain, Liver, spinal cord, and lung cancer etc. The following models are easy to identify diagnosis using MRI, CT, CTA and all other radiography [30]. But for osteoporosis it is necessary to scan the bone via thermal imaging concept so that an efficient CNN with U-net deep learning model is imported.
2.2 Data Acquisition
From Apr 2015 through November 2021, we looked back at individual patient data. The Sowjanya Central Hospital’s Review Board approved the proposal for this research (Approval No. 897). This research included 2Lakh individuals aged 60 and above who had knee radiography & underwent DXA at our institution six months before and after the knee radiography. The phrase “Knee fracture” in this research is compared towards a femoral neck or trochanteric perforation. The accompanying photos were not included: 50 photographs of osteoarthritis involving femoral head distortion, 32 confusing or harmful images, 7 images of artificial items composed of metal, 2 portraits of femoral bone deformity following previous fractures, & 1 shot of pathological fracture. As a result, 1131 hips (708 broken & 423 non-fractured) were left to be examined further.
2.3 Data Pre-processing
The pictures were captured from the simple knee radiography of every patient. The Kagawa Prefectural Central Hospital PACS method gives all photographs in TIFF format (size: 256 256 pixels). We used separation of the knee joint region to create the photos. Underneath the guidance of an orthopaedic specialist, six orthopaedists placed directly and cropped points of focus on the X-ray pictures utilizing Photoshop Effects. It was decided to decrease the hip side evaluated with DXA in the picture cropping method pre-analysis. For the smaller glenoid lines, tiny trochanter lines and inferior border of femoral head were chosen and clipped as indicated in Figure 1 as the ranges cut during the DXA evaluation. An osteoporosis diagnosis was made using a DXA scan, and the cropped image matched that. PNG format was used to store the cropped photos. The patient’s BMD status was not disclosed to any of the orthopaedic doctors who executed the cropping.
2.4 Diagnosis of Osteoporosis
BMD measures (g/cm) were taken at the hip by trained persons utilizing identical measuring protocols using DXA (HOLOGIC Horizon-A, Apex software version 13.6.0.4, Bedford, MA, USA). The usual orientation was employed, as well as the scanning picture met the minimum specifications [30]: the knee joint was centred in the image, with 17 to 26 degrees of internal rotation, as well as the femur neck, head, & superior trochanter were fully visible. Usually, the reading was performing at the left knee. When a metal implant was placed in the left hip, or was severely deformed, the right knee was selected. The BMD (g/cm) & T-score, both calculated autonomously, were among the characteristics studied. Applying World Health Organization diagnostic standards, If the DXA T-score for bone density is less than 2.5, osteoporosis is present.
3 Related Models
In this section various related and existed model’s discussion is performed with available research papers in recent years.
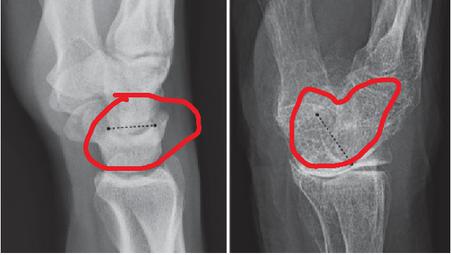
Figure 1 FCNN based classification.
3.1 FCNN
Large-Scale Computer Vision using Very Fully Convolutional Neural Networks FCNN. The FCNN is one of the most often used pre-trained image categorization models. It was presented in various bone thermal image classifications and is still the model to beat today. FCNNs are used for image recognition and classification due to their high precision. The FCNN model is best deep learning mechanism to access the medical image analysis. In this.
It employs a hierarchical model that creates a network like a funnel before producing an entire layer where all neurons are connected. The outcome is analysed, as illustrated in the graph below in Figure 1.

Figure 2 Osteoporosis disease detection.
The above FCNN model is clearly explains about osteoporosis disease detection and its labelling, in this flatten layer, dense layer and max pooling layers are taking control. The GoogleNet and U-net models are more efficient and useful for image extraction shown in Figure 2.
3.2 GoogleNet
The GoogLeNet neural network has 22 layers. If you’d like, you may use a model that has already been trained on the ImageNet or Places365 datasets. With ImageNet’s training data, the network can classify images into over a thousand different categories.
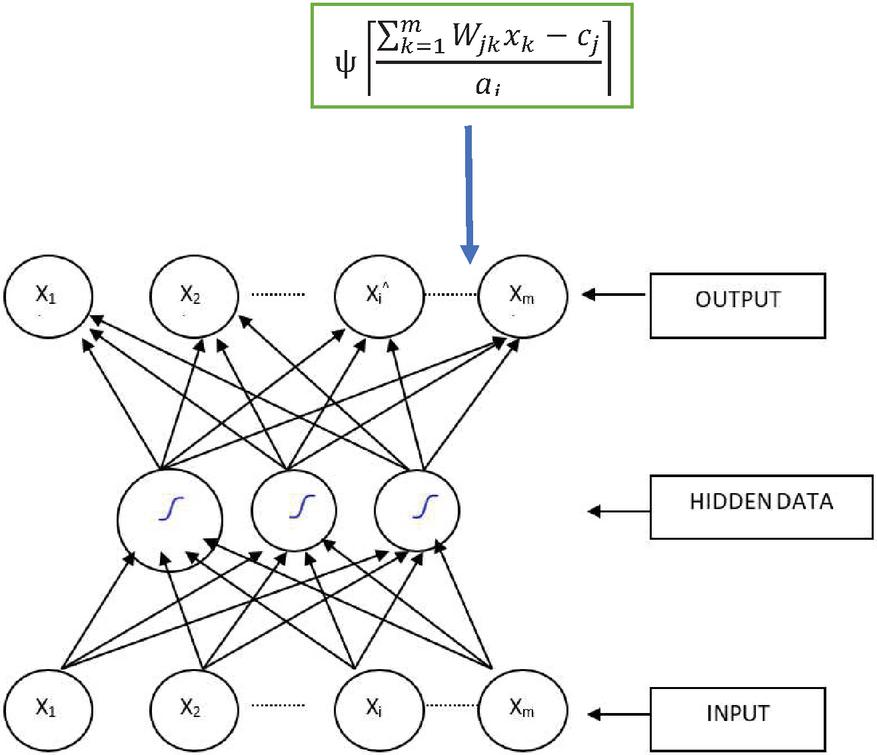
Figure 3 GoogleNet architecture.
Figure 3 clearly explains about GoogleNet architecture, in this input image information extract from .CSV file. The hidden layer can be extracting features from CNN and passed through convolutional network. Finally classifying the features and finding the disease location on thermal image.
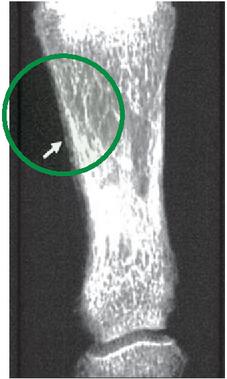
Figure 4 GoogleNet based classification.
It’s called image categorization when you categorise and label groups of pixels or vectors in an image based on specific criteria. Classification rules may be created by combining spectral and textural characteristics. Supervised categorization techniques and uncontrolled classification techniques are also available shown in Figure 4.
3.3 ResNet
This kind of deep learning model is most often used to analyse visual pictures and is called the Artificial Neural Network (CNN or ConvNet). At the same time, ResNet-50 is a pre-trained Deep Learning model for image categorization.
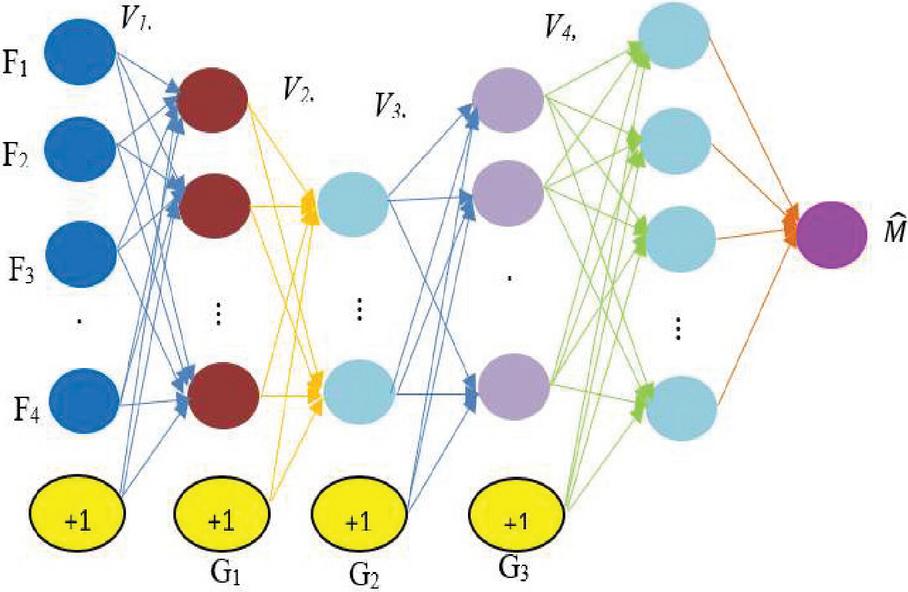
Figure 5 ResNet deep learning.
Figure 5 clearly explains about ResNet CNN modelling, in this every Fully connected layer and virtual layers are connected through neuron architecture. Using this ResNet modelling finding thermal image disease clearly. The G1, G2 and G3 are the gain multi layers, these connections are label with final node. The averaging and pooling access can be used to train the .CSV file, at last test the real time samples. The convolution and deep neural networks are most prominent in operation to providing information.
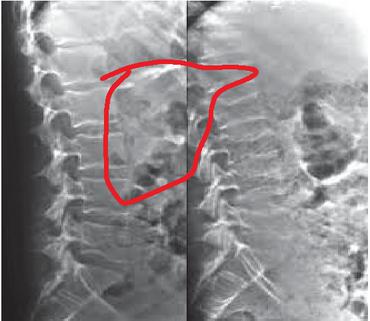
Figure 6 ResNet based classification.
For many computer vision applications, the ResNet neural network serves as the basis. ResNet is an acronym for Residual Networks. This design won the ImageNet competition in 2015 with flying colours. For us, ResNet changed the game since it enabled us to train very complex neural networks more than 150 layers efficiently Figure 6.
S-Transform
The detection of osteoporosis is a difficult job that requires the use of a variety of scanning models, including x-ray, CT scan, ultrasound, and gamma-ray scanning. As a result, sophisticated scanning technology is required to diagnose neurological osteoporosis disorder.
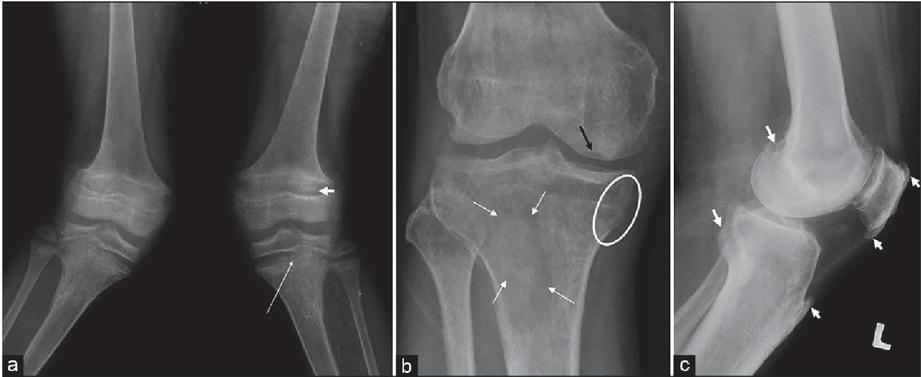
Figure 7 S-Transform based classification.
The pulsed s-transform dependent 11-bit barker codes thermal wave imaging model is developed in this study using the MATLAB 2015b programme. This model is a unique design that uses the s-transform method to get exact outcomes shown in Figure 7.
The diagnosis of osteoporosis is a difficult process that requires the use of a variety of imaging models, including x-ray, CT scan, ultra sound, and gamma ray scanning. As a result, improved scanning technology is required to diagnose osteoporosis genetic condition. The pulsed s-transform based 11-bit barker codes thermal wave imaging model is constructed in this research using the MATLAB 2015b programme. This model is a unique design that uses the s-transform approach to provide precise results. Barker codes are typically binary values with lengths ranging from 2 to 13 bits, as indicated in Table 1. The adjacent pulse of correlation tens to zero in these frames because they have unique auto correlation algorithms. This feature comes particularly handy in radar, satellite, and practical diagnostics. The Barker coding approach is based on binary phase modulation in most cases.
Table 1 Performance analysis
| True | False | False | |||
| Positive Count | Positive Count | Negative Count | TPR | PPV | Sensitivity |
| 2147 | 4 | 3 | 99.978 | 99.832 | 99.952 |
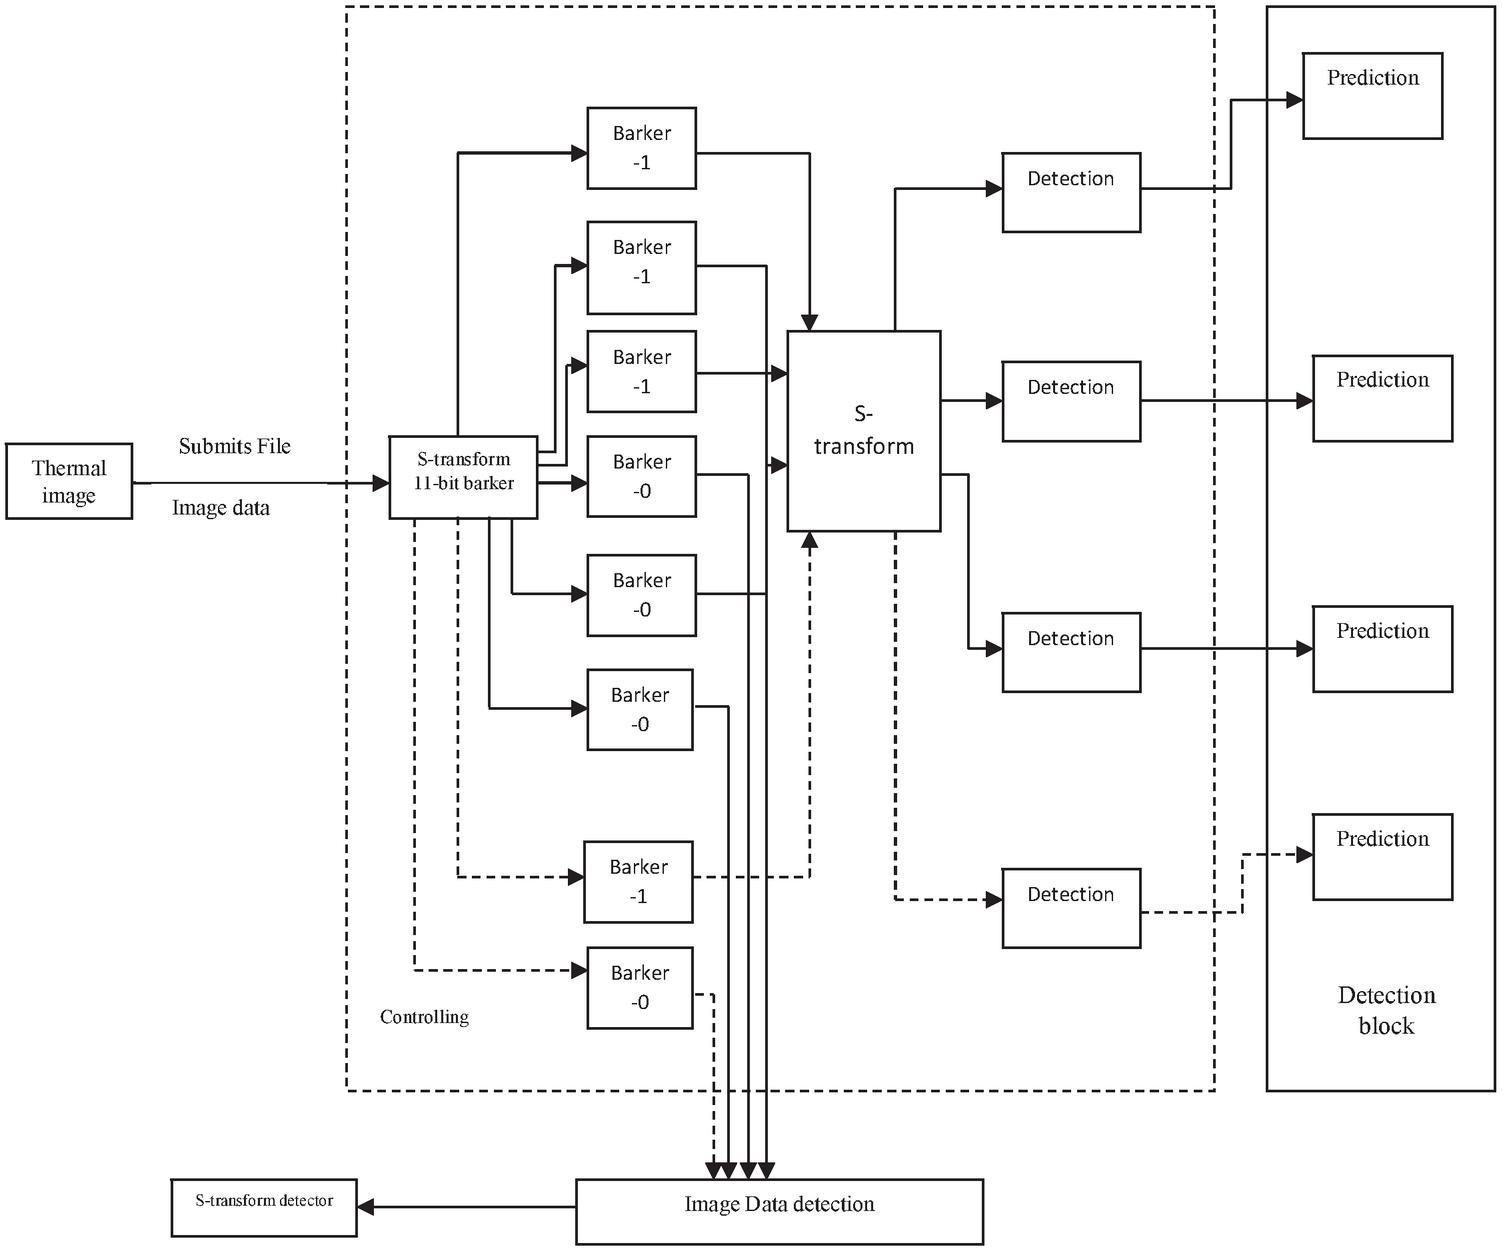
Figure 8 S-transform based thermal image detection.
Methodology
In this study, a pixel-based convolutional neural network method is used to estimate an osteoporosis bone thermal image-based diagnostic. It’s a multi-level scaling technique for recovering damaged pixels from a picture. The training process has about 2 lakh pictures, whereas the testing process contains approximately 1000 images from different hospitals. Following the training procedure, calculate the accuracy and confusion matrix using the following method, which measures presentation metrics including exactness, sensitivity, F1 score, and recall. In comparison to traditional models, the U-net based FCNN technique has improved illness detection functionality. Because of the parallel channel mechanism and U-Net technology, a higher accuracy score of 99.5 per cent and sensitivity of 98.73 per cent was achieved. The information about osteoporosis bone imaging columns and vessels may be obtained via the segmentation method. Pixel-based segmentation may aid object and backdrop variance while also improving testing accuracy.
| (1) | |
| (2) | |
| (3) | |
| (4) |
The Equation (1) clearly explains about fitness function of U-net technology, in this L is the localization function Y and are output scaling and supporting layer function respectively. h is an impulse response of U-net architecture, x is an input pixel which are attained from thermal bone image. The Equation (2) is clearly explains about layer differentiation function in this layer like flatten, dense and max pooling layers are to be getting loaded to U-net network. The Equation (3) is a sub optimization function to track layers easily. The Equation (4) is a final argument function, it is used to track all parameters in u-net.
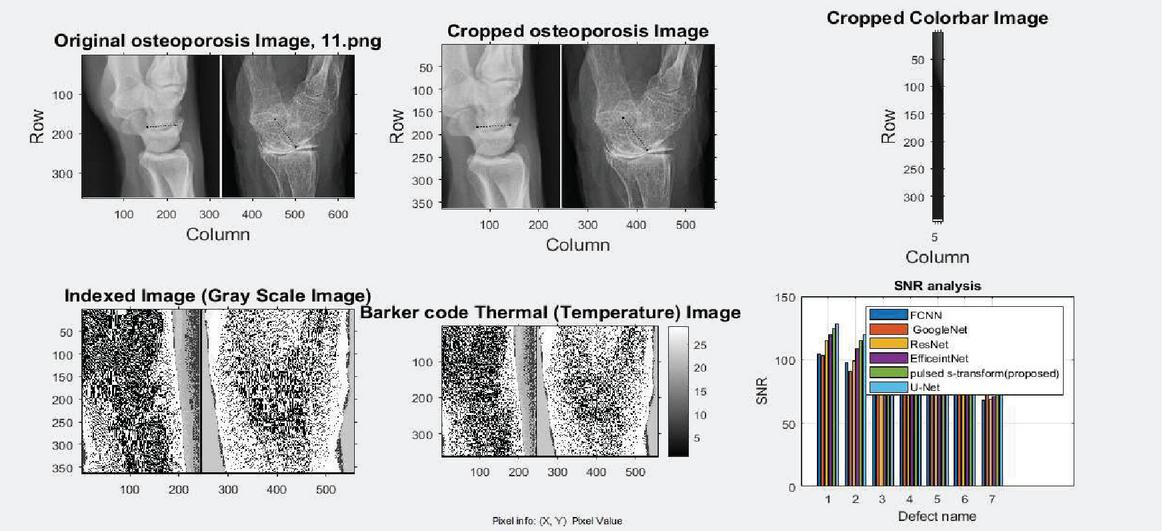
Figure 9 Disease detection.
Figure 9 demonstrates that thermal image analysis for osteoporosis disease. In this colour, cropping is applied at various thermal densities to get the disorder of the region in the selected bone.
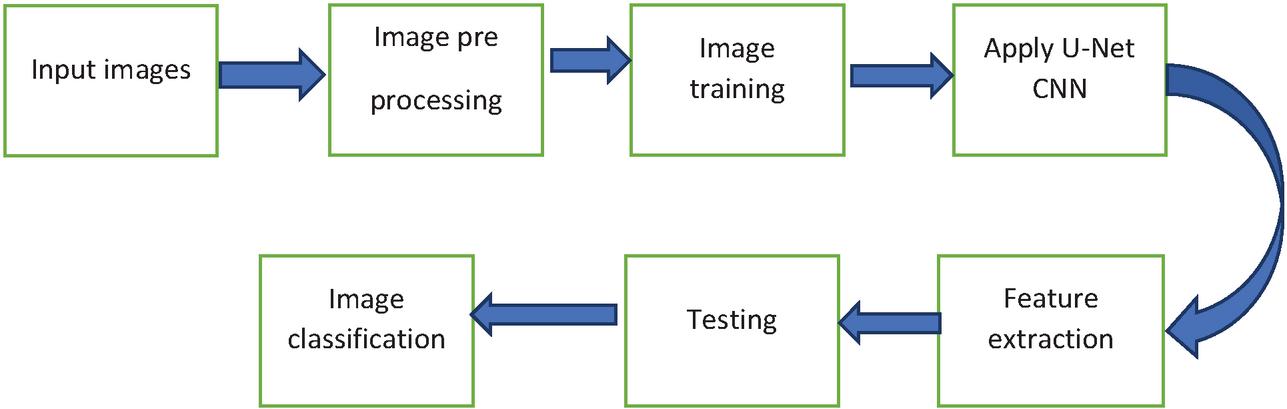
Figure 10 U-Net based osteoporosis classification.
Figure 10 is clearly explaining about U-net based osteoporosis disease detection i.e proposed methodology. At initial stage input images are imported for pre-processing like resolution adjustment, pixel intensity alteration and cropping. The training process can be performed through U-Net CNN mechanism. The features are getting extract using 5-layer architecture, in this Max pooling layer, dense layer and flatten layers are support to analyse the hidden pixels. Therefore, an exact osteoporosis disease detection has been getting highlighted through U-Net network. Finally real time patient images are classified and estimating performance measures.
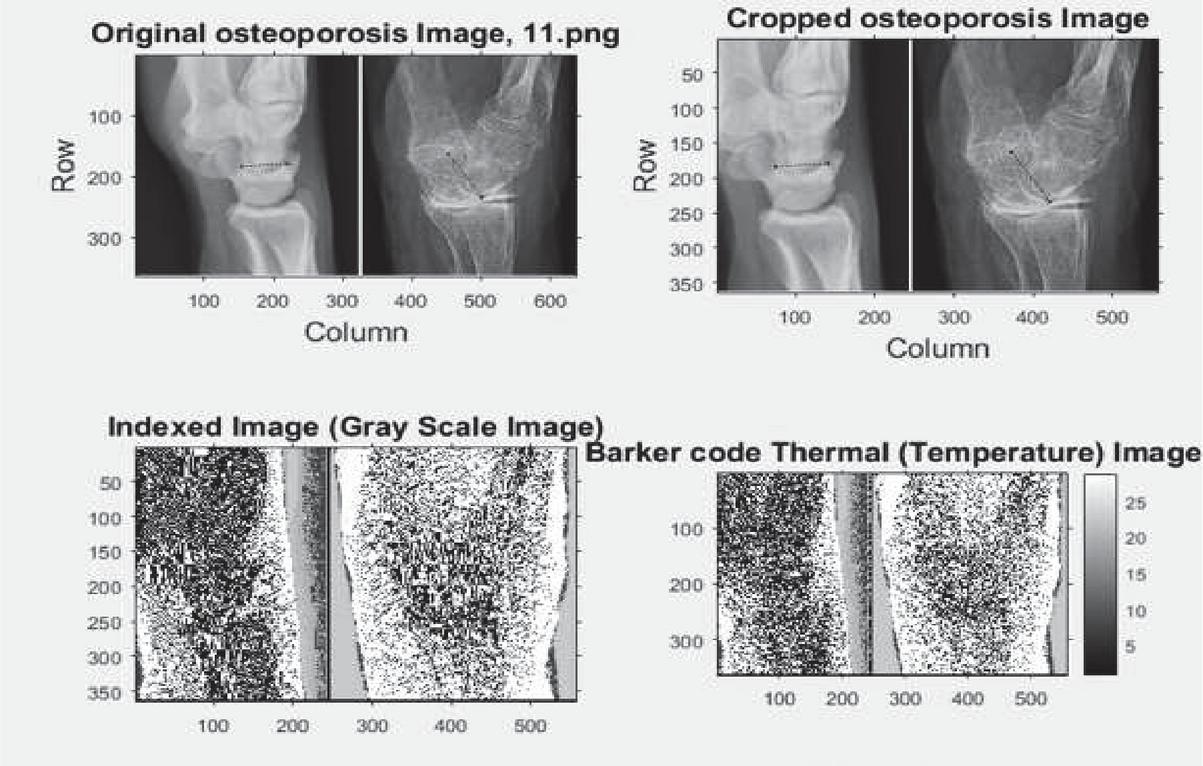
Figure 11 Osteoporosis detection.
Figure 11 clearly explains the exact location of the disease where specific heat, thermal conductivity, region density can be useful for disorder identification. The above image is most useful model to get osteoporosis disease detection, in this black colour pixels are representing osteoporosis effecting area.
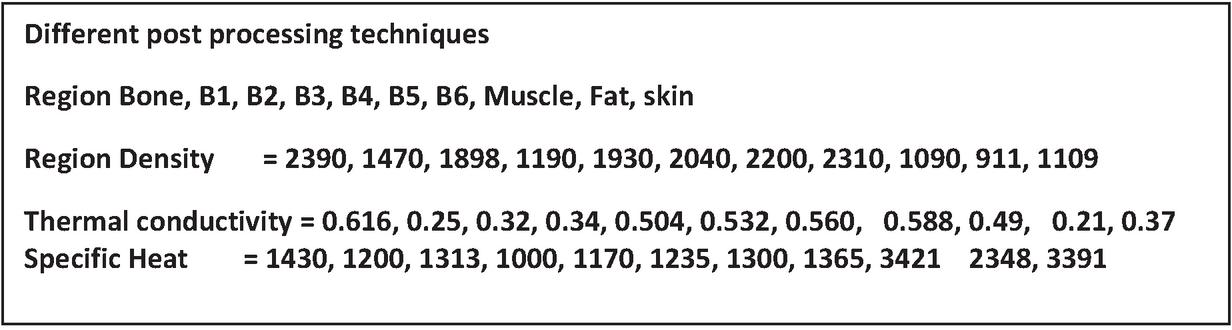
Figure 12 SNR analysis.
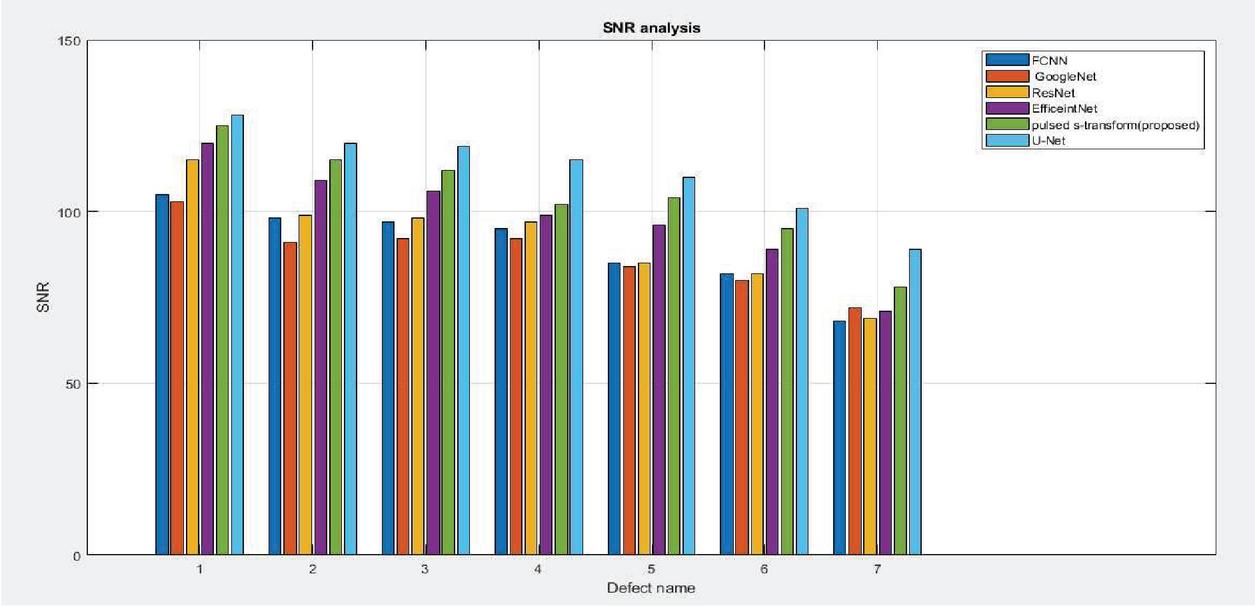
Figure 13 SNR deep analyses.
In the post processing, regions are estimating through B1, B2, B3 and etc. Various density regions and thermal conducitivity are provding Specific heat concept to get osteoporosis pixels shown in Figure 12.
Figure 13 explains about SNR vs proposed method analysis which is represented in dB. Compared to the FFT phase, pulse, PCA, CZT models proposed S-transform technique attains more improvement. In this FCNN, GoogleNet, ResNet and S -transform models are giving less accurate results but proposed u-net providing more improved results.
Table 2 and Figure 14 clearly explains many earlier models’ comparisons, in this FFT, pulse compression, PCA, and CZA methods. In this discussion proposed model attains more sensitivity and predictivity improvement. The U-net model is attaining layer information from Max pooling and hidden layer architecture. the flatten layer and ReLu layers are balancing data in thermal image through pixel variations.
Table 2 Performance measures
| Sl. No. | Method | Sensitivity (%) | Predictive Score (%) |
| 1 | FFT phase [5] | 99.54 | 99.75 |
| 2 | Pulse compression [6] | 99.94 | 99.92 |
| 3 | PCA [11] | 99.86 | 99.84 |
| 4 | CZT [3] | 99.84 | 99.89 |
| 5 | Symlet [6] | 99.67 | 99.92 |
| 6 | PST model[20] | 99.954 | 99.935 |
| 7 | Proposed model | 99.967 | 99.971 |
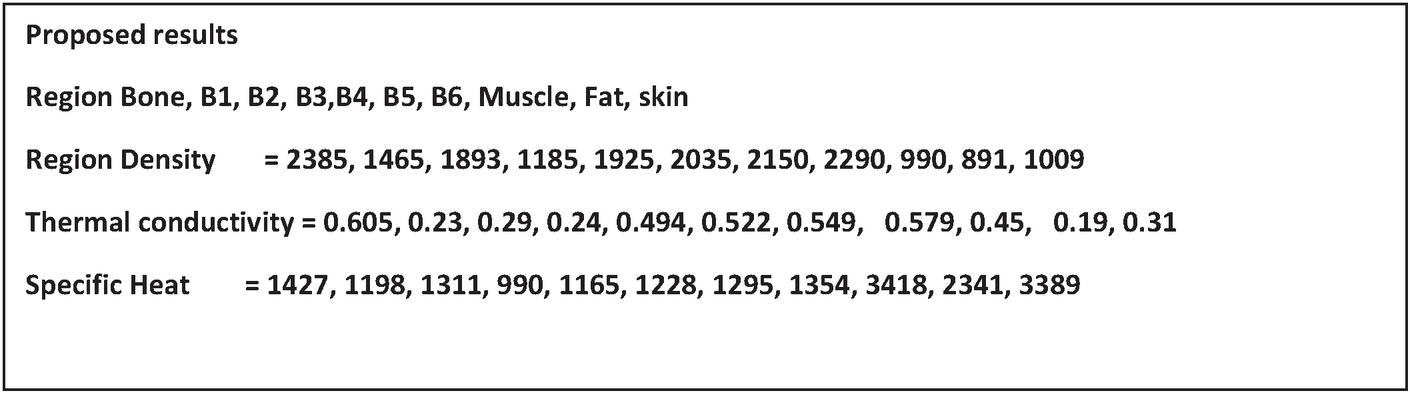
Figure 14 SNR analysis.
The performance measures are calculating for estimating application robustness, in this FFT phase, Pulse compression, PST method, CZT, Symlet and PCA mechanisms. It is identified that proposed model is more improved its operation in sensitivity and predictive score.
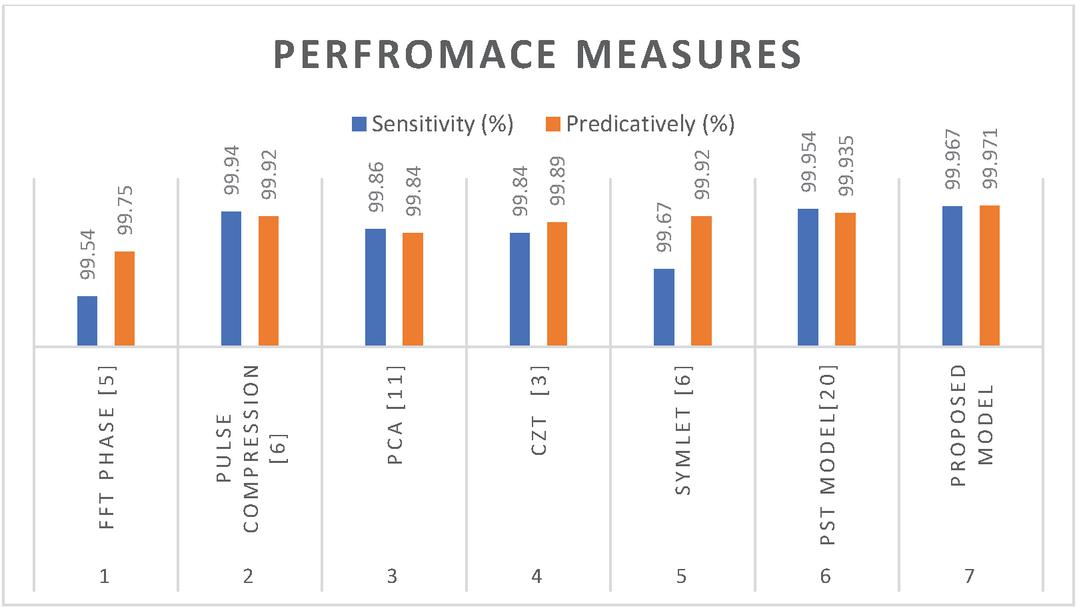
Figure 15 performance measures.
Figure 15 clearly explains about false positive rate, false-negative rate information. In this, various deep learning mechanisms are compared and identified that the proposed model is more accurate. The sensitivity, Recall, accuracy and F measures are calculated with Confusion matrix. The Tp (True Positive Rate), Tn (True negative Rate), Fp (False positive Rate), Fn (False Negative Rate) had been estimating performance measures.
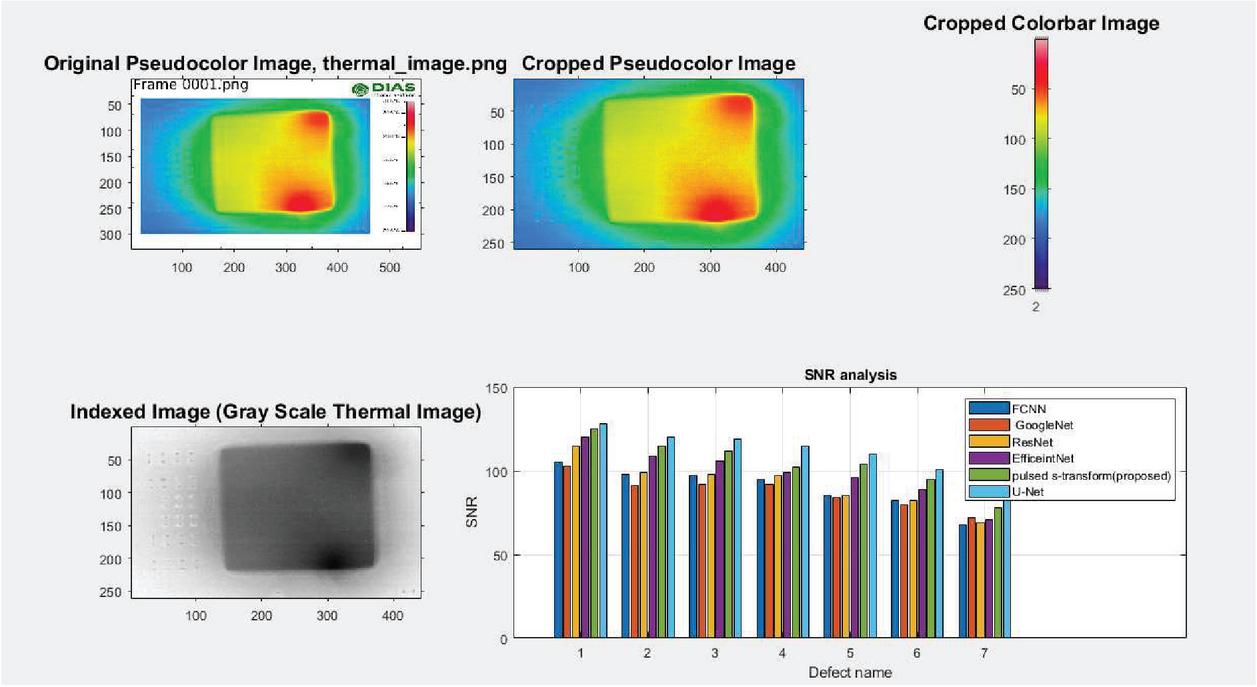
Figure 16 SNR vs defect name.
Figure 16 clearly explains the signal-to-noise ratio versus defect. The name analysis here various deep learning mechanisms like Google net, S-transform, ResNet and U-net mechanism are compared and finally conclude that proposed model is more efficient.
Performance Measures
In this section performance, measures are a discussion for estimating application accuracy. Here different convolution methods are compared and identified that the proposed model provides more accuracy, recall, precision under failed detection rate.
Recall (Sensitivity (SN): Measures the rate of correctly classified pulses among all pulse points. It is the ratio of genuinely positive samples towards the actual positive models. The value of ‘1’ specifies the best specificity value, and ‘0’ indicates the worst case.
| (5) |
Precision (Positive Predictivity (PP)): Precision computes the number of positive predicted samples which are most significant. The ratio of actual positive examples to the total number of positive models may define this metric. The value of ‘1’ specifies the best specificity value, and ‘0’ indicates the worst case.
| (6) |
Failed detection Rate (FDR): It is the ratio of the total number of false positives and false negatives to true positive samples.
| (7) |
Table 3 Comparison results
| S No | Methodology | Sensitivity | Accuracy | Recall | F measure | Throughput |
| 1 | FFT phase [5] | 97.23 | 96.34 | 95.45 | 96.34 | 97.34 |
| 2 | Pulse compression [6] | 97.97 | 95.45 | 96.67 | 97.45 | 97.34 |
| 3 | PCA [11] | 98.23 | 97.34 | 98.67 | 99.45 | 98.34 |
| 4 | CZT [3] | 98.47 | 97.25 | 98.65 | 97.45 | 93.67 |
| 5 | Symlet [6] | 96.75 | 98.45 | 97.38 | 98.45 | 97.28 |
| 6 | PST model[20] | 96.23 | 97.45 | 95.65 | 97.45 | 96.56 |
| 7 | Proposed model | 98.97 | 99.34 | 97.34 | 98.48 | 98.45 |
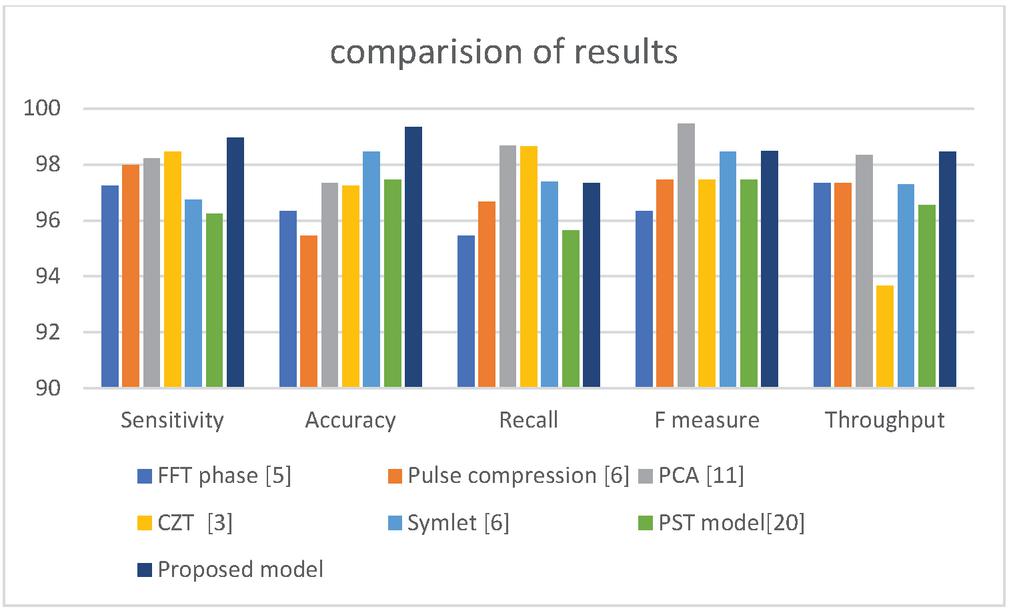
Figure 17 Comparisons of results.
The above Table 3 and Figure 17 explains about different comparison of results, in this FFT, CZT, PST and PCA models are compared. Finally, it is identified that proposed model attains more improvement compared to other models.
Conclusion
The U-net method is used in this study to discover osteoporosis bone disease. The earlier techniques like FFT phase, pulse compression, PCA and CZT, GoogleNet, ResNet and FCNN methods get less accurate disease detection. Therefore, an automatic efficient osteoporosis disease identification method is compulsory. In this work, U-net Deep learning with a classification mechanism is implemented on MATLAB 2018b software. At last, SNR is 137.8 dB, sensitivity 99.967%, prediction rate 99.971%; actual positive rate 99 has been attained, these results are outperformance the methodology and compete with advanced models. The thermal imaging-based disease classification as well as osteoporosis bone disease detection is complex with all other earlier models. So that in this work U-net based CNN is implemented for future level osteoporosis bone disease detection purpose.
Conflict of Interest
This research work contains no conflict of interest between the authors.
References
[1] Pai, M. V. (2017). Osteoporosis prevention and management. The Journal of Obstetrics and Gynecology of India, 67(4), 237–242.
[2] Liu, J., Wang, J., Ruan, W., Lin, C., and Chen, D. (2020). Diagnostic and gradation model of osteoporosis based on improved deep u-net network. Journal of medical systems, 44(1), 1–7.
[3] Singh, A., Dutta, M. K., Jennane, R., and Lespessailles, E. (2017). Classification of the trabecular bone structure of osteoporotic patients using machine vision. Computers in biology and medicine, 91, 148–158.
[4] Devikanniga, D., and Raj, R. J. S. (2018). Classification of osteoporosis by artificial neural network based on monarch butterfly optimisation algorithm. Healthcare technology letters, 5(2), 70–75.
[5] Zanker, J., and Duque, G. (2019). Osteoporosis in older persons: old and new players. Journal of the American Geriatrics Society, 67(4), 831–840.
[6] Cruz, A. S., Lins, H. C., Medeiros, R. V., José Filho, M. F., and da Silva, S. G. (2018). Artificial intelligence on the identification of risk groups for osteoporosis, a general review. Biomedical engineering online, 17(1), 1–17.
[7] Alzubaidi, M. A., and Otoom, M. (2020). A comprehensive study on feature types for osteoporosis classification in dental panoramic radiographs. Computer methods and programs in biomedicine, 188, 105301.
[8] Smets, J., Shevroja, E., Hügle, T., Leslie, W. D., and Hans, D. (2021). Machine Learning Solutions for Osteoporosis—A Review. Journal of Bone and Mineral Research.
[9] Cohen, A., Hostyk, J., Baugh, E. H., Buchovecky, C. M., Aggarwal, V. S., Recker, R. R., … and Shane, E. (2021). Whole exome sequencing reveals potentially pathogenic variants in a small subset of premenopausal women with idiopathic osteoporosis. Bone, 116253.
[10] Cortet, B., Dennison, E., Diez-Perez, A., Locquet, M., Muratore, M., Nogués, X., … and Brandi, M. L. (2021). Radiofrequency Echographic Multi Spectrometry (REMS) for the diagnosis of osteoporosis in a European multicenter clinical context. Bone, 143, 115786.
[11] Ontan, M. S., Dokuzlar, O., Bulut, E. A., Soysal, P., and Isik, A. T. (2021). The relationship between osteoporosis and sarcopenia, according to EWGSOP-2 criteria, in outpatient elderly. Journal of Bone and Mineral Metabolism, 1–9.
[12] Katz, J., and Rotstein, I. (2021). Prevalence of periapical lesions in patients with osteoporosis. Journal of Endodontics, 47(2), 234–238.
[13] Pazianas, M., and Miller, P. D. (2021). Osteoporosis and Chronic Kidney Disease–Mineral and Bone Disorder (CKD-MBD): Back to Basics. American Journal of Kidney Diseases.
[14] López López, J., Estrugo Devesa, A., Jané Salas, E., Ayuso Montero, R., and Gómez Vaquero, C. (2011). Early diagnosis of osteoporosis by means of orthopantomograms and oral x-rays: a systematic review.
[15] Areeckal, A. S., Jayasheelan, N., Kamath, J., Zawadynski, S., Kocher, M., and David S, S. (2018). Early diagnosis of osteoporosis using radiogrammetry and texture analysis from hand and wrist radiographs in Indian population. Osteoporosis International, 29(3), 665–673.
[16] Kazakia, G. J., and Majumdar, S. (2006). New imaging technologies in the diagnosis of osteoporosis. Reviews in Endocrine and Metabolic Disorders, 7(1), 67–74.
[17] Grampp, S., Jergas, M., Glüer, C. C., Lang, P., Brastow, P., and Genant, H. K. (1993). Radiologic diagnosis of osteoporosis. Current methods and perspectives. Radiologic Clinics of North America, 31(5), 1133–1145.
[18] Lu, D. Y., Che, J. Y., and Shen, Y. (2018). Osteoporosis, importance for early diagnosis and treatment. EC Orthopaedics, 9(9), 624–625.
[19] D. Thrivikrama Rao, K. S. Ramesh, V. S. Ghali (2021). An Implementation of Osteoporosis Diagnosis Using Pulsed S-Transform Thermal Wave Imaging Technique. Journal of Green Engineering, 12785–12799 Volume: 10 Issue: 12.
[20] D. Rao, K. S. Ramesh, V. Gopi Tilak, and V. S. Ghali (2020). Diagnosis of Osteoporosis using Barker Coded Thermal Wave Imaging. https://doi.org/10.31838/ijpr/2020.12.03.143.
[21] Saba, S. S., Sreelakshmi, D., Kumar, P. S., Kumar, K. S., and Saba, S. R. (2020). Logistic regression machine learning algorithm on MRI brain image for fast and accurate diagnosis. International Journal of Scientific and Technology Research, 9(3), 7076–7081.
[22] Saikumar, K., Rajesh, V. (2020). Coronary blockage of artery for Heart diagnosis with DT Artificial Intelligence Algorithm. Int J Res Pharma Sci, 11(1), 471–479.
[23] Saikumar, K., Rajesh, V. (2020). A novel implementation heart diagnosis system based on random forest machine learning technique International Journal of Pharmaceutical Research 12, pp. 3904–3916.
[24] Raju K., Chinna Rao B., Saikumar K., Lakshman Pratap N. (2022) An Optimal Hybrid Solution to Local and Global Facial Recognition Through Machine Learning. In: Kumar P., Obaid A.J., Cengiz K., Khanna A., Balas V.E. (eds) A Fusion of Artificial Intelligence and Internet of Things for Emerging Cyber Systems. Intelligent Systems Reference Library, vol. 210. Springer, Cham. https://doi.org/10.1007/978-3-030-76653-5\_11
[25] Sankara Babu B., Nalajala S., Sarada K., Muniraju Naidu V., Yamsani N., Saikumar K. (2022) Machine Learning Based Online Handwritten Telugu Letters Recognition for Different Domains. In: Kumar P., Obaid A.J., Cengiz K., Khanna A., Balas V.E. (eds) A Fusion of Artificial Intelligence and Internet of Things for Emerging Cyber Systems. Intelligent Systems Reference Library, vol. 210. Springer, Cham. https://doi.org/10.1007/978-3-030-76653-5\_12
[26] Kiran Kumar M., Kranthi Kumar S., Kalpana E., Srikanth D., Saikumar K. (2022) A Novel Implementation of Linux Based Android Platform for Client and Server. In: Kumar P., Obaid A.J., Cengiz K., Khanna A., Balas V.E. (eds) A Fusion of Artificial Intelligence and Internet of Things for Emerging Cyber Systems. Intelligent Systems Reference Library, vol. 210. Springer, Cham. https://doi.org/10.1007/978-3-030-76653-5\_8
[27] Praveen Sundar, P. V., Ranjith, D., Karthikeyan, T., Vinoth Kumar, V., and Jeyakumar, B. (2020). Low power area efficient adaptive FIR filter for hearing aids using distributed arithmetic architecture. International Journal of Speech Technology, 23(2), 287–296. doi:10.1007/s10772-020-09686-y.
[28] Dhiman, G., Vinoth Kumar, V., Kaur, A., and Sharma, A. (2021). DON: Deep Learning and Optimization-Based Framework for Detection of Novel Coronavirus Disease Using X-ray Images. Interdisciplinary Sciences: Computational Life Sciences, 13(2), 260–272. doi:10.1007/s12539-021-00418-7.
[29] Ramaiah, V. S., Singh, B., Raju, A. R., Reddy, G. N., Saikumar, K., and Ratnayake, D. (2021, March). Teaching and Learning based 5G cognitive radio application for future application. In 2021 International Conference on Computational Intelligence and Knowledge Economy (ICCIKE) (pp. 31–36). IEEE.
[30] Mohammad, M. N., Kumari, C. U., Murthy, A. S. D., Jagan, B. O. L., and Saikumar, K. (2021). Implementation of online and offline product selection system using FCNN deep learning: Product analysis. Materials Today: Proceedings, 45, 2171–2178.
Biographies

D. Thrivikrama Rao is working in Hindustan Aeronautics Limited, Bengaluru, Karnataka, India, pursuing Ph.D., Research scholar, Department of Electronics and Communication Engineering, Koneru Lakshmaiah Education Foundation, Vaddeswaram, Andhra Pradesh, India. His research area is medical thermal image processing. He has 5 Scopus publications in various image related areas.

K. S. Ramesh, Professor, Department of Electronics and Communication Engineering, Koneru Lakshmaiah Education Foundation, Vaddeswaram, Andhra Pradesh, India. His research area is wireless communication and thermal image processing. He has 61 Scopus publications in various wireless and thermal image applications.

V. S. Ghali, Professor, Department of Electronics and Communication Engineering, Koneru Lakshmaiah Education Foundation, Vaddeswaram, Andhra Pradesh, India. Ghali, Venkata Subbarao he has 71 Scopus publications and his research area is thermal image processing and thermal wave imaging.

M. Venugopala Rao, Professor, Department of Electronics and Communication Engineering, Koneru Lakshmaiah Education Foundation, Vaddeswaram, Andhra Pradesh, India. He has 56 Scopus publications and his research area is micro wave applications.
Journal of Mobile Multimedia, Vol. 18_4, 1131–1152.
doi: 10.13052/jmm1550-4646.1848
© 2022 River Publishers