Superlative Approach for Plant Disease Identification with Enhanced CSA Algorithm
M. Sowmya* and Bojan Subramani
Department of Computer Science, Shri Nehru Maha Vidhyala College of Arts and Sciences, Coimbatore, Tamil Nadu, India
E-mail: phdsowmya89@gmail.com; drbsubramani@gmail.com
*Corresponding Author
Received 02 December 2021; Accepted 20 January 2022; Publication 17 March 2022
Abstract
Disease detection in plant leaf helps farmers to protect the plant from diseases at its early stage. The most important problems are determining and anticipating plant diseases, which may be addressed for increasing output. In this research, Rider Cuckoo Search algorithm is improved with K nearest neighbour algorithm is used to classify the diseased leaf. Initially the Gaussian filtering is used in pre-processing to remove the noises in image. Following getting pre-processed image, it is exposed to segmentation step, which uses piecewise fuzzy C-means (piFCM) clustering to acquire the segments. Segmentation involves the feature extraction process which has information gain, histogram of oriented gradients (HOG), and entropy. Finally plant Disease is classified using the KNN algorithm. This proposed algorithm is implemented with the images of the plant village dataset. The proposed research work is evaluated using certain parameters like accuracy of the disease detection, Error of the algorithm, Speed of the algorithm, and time for classifying the disease. The Proposed algorithm outperformed with the values of 99.32% accuracy, 0.68% error, 2400 obs/sec speed, and time taken is 0.57743 sec respectively when compared with the existing algorithms like Hybrid SIFT algorithm, Hybrid K-means Fuzzy logic SVM algorithm, and Cuckoo Search Algorithm.
Keywords: Disease detection, Cuckoo search algorithm, K nearest neighbour algorithm, classification.
1 Introduction
COVID-19 epidemic sharply decreases the country’s agriculture production in both quality and quantity, which affects the country economy. More than a third of the GDP in India is derived from agricultural production. Plant disease detection has a huge impact on agriculture, particularly crop production [1, 2]. Plant maintenance is always necessary. It does not need effort but immediate plant effects have an impact on the revenue. The current technique of detecting plant disease is a combination of physical inspection by experts and simple naked eye observations. It takes a large team of professionals and an ever-present group of experts to make this happen [3, 4]. It is particularly difficult to keep a plant healthy when it is large-scale, as it is quite expensive. It is the case that in certain nations, farmers don’t have enough facilities or an awareness of professional interaction [5].
The study of plant diseases is a crucial concern in agriculture if they are not detected in time, their influence on crop output and quality would be unfavourable. Plant diseases play key roles in decision-making management process because early identification and warning are foundation for successful prevention and control [6]. The methods of plant disease detection that are used across the world rely mostly on the professional observations and on-the-job expertise. This technique has several downsides, such as the fact that farmers will have to do a lot of manual data collection and would incur significant expenses from having to deal with frequent consultations from experts. As a result, it is highly beneficial for farmers to be able to identify any illnesses their plants may be suffering from on their leaves and grow accordingly [7].
A disease, most likely of fungal, bacterial or viral origin, might occur in a soybean crop even if the proper conditions were present. Depending on the illness, the climate, when the infection is contracted it results with potential yield loss. It is vital to remain informed about current changes in disease, both at the farm level and among nearby farms, to better manage production potential [8]. Generally, diseases are kept under check through crop rotation and the adoption of disease-resistant soybean cultivars. Laboratory techniques and imaging techniques can be used to identify plant disease [9].
Plant-pathogen monitoring systems have recently been created to address the increasing demand for reliable grain production data. Despite the fact that the available techniques are robust, precise, accurate, rapid, and efficient, there is still a requirement for advanced disease detection techniques that are dependable, accurate, reliable, rapid, and highly efficient for the pathogen in the plant at the early stages for business, production, and agricultural gains [10].
2 Literature Review
R. Cristin et al. implement piFCM for segmentation of the input image. Every segment goes through a feature extraction process that extracts texture features employing information gain, HOG, entropy [11]. The suggested Rider-CSA-based DBN uses Plant village dataset to accomplish the classification process, which is substantiated by metrics like as sensitivity, accuracy, and specificity. The suggested Rider-CSA outperforms other current approaches with respect to accuracy, sensitivity, specificity, with a maximum accuracy 87.7%, sensitivity 86.2%, specificity 87.7%, correspondingly.
Zhang et al. studied CSA and SVM algorithms supported the detection method of plant leaves. The Experimental results shows technique used in that this paper shorten the recognition time and training, and it also improves the recognition rate, so that this proposed method is reliable [12].
M.P. Vaishanave et al. elaborate on the groundnut leaf diseases like Early leaf spot, Late leaf spot, Rust, early, late spot Bud Necrosis [13]. This paper involves 45 denoised images using K-Nearest Neighbour classifier and its characteristics are to be used for pattern matching. Future work can be carried out to reduce the false classification rate by implementing many classifiers for extracting features in various groundnut leaf diseases.
Trishen Munisami implements the K Nearest Neighbour algorithm to classify the leaf images in two phases. This proposed method uses a 20 different leaf images with a high resolution camera. The images are compared with one another and thus the proposed method provides 83.5% accuracy [14].
Hanuman Verma et al. discusses the segmentation process of piFCM using the MRI brain images. This process calculates the qualitative information to handle the uncertainity in distinguishing the images fragments. piFCM algorithm is the hybrid model which provides the benefits of PCM, FCM, A-IFS theory. Suggested segmentation method provides more prominent findings in the segmentation process than present PCM, PFCM and PTFEC systems [15].
3 Methodology
3.1 Pre-processing
Pre-processing improves image which eliminates the undesirable misrepresentation and improves the features of the image data which are relevant for processing and scrutiny of tasks. In this research, Gaussian filtering is used for pre-processing. Gaussian filtering is employed to blur image and take away noise with detail as represented in Equation (1).
| (1) |
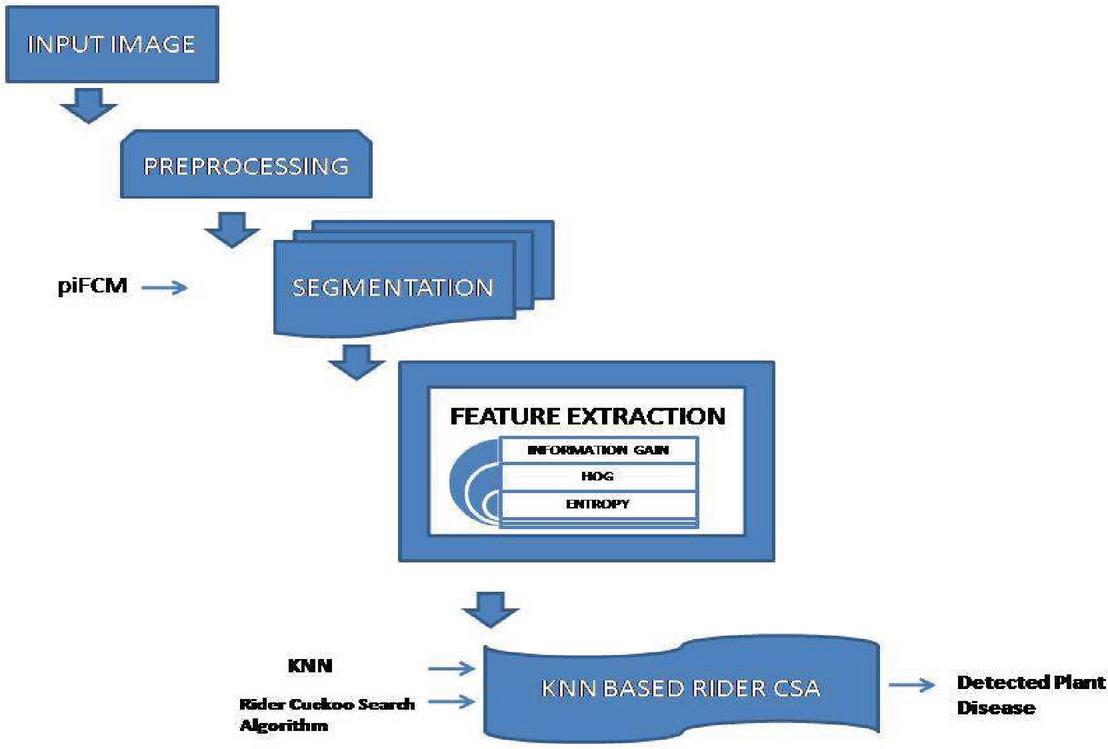
Figure 1 Construction of suggested k-NN based Rider CSA for plant disease recognition.
It is the sum of two similar Gaussians, one for each direction, in two dimensions as represented in Equation (2):
| (2) |
wherein x is the distance from the center on the horizontal axis, y is the distance from the center on the vertical axis, and is the standard deviation of the Gaussian distribution.
3.2 Segmentation Based on piFCM for Classification
This module describes procedure of segmentation for fragmenting images into various segments. The goal of segmentation is to reduce the image attributes into a more intelligible and easier-to-measure piece. piFCM is the segmentation method used in this research, this method is particularly customized for initiating the segments from actual image D. In this research piFCM method desires to supply segmented image which supports specific image features, that are effectively utilized in real-time applications. The fuzzy classification approach allows for accurate information to be sent, resulting in data substructure. It also improves the viability of the algorithm’s centroid-based cluster, and displays clustering internally across spectral representations and external data. Depending on the repeating process, the piFCM offers improved worldwide concurrence. Furthermore, the piFCM approach stretches the hands to improve performance and provide long-term benefit. Image characteristics and pixel intensity together results to get segments of image. piFCM uses degrees of membership for segmenting the image for removing the variations. Segmentation phase in piFCM results D into lesser parts via piFCM method by indulging multi-membership data. Assume H {h,…,h be the dataset which are acquired from fragmented portions’ set, it is indicated as in Equations (3) and (4).
| (3) |
with
| (4) |
here h relates to D, furthermore the degrees of membership of D to segmented portions. The fuzzy clustering of H variable was then implemented using piFCM. Assume s {S1,…Sp} for the Equation (5).
| (5) |
Setting weights as and derive t from Equation (6),
| (6) |
The distance from the to is given by Equations (7)–(9)
| (7) | ||
| (8) | ||
| (9) |
The derived equation is then written as in Equation (10),
| (10) |
The mapping functions L and K are defined in the preceding equation. As a consequence of the piFCM procedure, the generated segments are mentioned, and these segments are expressed as in Equation (11),
| (11) |
Db is used to determine the segments created by the piFCM, which are then modified for feature extraction. from the above equation indicates th segment of bth image, complete segments generated denoted as ‘g’ from bth image.
4 Feature Extraction
Feature extraction is a process which is helpful in dimensionality reduction. The segmented images are sent into the feature extraction procedure, and the features are retrieved from them to determine the importance of the input image’s features. The accuracy of classification process is mostly determined by feature extraction. Information gain, Entropy, HOG are all used in feature extraction in plant leaf identification.
(i) Entropy
Entropy is an important element that may be used to assess the information of images and to discriminate between information and noise [16]. It is written as in Equation (12)
| (12) |
Where P is proportion of number of pixels to the ith gray values and N as the total number of gray level images. P is given by Equation (13)
| (13) |
here P = {P, P,…, P}.
(ii) Information Gain
The word “information gain” refers to a metric for assessing the amount of data acquired by looking at the attribute value, that is based on entropy [17] as in Equation (14).
| (14) |
Where N(S) defines the entropy of observed segment and N(S) is subset b’s entropy determined by dividing S depending on features.
(iii) HOG
The HOG is a sort of feature descriptor that has been utilised to detect objects in images in image processing. In this method, gradients are employed to localize the image. The HOG features are retrieved using the magnitude and orientation provided by X(u,v) and Y(u,v). The computation is based on the orientation as in Equation (15),
| (15) |
x directional gradients are represented by du(u,v), and y directional gradients are represented by dv(u,v). As previously stated, the orientation is calculated using the Sobel filter as in Equation (16),
| (16) |
Thus HOG is formulated as in Equation (17) [18],
| (17) |
5 Feature Vector Computation
The th segment’s features, such as information gain, entropy, HOG features, are related to indicate th segment’s features. th segment’s feature vector is written as in Equation (18),
| (18) |
6 Classification Using Proposed KNN – Rider CSA Classifier
KNN is used for classification; the result is the class with max frequency from K-most similar examples. In a nutshell, each instance votes for the class, with the class with more votes being selected as prediction. To determine class probabilities, the normalised frequency of samples belonging to every class in a collection of K most comparable examples for a new data instance can be employed. As it makes no assumptions about the shape or structure of classification model, the kNN classification technique is described as a nonparametric technique. Furthermore, because it is a database method, kNN is extremely reliable.
1. Neighborhood Parameter k: Because this parameter has a direct impact on categorization, choosing an appropriate kNN value is a challenging problem. The influence of noisy examples can be reduced with a high value of k, but the rate of misclassification may increase. Since and , the ideal choice of k is determined by instance size n. This relationship, however, does not solve the problem of deciding on k.
2. Distance Measure: The distance function is important in kNN since it is utilized to discover query instances’ k nearest neighbours. Many research have shown that the distance measure has a significant influence on the effectiveness of kNN [19]. Whenever prior information is absent, the most commonly utilised distance measure for kNN is Euclidean distance. The distance among base instance x and query instance q is calculated using Equation (19),
| (19) | ||
| (20) |
As can be seen from the previous Equation (20), Euclidean distance considers all features equally, causing irrelevant features and noises to degrade the efficiency of kNN. To overcome this problem, many techniques have been devised [20]. It’s done in a variety of ways, including feature selection and feature weighting. Feature weighting, in reality, generalises feature selection and has a lot of promise for increasing kNN performance. Equation (21) may be used to write a broad method of weighting the features in Euclidean distance,
| (21) |
where is feature f’s weight. discrete version is described as feature selection. Identifying appropriate weights for kNN ends out to be an optimization problem. The planned KNN-Rider-CSA seeks to determine the best feature and class weights for kNN. A database having F features for a C-class classification problem might be represented as a chromosome x as a vector with length (F C). The characteristics are linked to the weight W, with a gene indicating weight for feature . second element, , deals with classes, with a weight indicating voting weight for class . As a result, a chromosome may be expressed by a mathematical Equation (22)
| (22) |
where
Procedure of k-Nearest Neighbors Process
1. Begin
2. Convert an RGB image to an HSV image.
3. Determine K.
4. Distance type (V) and training data
5. Determine distance among input and training samples.
6. Determine K nearest neighbors(v) of training data.
7. For training data, set the maximum label class to K.
8. If the data hasn’t been classified, provide training for the input image.
9. If the data has been classified, use the kNN classifier.
10. Identify disease’s name.
11. End
K Nearest Neighbour based RIDER CS Algorithm The network is repeatedly accustomed to the data until the ideal weights are determined. Rider-CSA is also used to compute the best weights, that are then assessed through the use of an error function. By combining ROA and CSA, the suggested Rider-CSA is created. The principle of ROA is centred on a group of riders racing to a specific location [21, 22]. Moreover, ROA makes use of fictional computing, which is a technique for solving optimization problems based on fictitious ideas and concepts. This approach can improve convergence and prevent convergence to a local optimum with improved performance. The CS method relies on the cuckoo breed behaviour [23, 24]. As a result, adding ROA into CSA produces a superior solution with greater performance while also controlling the pace of convergence. In Rider-CSA, the path of evolutionary search is guided by fitness value. Use the leave-one-out approach to assess the effectiveness of weight setting for kNN. Essentially, one instance from training set is selected randomly every time. This instance is being utilized to validate a simulated enquiry instance. This procedure is iterated n times, with the average performance determining fitness. The Rider-CSA for WkNN assesses every chromosome by repeating the leave-one-out classification process n times. Furthermore, it updates the fitness values of individuals within a population every generation by repeating the leave-one-out classification n times and averaging the results. Equation (23) is used to determine the recommended fitness rating of individual ,
| (23) |
here g indicates total generations for which lives, is fitness value in th survived generation.
Determination of new weights using proposed Rider-CSA The weight update is done in accordance with ROA’s update protocol, which is founded on the group of riders. As a result, the new weights determined using the ROA method are based on bypass, follower, attacker, and overtaker, with the equations for each presented below. The bypass riders adhere to a similar path and don’t follow the lead rider.
To reach the destination faster, the follower prefers to modify the weights dependent on the location of the leading rider.
By calculating the location of the overtaker, the update based on the overtaker is employed in the weight update process to improve the success rate.
The attacker tries to take the position of leaders by continuing the leader’s update process, but instead of updating the selected values, the attacker updates the values in the coordinates, hence the attacker’s update procedure is presented.
The weight update is based on levy flight movement, and the weight update calculated with the CSA method is stated as in Equation (24)
| (24) |
where indicates current iteration weight, indicates step size, indicates entry wise multiplication operator, indicates levy flight with K dimension.
Let leading position of ROA is done utilizing hence, Equation (25) is as follows:
| (25) |
The final Equation (26) is derived for the proposed Rider-CSA after replacing the aforesaid equation in Equation (24).
| (26) |
Based on the fitness function, a feasible solution is determined.
The solutions are classified depending on their fitness values, with the best option providing the lowest fitness values.
The iteration is performed till the maximum number of iterations is reached, at which point the global optimal solution is generated.
The pseudocode of the suggested K algorithm is represented by the algorithm. Plant disease identification using Nearest Neighbour-Based Rider-Cuckoo Search Algorithm.
[1] #1 [1] #1 Proposed K Nearest Neighbour-Based Rider-Cuckoo Search Algorithm for plant disease detection [1] Suggested KNN-Based Rider-CSA
Image Dataset D
plant disease detected images
Begin
input images from D database
Pre-processing
Segmentation depending on piFCM
Feature extraction
Classification through suggested KNN classifier
{
set weights
calculate error
identifying new weights of KNN depending on RCSA
iterate till maximum iteration attains
Return the feasible solution depending on fitness function
}
End
Disease detection in plants undergoes a classification process therefore a new proposed classification algorithm is used. This algorithm incorporates the Rider Cuckoo Search Algorithm with K-Nearest Neighbour algorithm which enhances the overall performance.
6.1 Dataset Description
The Experimental results are taken from the analysis of plant images from plant village Dataset and also from Kaggle Dataset which is implemented in MATLAB 2019 version. The MATLAB software is ideal for digital image processing. In this proposed work six major diseases were taken into account, based on that data for the major six plant diseases like common rust, Late blight, Cedar apple rust, Leaf curl, Leaf spot, Early blight were analysed. For plant disease detection, only a few example plant images are used as input. Figure 1 shows example for six major diseases. PlantVillage-Dataset (Plant village dataset 2018) and new plant diseases dataset (https://www.researchgate.net/deref/ https\%3A\%2F\%2Fwww.kaggle.com\%2Fvipoooool\%2Fnew-plant-diseases-dataset\%2F) are used to conduct the experiment in real time. For plant disease detection, only a few example plant photos are used as input. Two plant images are provided as input in this scenario, as well as the disease must be identified. There are many versions of the data in the raw directory that are included in the dataset. The data includes original RGB images, grayscaled copies of raw images, and segmented RGB images with only the leaf segmented and colour corrected. The data set is offline augmented to generate a new plant diseases database. The original data is available on github. About 87 K rgb images of healthy and ill crop leaves are split into 38 types in this collection. Whereas the directory structure is kept, the entire data set is divided into an 80/20 training and validation set. Following that, a new directory containing 33 test images is created for the purpose of prediction.
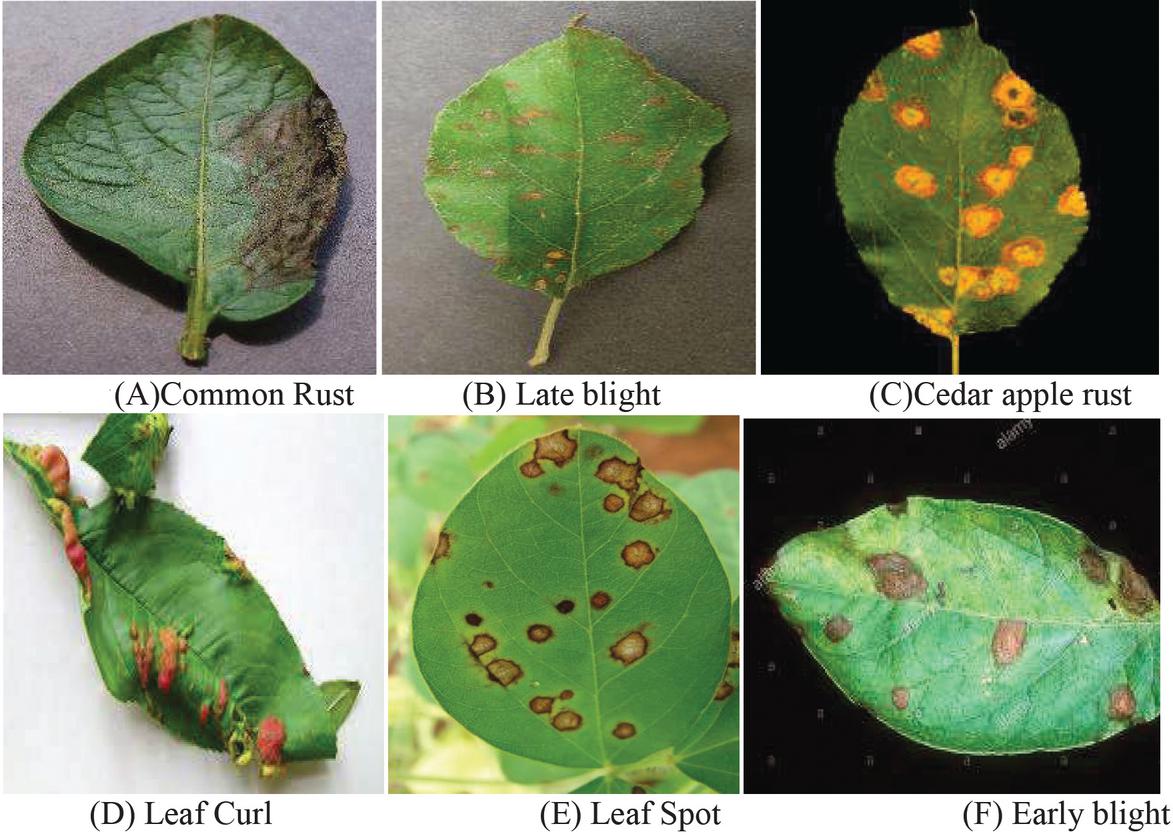
Figure 2 Major six plant diseases like common rust, Late blight, Cedar apple rust, Leaf curl, Leaf spot, Early blight.
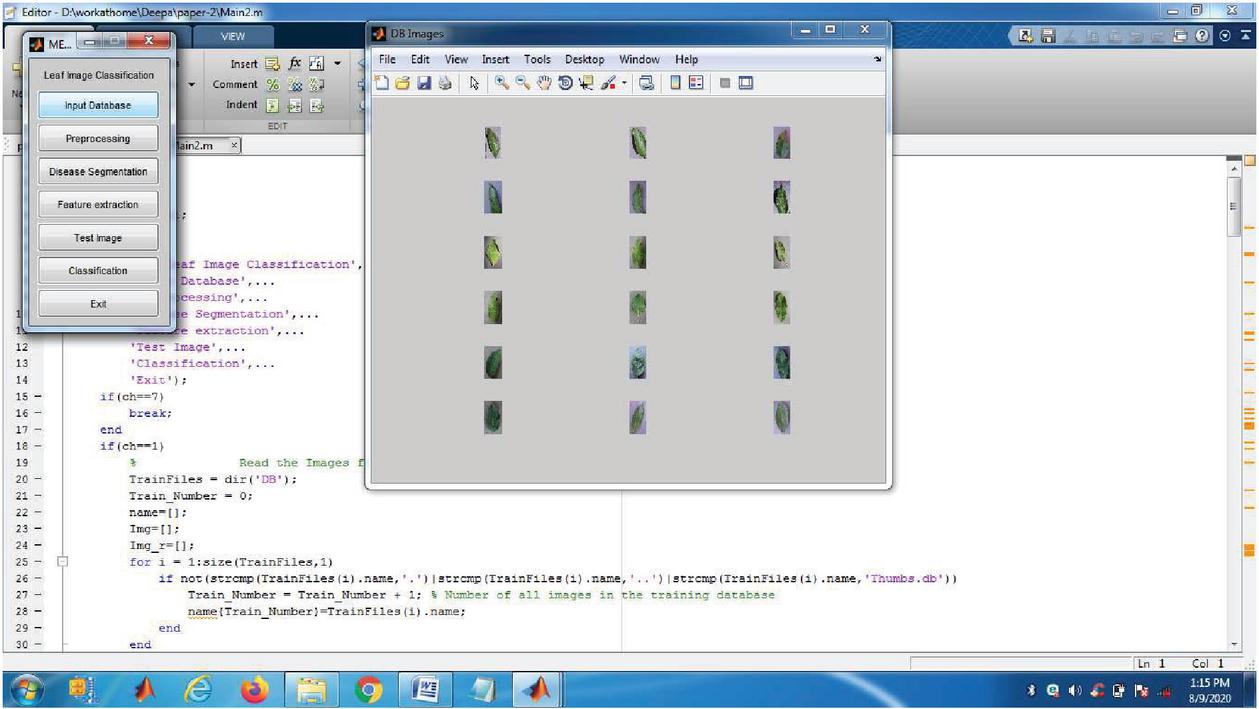
Figure 3 Input database.
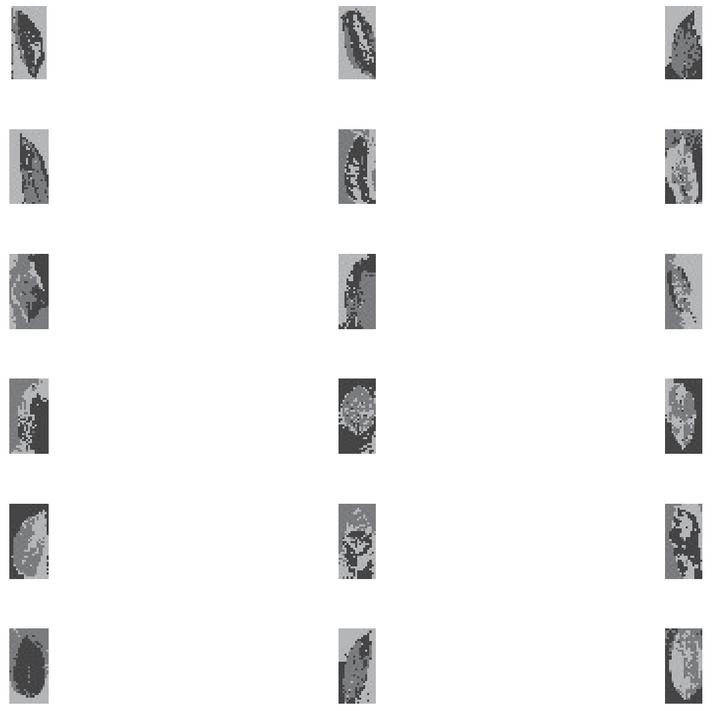
Figure 4 Segmentation result.
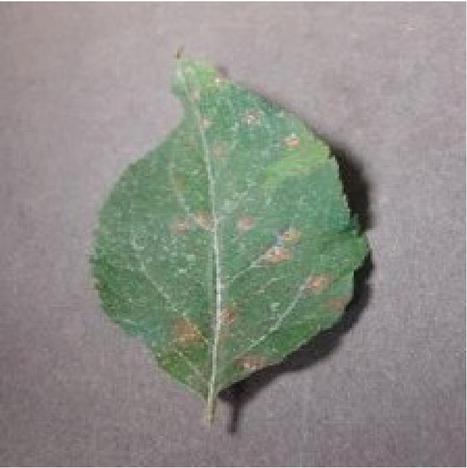
Figure 5 Query image.
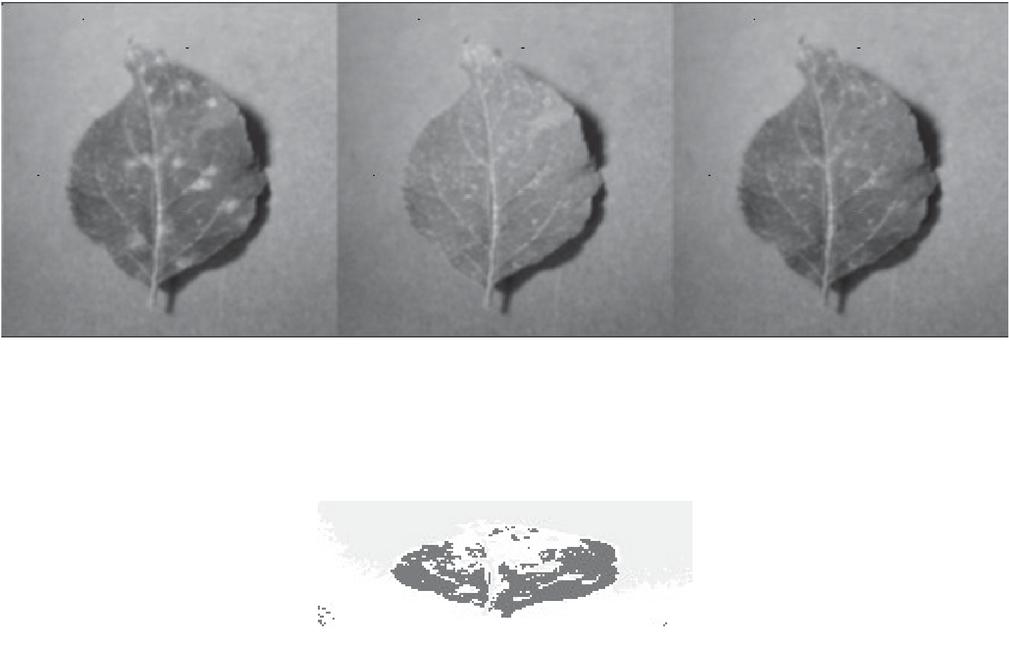
Figure 6 Feature extraction image.
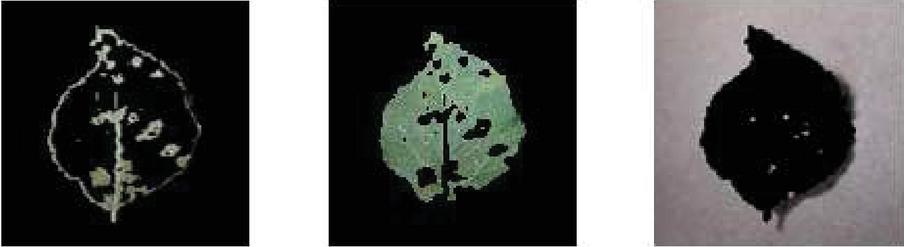
Figure 7 Classification result.
The step by step process of the overall implanted results are provided in the Figures 2 to 7.
7 Result with Discussion
The suggested Enhanced CSA algorithms’ findings are reported, and the algorithm’s efficiency is demonstrated by an examination of accuracy, error, speed, time taken. The results are compared with the Hybrid SIFT algorithm, Hybrid K-means Fuzzy logic SVM algorithm, and Cuckoo Search Algorithm. Based on the analysis done with these algorithms the proposed Enhanced Cuckoo Search Algorithm outperformed all the parameters. Figure 8 shows the accuracy in detecting the classification with hybrid SIFT algorithm is 94.63%, hybrid K-means fuzzy logic SVM is 98.12%, Cuckoo search algorithm is 94.18%, and the proposed Enhanced Cuckoo search gives the accuracy is 99.32%.
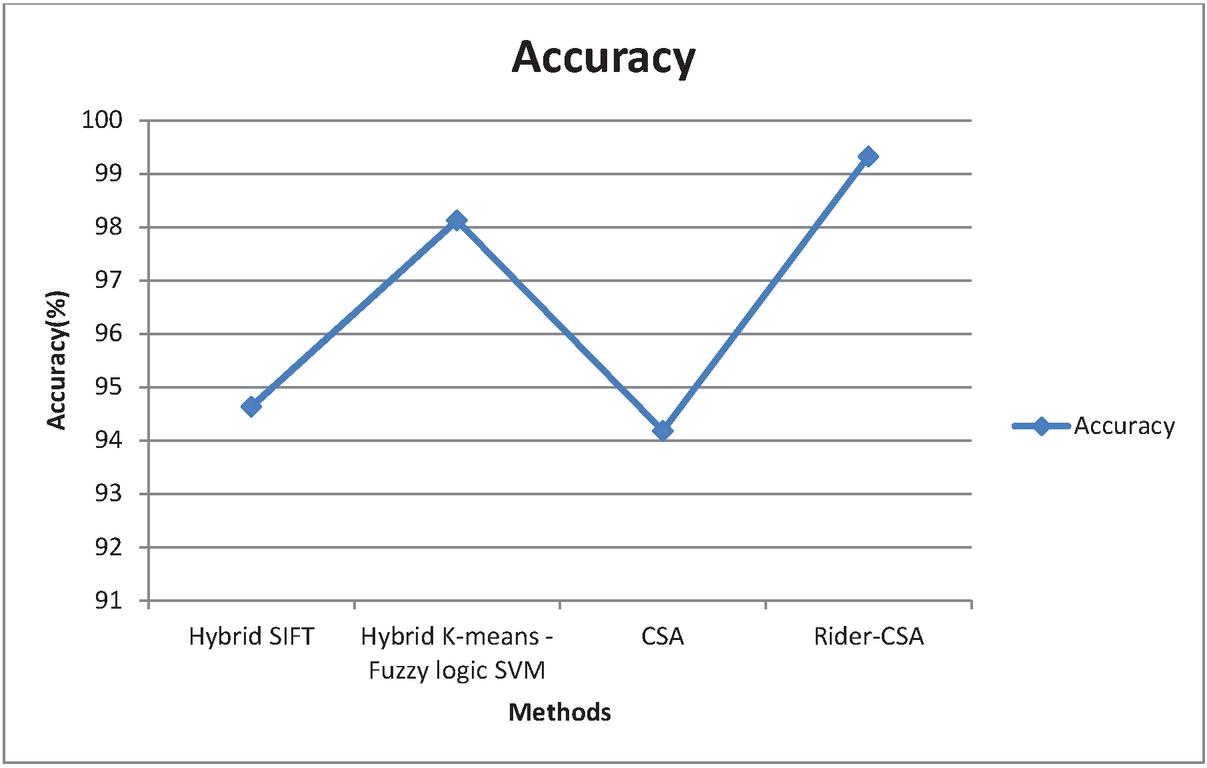
Figure 8 Graphical representation for Accuracy.
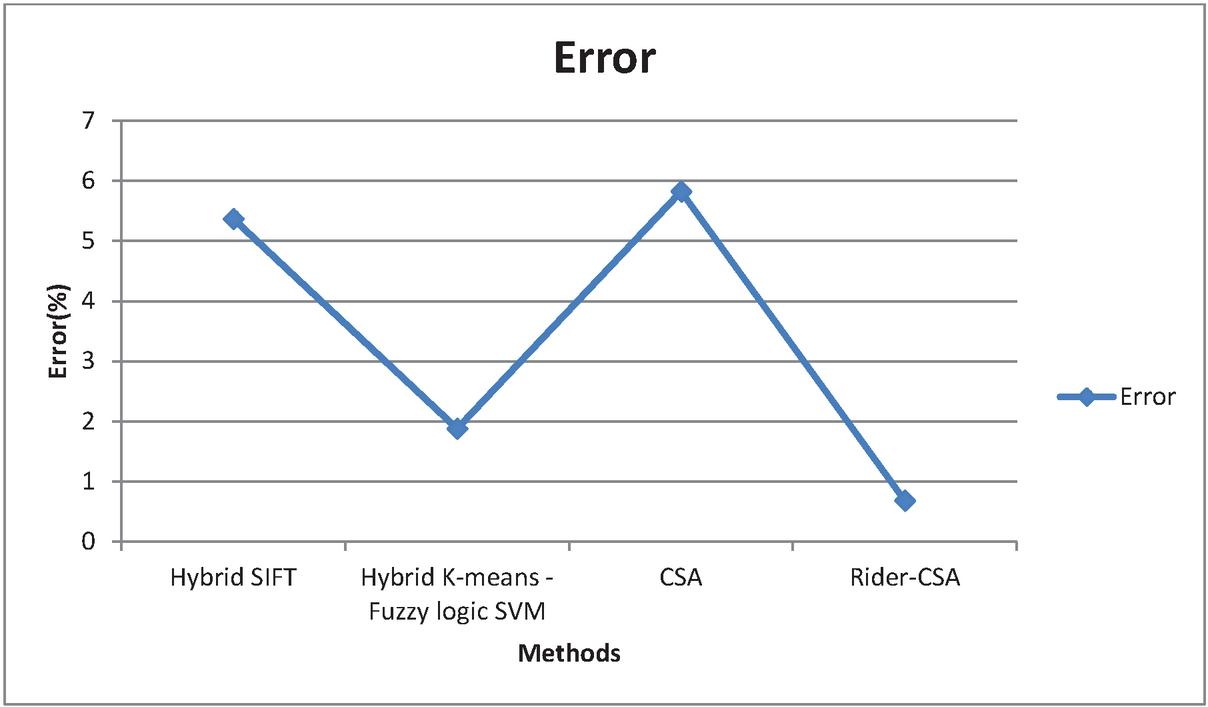
Figure 9 Graphical representation for Error.
Figure 9 shows the error in detecting the classification with hybrid SIFT algorithm is 5.37%, hybrid K-means fuzzy logic SVM is 1.88%, Cuckoo search algorithm is 5.82% and the proposed Enhanced Cuckoo search gives the accuracy is 0.68%.
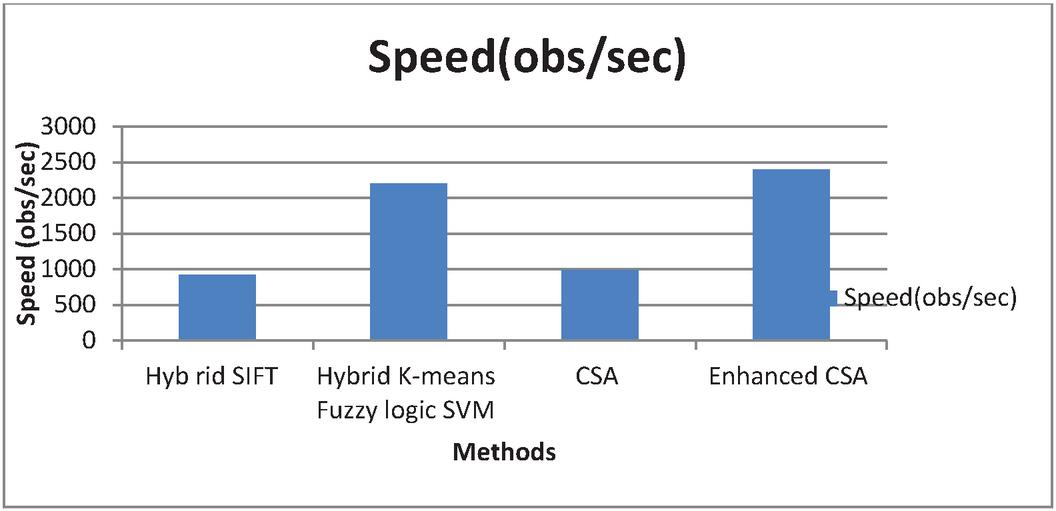
Figure 10 Graphical representation for Speed.
Figure 10 show that the proposed enhanced CSA provides higher speed. The speed of the algorithms is 920, 2200, 990, and 2400 obs/second respectively. The suggested improved method outperforms previous approaches in terms of speed.
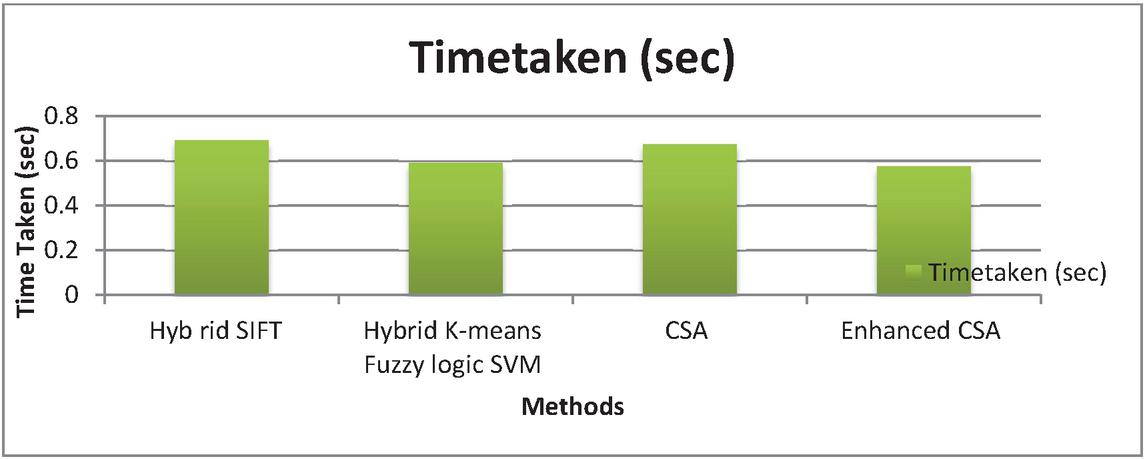
Figure 11 Graphical representation for Time taken.
Figure 11 shows that the time taken for each algorithm is 0.69412 seconds, 0.5941 seconds, 0.67576 seconds, and 0.57743 seconds respectively. The proposed Enhanced CSA algorithm involves minimum time which is 0.57743 seconds.
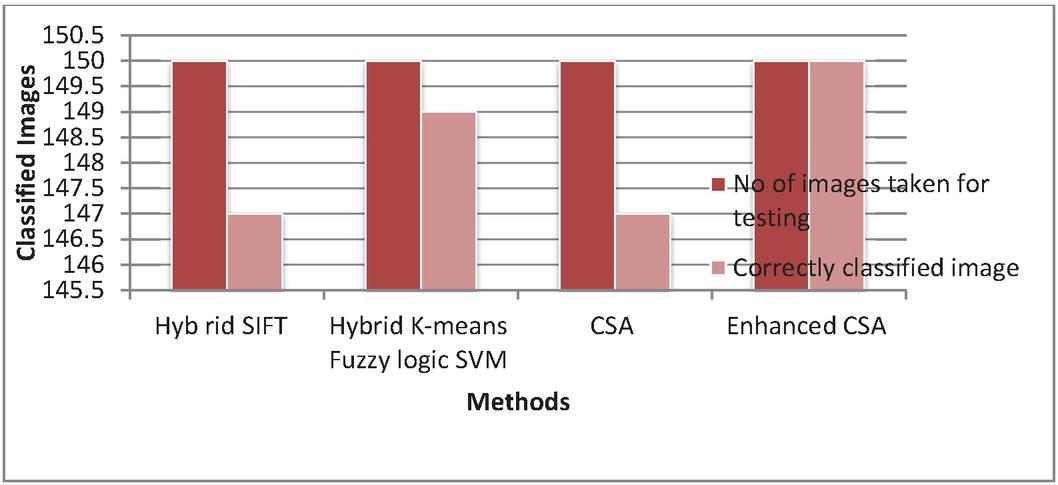
Figure 12 Graphical representation for No of correctly classified images.
Figure 12 shows the total number if leaf images taken for testing is 150 so the number of correctly classified images is 147, 149, 147 and 150 respectively. Therefore the Enhanced CSA classifies the maximum images correctly.
8 Conclusion
In this research, constructive methods for identifying the plant leaf diseases are rendered in plants. The plant leaf image is first used as an input for pre-processing phase, which reduces noise in the input image. After pre-processing phase the pre-processed image is involved in the segmentation process. Here segmentation is carried out with the piFCM algorithm. In the next step, each fragment encounters the feature extraction phase. The classification phase implements K-Nearest Neighbour algorithm to classify the accurate images. The Proposed method combines the Rider Cuckoo Search Algorithm and KNN algorithm, which performs better compared with the state-of-art algorithm. Plant Village dataset is used in implementing the proposed algorithm. The experimental results deal with the parameters such as the number of correctly classified images, Accuracy, Speed, and Time taken. Therefore Proposed algorithm outperformed with the values of 99.32% accuracy, 2400 obs/sec speed, and time taken is 0.57743 sec respectively. Improvements for the future can be the usage of a big dataset and implementing several diseases.
References
[1] W. Bao, J. Zhao, G. Hu, D. Zhang, L. Huang, and D. Liang, “Identification of wheat leaf diseases and their severity based on elliptical-maximum margin criterion metric learning,” Sustain. Comput. Informatics Syst., vol. 30, p. 100526, Jun. 2021, doi: 10.1016/j.suscom.2021.100526.
[2] A. Y. Dong, Z. Wang, J. J. Huang, B. A. Song, and G. F. Hao, “Bioinformatic tools support decision-making in plant disease management,” Trends in Plant Science. Elsevier Ltd, May 24, 2021, doi: 10.1016/j.tplants.2021.05.001.
[3] A. Abade, P. A. Ferreira, and F. de Barros Vidal, “Plant diseases recognition on images using convolutional neural networks: A systematic review,” Computers and Electronics in Agriculture, vol. 185. Elsevier B.V., p. 106125, Jun. 01, 2021, doi: 10.1016/j.compag.2021.106125.
[4] D. Shah, V. Trivedi, V. Sheth, A. Shah, and U. Chauhan, “ResTS: Residual Deep interpretable architecture for plant disease detection,” Inf. Process. Agric., Jun. 2021, doi: 10.1016/j.inpa.2021.06.001.
[5] V. Bischoff, K. Farias, J. P. Menzen, and G. Pessin, “Technological support for detection and prediction of plant diseases: A systematic mapping study,” Computers and Electronics in Agriculture, vol. 181. Elsevier B.V., p. 105922, Feb. 01, 2021, doi: 10.1016/j.compag.2020.105922.
[6] G. B.V. and U. D. G., “Identifying and classifying plant disease using resilient LF-CNN,” Ecol. Inform., vol. 63, p. 101283, Jul. 2021, doi: 10.1016/j.ecoinf.2021.101283.
[7] K. Thaiyalnayaki and C. Joseph, “Classification of plant disease using SVM and deep learning,” Mater. Today Proc., May 2021, doi: 10.1016/j.matpr.2021.05.029.
[8] R. Sujatha, J. M. Chatterjee, N. Z. Jhanjhi, and S. N. Brohi, “Performance of deep learning vs machine learning in plant leaf disease detection,” Microprocess. Microsyst., vol. 80, p. 103615, Feb. 2021, doi: 10.1016/j.micpro.2020.103615.
[9] V. Tiwari, R. C. Joshi, and M. K. Dutta, “Dense convolutional neural networks based multiclass plant disease detection and classification using leaf images,” Ecol. Inform., vol. 63, p. 101289, Jul. 2021, doi: 10.1016/j.ecoinf.2021.101289.
[10] E. Liu, H. Zhao, S. Zhang, J. He, X. Yang, and X. Xiao, “Identification of plant species in an alpine steppe of Northern Tibet using close-range hyperspectral imagery,” Ecol. Inform., vol. 61, p. 101213, Mar. 2021, doi: 10.1016/j.ecoinf.2021.101213.
[11] R. Cristin, B. Santhosh Kumar, C. Priya, K. Karthick, “Deep neural network based Rider-Cuckoo Search Algorithm for plant disease detection”, Artificial Intelligence Review 2020. https://doi.org/10.1007/s10462-020-09813-w.
[12] Zhang, Xuhui, Liu, Yang, Lin, Haijun and Liu, Yukun. (2016). Research on SVM Plant Leaf Identification Method Based on CSA:. 624. 171–179. 10.1007/978-981-10-2098-8\_20.
[13] M. P. Vaishnnave, K. S. Devi, P. Srinivasan and G. A. P. Jothi, “Detection and Classification of Groundnut Leaf Diseases using KNN classifier,” 2019 IEEE International Conference on System, Computation, Automation and Networking (ICSCAN), 2019, pp. 1–5, doi: 10.1109/ICSCAN.2019.8878733.
[14] Munisami, T., Ramsurn, M., Kishnah, S., and Pudaruth, S. (2015). Plant Leaf Recognition Using Shape Features and Colour Histogram with K-nearest Neighbour Classifiers. Procedia Computer Science, 58. doi: 10.1016/j.procs.2015.08.095.
[15] Verma, Hanuman, Tech, M. and Agrawal, R.. (2015). “Possibilistic Intuitionistic Fuzzy C-means Clustering Algorithm for MRI Brain Image Segmentation”, International Journal on Artificial Intelligence Tools. 24. 150205174241005. 10.1142/S0218213015500165.
[16] Wang P, Fu H, Zhang K (2018a) A pixel-level entropy-weighted image fusion algorithm based on bidimensional ensemble empirical mode decomposition. Int J Distrib Sens Netw 14(12):1–16.
[17] Roobaert D, Karakoulas G, Chawla NV (2006) Information gain, correlation and support vector machines. In: Guyon I, Nikravesh M, Gunn S, Zadeh LA (eds) Feature extraction. Springer, Berlin, pp. 463–470.
[18] Damer N, Führer B (2012) Ear recognition using multi-scale histogram of oriented gradients. In: Proceedings of eighth international conference on intelligent information hiding and multimedia signal processing. IEEE, pp. 21–24.
[19] Hu, L.Y., Huang, M.W., Ke, S.W. and Tsai, C.F., 2016. The distance function effect on k-nearest neighbor classification for medical datasets. SpringerPlus, 5(1), pp. 1–9.
[20] A. Agapitos, M. O’Neill, and A. Brabazon, “Adaptive distance metrics for nearest neighbour classification based on genetic programming,” in Proceedings of European Conference on Genetic Programming, 2013, pp. 1–12.
[21] Wang, G., Yuan, Y. and Guo, W., 2019. An improved rider optimization algorithm for solving engineering optimization problems. IEEE Access, 7, pp. 80570–80576.
[22] Binu, D. and Kariyappa, B.S., 2018. RideNN: A new rider optimization algorithm-based neural network for fault diagnosis in analog circuits. IEEE Transactions on Instrumentation and Measurement, 68(1), pp. 2–26.
[23] Yang, X.S. and Deb, S., 2014. Cuckoo search: recent advances and applications. Neural Computing and Applications, 24(1), pp. 169–174.
[24] Shehab, M., Khader, A.T. and Al-Betar, M.A., 2017. A survey on applications and variants of the cuckoo search algorithm. Applied Soft Computing, 61, pp. 1041–1059.
Biographies

M. Sowmya recived her Master degree in computer science in KGISL college of atrs and science, Coimbatore, Tamil Nadu India. She received her M.Phil degree in Computer Science in Government Arts College, Coimbatore and She is a research scholar in Shri Nehru Maha Vidhyalaya college of Arts and Science. Her area of interests includes Data mining and Image mining.

Bojan Subramani received his Masters Degree in Computer Science from PSG College of Arts and Science, Coimbatore. He received his M.Phil degree in computer science from Manonmaniam Sundaranar university, Tamilnadu and Ph.D. in Computer Science from Bharathiar university, Coimbatore. He is working as a Principal in Shri Nehru Maha Vidhyalaya college of Arts and Science, Coimbatore. His research interest includes Networking, Mobile computing, Wireless sensors.
Journal of Mobile Multimedia, Vol. 18_4, 1259–1280.
doi: 10.13052/jmm1550-4646.18414
© 2022 River Publishers