Refresh Rate and Graphical Benchmarks for Mobile VR Application Development
Zhong Wang1,*, Kenneth Foo2, Steven Yan2, Vicente A. Gonzalez1 and Nasser Giacaman2
1Department of Civil and Environmental Engineering, University of Auckland, New Zealand
2Department of Electrical, Computer, and Software Engineering, University of Auckland, New Zealand
E-mail: zwan256@aucklanduni.ac.nz; v.gonzalez@auckland.ac.nz; n.giacaman@auckland.ac.nz
*Corresponding Author
Received 15 February 2022; Accepted 21 April 2022; Publication 01 July 2022
Abstract
Virtual reality (VR) technology is quickly becoming more accessible to the general public due to the availability and capabilities of modern smartphone devices. However, such mobile devices are not as powerful as high-end desktop systems where VR is mostly established. Running demanding VR apps leads to performance issues such as lag, excessive heat, and fast battery drainage. To avoid these problems, software factors must be optimised. The user evaluation involved presenting multiple VR scenes (with varying frame rates), requiring participants to judge which scenes felt smooth; the results indicate that anything below 50 FPS was tolerable at best and nauseating at worst. To also measure the performance impact of various software settings, benchmarks were conducted on different smartphones. The results highlight the effects when varying the number of displayed on-screen objects, as well as outlining which settings should be avoid when specifically targeting mobile VR platforms. Heat and battery life were found to be non-issues at recommended performance levels. The proposed work established valuable guidelines which can be helpful for real time applications in development time reduction and complexity simplification from graphical and refresh rate optimization perspectives.
Keywords: Virtual reality, usability, lag, mobile devices.
1 Introduction
Virtual reality (VR) technology immerses users in a simulated environment by displaying stereoscopic imagery [1, 2]. Although there are multiple ways to define VR, there are mainly four components in any VR environment: target behavior, organism, artificial sensory stimulation, and awareness [3]. VR is recognized as one of the most trending visualization methods and it has been used for training, education, tourism, and entertainment [4]. VR can be demonstrated by various equipment and Head Mounted Displays (HMDs) can be one of the most popular and cost efficient one [5]. Once constrained to demanding powerful and expensive workstations to operate effectively, VR is becoming more accessible to the general public due to the ever-improving capabilities of mobile devices [6]. The compact form factor, however, means that most of the internal components of a mobile device are inferior compared to those of a powerful desktop system and this can lead to limited graphical performance, as well as pronounced heat and battery issues [7]. Given that VR’s core essence is to convincingly simulate virtual worlds, a positive user experience is of utmost importance [8].
The development and publishing of software applications for mobile devices is not constrained to large software companies; this is popular among hobbyists and novice programmers [9]. This is likely to be more attractive with the increasing popularity and accessibility of mobile VR toolkits [10]. However, given the inherent hardware limitations, software developers are burdened with the task of optimising their VR apps to ensure smooth operation on mobile devices [11]. An experienced VR developer may do this systematically, knowing which settings and optimisation techniques to employ. Profiling tools can also come in handy to determine which factors affect performance. Debugging has long been acknowledged a difficult task for novice programmers [12, 13]. Inexperienced or hobbyist software developers are therefore likely to employ a less systematical approach, possibly through trial and error and avoiding profiling tools altogether.
The first contribution of this study includes exploring how different VR software settings affect performance on mobile devices, moving towards the production of guidelines to help inspiring mobile developers understand how to best optimise their mobile VR apps. Another contribution comes in the form of the results from the user evaluation, illustrating the wide range of perceived responsiveness reported by users. While together this helps inform software developers of the targets to aim for, it also highlights the constraining challenges in ensuring a comfortable mobile VR user experience and opening up future research opportunities to make mobile VR more feasible. The research questions are as follows:
RQ1: How does user-perceived lag vary among users for mobile VR apps?
RQ2: What software factors affect performance of VR apps deployed on mobile devices?
The rest of this paper is organised as follows. Section 2 presents related work surrounding mobile VR and its performance. Section 3 presents a user evaluation to determine how users perceive lag with varying frame rates, while Section 4 investigates how frame rates are impacted with various VR settings. Section 5 discusses the implications of this study, before concluding and suggesting future topics of research in Section 6.
2 Related Work
2.1 Mobile Virtual Reality
Virtual reality (VR) technology is becoming increasingly popular. In the first quarter of 2016 alone, $US1.2 billion was invested into immersive tech like VR, which is around 25 times the amount spent in the second quarter of 2014 [14]. Gartner also lists VR as one of the top trending technologies in 2019, and estimated that around 70% of companies will be experimenting with it by 2022 [15]. VR used to be a niche experience, requiring the use of powerful and expensive equipment. Headsets like the Sony PSVR, Oculus Rift, and HTC Vive cost hundreds to thousands of dollars [16, 17, 18, 19]. The lack of high performance machines at consumer-level prices also prevents most of the general public from experiencing virtual reality on a regular basis [20, 21].
As smartphones are becoming more powerful, this trend is slowly beginning to change. For most users already in possession of a smartphone, the only additional resource required is a modest VR headset; one such device, the Google Cardboard, can be purchased for as little as $10 dollars [22]. The affordability and ease of use of these viewers, along with the simple untethered setup with standard smartphones, makes mobile VR an attractive option for people who might otherwise choose not to enter the VR market [23, 24, 25]. For software developers, making VR applications for mobile devices also has the benefit of having a shorter time and lower cost to market, compared to selling high-end virtual reality gear [26].
Mobile devices unfortunately have their downsides [27], with thermal management being a prominent concern. Mobile architectures are designed with low power consumption, low overall device cost, and small amounts of computation in mind [28]. The compact nature of smartphones forbids conventional cooling methods like fans and heatsinks [29]. In this regard, high-end mobile models often cap their CPU frequencies at 2–2.5 GHz in order to meet the thermal constraints [30, 31]. He et al. believe that the power consumption burden imposed by the high-resolution displays is one of the main constrains of fluency for mobile VR applications, thus, a dynamic resolution scaling technique was experimented to partially release the burden by reducing the display resolution depending on viewing directions and distances [32]. However, such technique has the limitation of affecting user experience and can be less effective for application-embeded purposes such as video streaming [33] and Lai et al. indicate that it is important to identify the targeted refresh rate before balancing the power consumption and processability [31].
With the hardware locked and limited, it is mostly the software developers’ responsibility to maintain a good VR experience by making the most of such hardware. Optimisation is therefore crucial, since VR applications are inherently computationally demanding [34]. Poorly-performing apps that are laggy or unresponsive can induce nausea [35], and are among the most common complaint types on app stores [36, 37, 38]. To improve performance, developers can follow guides and tweak variables in game engines such as Unreal and Unity [39, 40], then use built-in profiling tools to determine the time an app spends doing various tasks [41, 42]. There are mainly two directions in the development of mobile VR application: local-based and network-based [43]. Local-based VR applications utilise smartphone hardware for processing and demonstrating VR contents, whereas network-based applications incorpora-tes cloud computing for data processing, telecommunication technologies such as 5G and WiFi-6 for data transferring, and smartphones for demonstraion [43, 31, 7, 44]. Although network-based VR application can achieve significantly less local processing tasks, power consumption and heat generation will remain as long-time limitations for current telecommunication technologies [31].
Oculus, as one of the main VR headset producer in the industry, provides a guideline for local-based VR performance optimization, which identifies key considerations as: number of polygons, number of lights, shadows and ambient occlusion, post-processing effects, and anti-aliasing [45]. Such consideratio-ns can be useful for the general development of VR applications, however, they can be too broad to use in practice as there is no benchmarks or specific metrics to measure the performance affected by them. Developers are unable to know the exact impact of these factors, nor the extent of which to change certain settings in order to reach a desired performance level. For example, a guide may recommend reducing the number of polygons and lights in a scene to boost frame rates, but it is unclear which of these two has the biggest impact. Peer-comparison is widely used in practice, which leads to development burdens and inaccurate results in optimisation. Therefore, this study seeks to help developers understand the performance impacts of different factors.
2.2 Performance Metrics
‘Performance’ refers to a broad range of different aspects when it comes to mobile devices. This section discusses performance in terms of latency, lag, thermals, and power consumption. Motion-to-photon latency can be defined as the time taken for an action in the real world to translate accordingly to motion on a screen [46, 47, 48]. This should be kept as low as possible, since users will start to experience motion sickness when their environments do not synchronise with their movements [49, 50].
Refresh rate is crucial for user-centered applications and especially VR [51]. It is one of the most significa-nt factors affecting VR sickness and the fluency of the application, which all contribute to general usability perspectives [52]. Refresh rate can be defined as the number of times that the display can draw a new image per second, and is measured in Hertz (Hz). El Beheiry et al. (2019) believe 60 Hz should be the targeted refresh rate for most VR applications in order to achieve smooth navigation [6]. Refresh rate can be affected by multiple factors, generally categorized into Software and Hardware. Scene complexity and rendering/mapping method can be two of the most important from a software perspective, while hardware factors relate to Central Processing Unit (CPU), Graphic Processing Unit (GPU), and Random-Access Memory (RAM) [6, 53, 54, 55]. Debattista et al. conducted an series of experim-ents using multiple VR devices, aiming to identify the frame rate suitable for VR applications, and they identified that the relationship between frame rate and resolution (detail quality) is complex [56]. Thus, it is important to control variables when conducting experiments to identify the optimized targeting refresh rate. Mackin et al. indicate that demonstrating VR contents in high refresh rate can be acknowledged to increase the perceived quality [57]. Thus, this study focuses on the refresh rate status, aiming to identify the targeting refresh rate range for VR application development, whereas high FPS will be referred to as ‘smooth’, while low FPS will be considered ‘laggy’.
For most smartphones, when running VR applications, the device temperature increases in accordan-ce with the processing work load and running time [32]. As temperature increases, so too does leakage power at an exponential rate [58, 59, 60]. This loss of energy causes components to consume even more power and leads to accelerated degradation of the battery [59, 61, 62]. Generally speaking, mobile devices have a thermal limit of around 60C [58]. Exceeding this limit can cause mobile devices to overheat, shutdown, or even explode [63, 61]. Therefore, it is recommended to always keep temperatures as low as possible. Smartphone manufactors have been developing and applying energy management techniques from operating system and hardware perspectives [64]. Kim et al. believe it is important to pay attention to the temperature in accordance with the energy consumption status when optimising the fluency aspects for smartphones [64]. Most smartphones are powered sorely by their batteries, which is the most critical component in any mobile device, whose lifespan is a top concern [65]. Poorly-written apps can drain up to 30–40% of battery life in a short span of time [66], and when battery levels get too low, devices become more sluggish and capabilities like WiFi might see a drop in performance as a result of built-in power saving functionalities [67]. Mobile apps should therefore aim to consume as little power as possible, particularly in a VR context where sluggish devices are unacceptable.Thus, both device temperature and battery status will be monitored and tested in this study.
2.3 Factors Affecting Performance
Different factors can come into play to affect the performance of a mobile device. All modern mobile devices contain a CPU, GPU, RAM, and storage space. These components are generally weaker than those found in a desktop, especially the GPU as it is often designed with lower power consumption in mind instead of high computing performance [68]. Components also widely vary between mobile devices, so software developers need to keep this in mind when publishing mobile VR apps intended to reach a large number of users. While the end user’s hardware limitations are out of the software developers’ hands, developers are still responsible for how well their apps run. It is practical to identify the refresh rate, thermal, and power consumption statuses for an application before providing pre-defined graphical configuration settings to users [69].
With numerous optimisation options available, balancing quantity and quality is the key to good optimisation; tradeoffs must be made between high-quality graphics and smooth performance [70]. For example, 3D graphics objects are constructed out of polygons. Sets of them are used to create the surface of an object, called the ‘mesh’ or ‘model’ [71]. As more objects are contained in a scene, more polygons are used and therefore performance suffers [72]. A common technique developers use to alleviate this problem is to change the objects’ level of detail. Details are harder to notice when things are farther away, so less polygons can be used to represent the same object at different distances [71, 73]. Aside from these options, other settings that can affect performance include lighting, shadows, and post-processing effects.
3 User Performance Evaluation
VR experiences with poor performance often lead to nausea and motion sickness, so a smooth user experience is essential. While motion-to-photon latency is an important indicator, setups to measure this tend to be overly complicated for most software developers [47, 74]. Frame rate, on the other hand, is another indicator that is accessible to software developers as this is reported in development tools. The fact that the highest most smartphones can output is 60 FPS [31], the goal was to determine how low this value could go before users complained that the declining performance was perceived. In order to determine this cutoff point, a user evaluation was carried out with N 51 participants, using a VR application developed by Unity Ver. 2020.3.31f1. The evaluation presented participants with a series of replicated scenes (at differing FPS), recording which scenes were laggy versus smooth.
3.1 Methodology
An Android mobile VR app (built using Unity) was designed for the user-perceived performance evaluat-ion. This evaluation app was motivated using Delay Analyser [75], an online tool used to demonstrate user-perceived delays in a GUI. This idea was adapted for in the context of VR to study lag. Rather than presenting the user with tiles of differing delays, the evaluation involved presenting the user with scenes of differing FPS rates. For each scene, the user is required to look at the statue of a lion. This is presented on cinema-like background, to assist users in knowing where to focus in relation to the environment. The participant is then required to select whether the current scene appears smooth or laggy by selecting the appropriate button. A screenshot is shown in Figure 1. After the participant selects one of the buttons for a given scene, they need to look back up at the lion in order to re-activate the buttons for the next scene. This ensures participants do not inadvertently and repeatedly select any of the buttons every time a new scene appears; it also increased the likelihood that users actually “absorbed” the FPS for the respective scene before deciding on its responsiveness.
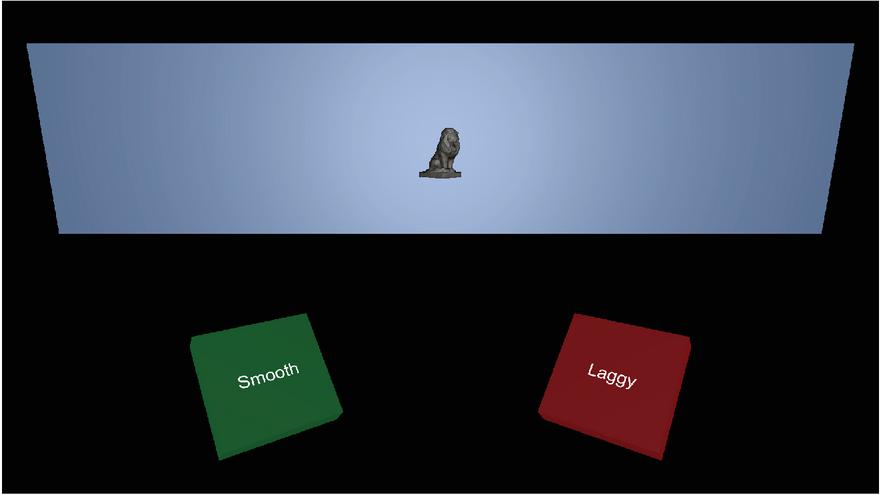
Figure 1 The interface of the user-perceived lag evaluation app involved presenting participants with scenes identical to this. In the static set, the lion was stationary. In the dynamic set, the lion was moving sideways within the cinema-like background. When one of the two buttons is selected, both disappear and require the user to activate the next scene (with the new FPS) by looking back up at the lion.
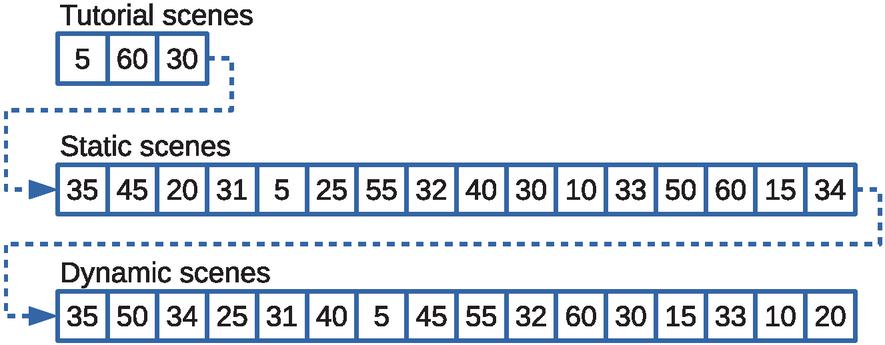
Figure 2 Two sets of target frame rates (ranging between 5-60 FPS) were presented to the participants using the above pseudorandom ordering. Although the ordering appears random to each participant, the ordering was the same for all participants to allow for better interpretation of the results. A short tutorial consisting of three scenes helped familiarise users to the evaluation.
As the maximum refresh rate of the mobile displays are limited to 60 FPS, the target FPS presented to participants ranged from 5 FPS to 60 FPS in increments of 5. An initial pilot test determined that user responses tended to “switch” opinions between the target FPS of 30 and 35. As a result, additional scenes with target FPS of 31, 32, 33, and 34 were also added to allow closer study of target FPS between the 30-35 FPS range. This brought the total number of test scenes to 16 FPS. It was also important to investigate whether users’ opinion of lag differed when observing stationary VR content (static), compared to VR content with a moving object (dynamic). To allow study this, there were 16 static scenes with a pseudorandom FPS ordering, followed by 16 dynamic scenes with a different pseudorandom FPS order (Figure 2). Throughout the entire experiment, in both static and dynamic scenes, participants were encouraged to minimise their own movement to avoid interfering with their assessment. With that said, participants were encouraged to remain natural in their stance so as to better reflect real-world usage. Despite the intention of standing still, head rotation is neurally controlled and activates with even subtle changes in the person’s environment [76].
To decrease potential issues when users are first familiarising themselves with the evaluation, a short in-app tutorial was presented to all participants. This involved guiding users through three practice scenes. The first was an “obviously laggy” scene guiding the user to select the laggy button. The second was an “obviously smooth” scene guiding the user to select the smooth button. The final practice scene was a less-obvious FPS, allowing the user to select any of the buttons they felt appropriate. The set of 16 static scenes immediately followed the tutorial, and the set of 16 dynamic scenes wrapped up the evaluation. The pre-shuffled pseudorandom ordering of the scenes was necessary to ensure participants selected laggy or smooth without having any inclination as to whether scenes are meant to be getting better or worse. Fixing the same pseudorandom for all participants was also important, as this allowed studying any potential “relativity” effects (e.g. a particular target FPS is actually laggy, but is perceived smooth relative to an immediately preceding poor FPS).
The VR app logged each participant’s decision made on each target FPS, as well as the time taken to make that decision. In order to validate that participants were experiencing the intended target FPS, the app also logged actual FPS shown every 100 milliseconds. A total of 51 engineering students from the University of Auckland participated in the evaluation (studying either electrical, computer systems, or software engineering). To ensure consistency in the measurements, all participants used one of five identical smartphones (Samsung Galaxy A8 2018), as well as an identical VR headset (VR BOX 2.0).
3.2 Results
3.2.1 User-perceived lag
The summary of user-perceived lag for the different target FPS values is presented in Figure 3, for both static and dynamic scenes. The results tend to reveal clear patterns of user opinions, but there is no single prominent target FPS revealing where users felt the difference between laggy and smooth FPS. The middle-range targets tend to be blurred at times, with participants possibly struggling to make a decision within these zones. For the static scenes, target FPS of 5 to 20 were obviously unacceptable to the majority of participants. However, for the dynamic scenes, the obviously unacceptable target FPS were 5 to 25. Before concluding that a target FPS of 25 is acceptable for static scenes (while they are not for dynamic scenes), one needs to keep in mind the differing pseudorandom ordering (recall Figure 2). In the static set of scenes, 25 immediately followed 5 (so many participants may have been inclined to be more acceptable of 25 FPS in comparison). In the dynamic set of scenes, 25 immediately followed 34 (so some participants may have noticed the decline in smoothness in comparison). This interesting observation will be discussed later on.
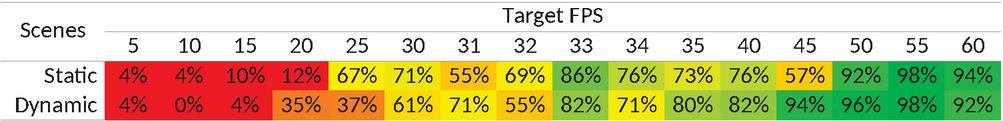
Figure 3 Distribution of user opinions for each of the 16 targeted FPS, in both static scenes without any moving elements, versus dynamic scenes with a moving element. The percentages refer to the proportion of participants that felt the respective FPS was smooth as opposed to laggy (red is bad, green is good). It is important to keep in mind that the target FPS were presented in a pseudorandom order. This creates anomalies due to effects of relativity, for example in the static scenes a target FPS of 33 (following the 10-FPS scene) performed much better than a target FPS of 45 (following the 35-FPS scene).
To better understand the statistical significance of the differences between the different target FPS, McNemar’s test was used. This is a repeated measures test using the participants’ laggy/smooth responses as paired data. This allows comparisons between any two target FPS to determine if users perceived one target FPS as being different to another. If enough users had differing opinions between the two FPS, then the difference is considered to be significant. This allows the different FPS to be grouped into clusters, if they are perceived to be more or less similar in user-perceived ratings. The results of all possible pairs of target FPS are shown in Figure 4.

Figure 4 Pairwise comparisons of user-perceived lag between all target FPS, in both the (a) static and (b) dynamic scenes. The statistical test carried out at each comparison is a repeated measures McNemar’s test (i.e. paired data) with a significance level of p=0.05. Cells with mean a statistical significance in the participants’ reported difference in lag between the two respective FPS, while means a difference that is not statistically significant. This helps identifying “clusters” of neighbouring FPS that can be considered equivalent classes.
Using a significance level of p 0.05, crossed cells () denote that participants did not perceive a statistically significant difference between the two respective FPS. In this regard, the two FPS are considered in the same equivalence class from the participants’ point of view. Checked cells (denote that participants noticed a clear difference between the two FPS, and they are therefore not in the same equivalence class. The results tend to show some distinct equivalence classes at low (5–15 FPS) and high (50–60 FPS) frame rates for both scenarios. This is almost the case for the mid-range FPS (25–45 FPS), although not quite as clear-cut due to the “patchy” cells. Here, cells appear where cells would be expected (since, in theory, neighbouring FPS should be in the same equivalence class). The vague boundaries closely resemble the results shown in Figure 3, attributed back to the relativity effects resulting from the pseudorandom ordering.
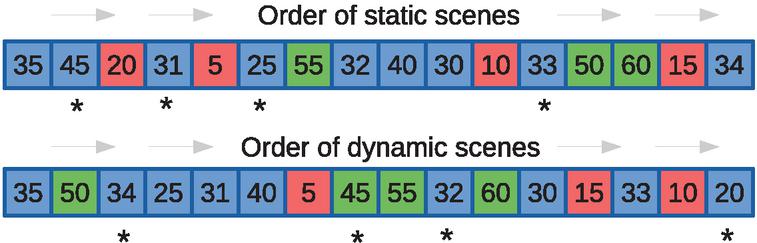
Figure 5 The FPS were roughly clustered into equivalence classes for each set of scenes. Red denotes obviously laggy, green denotes obviously smooth, while blue denotes in between. As the scenes were presented in a pseudorandom order, outliers in the user-perceived performance arose (denoted by *).
In order to explain these odd pattern of results, outliers were identified and analysed. Figure 5 shows the different FPS in the order they were presented to participants, colour-coded according to the equivalence classes highlighted by the McNemar’s tests. By cross-referencing the results of Figure 3 with Figure 4, this allows the identification of outliers (denoted by * in Figure 5). These outliers result for various reasons:
• Static-25: This FPS was perceived smoother than it should have been (compared to Dynamic-25). This happened because it was ordered immediately after 5 FPS, where the additional 20 frames per second potentially caused users to have an overly positive bias towards 25 FPS in comparison to 5 FPS.
• Static-31: This FPS was perceived slightly more laggy than it should have been. On further inspecti-on of McNemar’s test results, the p-value for 30 vs 31 FPS was 0.048. If this was only slightly higher (0.05 or above), the difference would have been considered statistically insignificant. This outlier was therefore likely the result of a few participants being uncertain about the verdict of 31 FPS, and many of them selecting laggy out of pure indecisiveness.
• Static-33: This FPS was perceived much smoother than it should have been. This happened because it came right after 10 FPS, and the additional 23 frames per second potentially caused some users to have an overly positive bias towards 33 FPS in comparison to 10 FPS.
• Static-45: This FPS was perceived much more laggy than it should have been. While there is no clear explanation as to why this might have happened, it may be attributed to being an early scene in the user evaluation. Users had not been exposed to a wide range of FPS at this point, and were probably still getting used to the process of deciding. Adding further confusion, 45 FPS was immediately preceded by 35 FPS, which had a higher perceived smoothness.
• Dynamic-20: This FPS was perceived slightly smoother than it should have been (compared to Static-20). This happened because it came right after 10 FPS, an extremely laggy frame rate. The mere additional 10 frames per second were sufficient to convince some users that 20 FPS was smooth.
• Dynamic-32 and Dynamic-34: These FPS were perceived more laggy than expected. This happen-ed because they came right after high FPS (55 and 50 respectively), and the drop in frames caused some users to have a heightened negative bias towards these FPS.
• Dynamic-45: This FPS could be considered smoother than it should have been. This happened because it came right after 5 FPS, and the jump of 40 frames caused users to have an overly positive bias towards 45 FPS.
Additional McNemar’s tests were carried out to compare the participants’ responses on the FPS between the static and dynamic scenarios. If the differences are significant, this may suggest that the perceived lag differs in a static environment compared to one with moving objects. The results are presented in Figure 6. In general, and as expected, there is no statistical significance difference between static and dynamic scenes on the same FPS. The exceptions are for 20, 25, 31, and 45 FPS. However, all of these cases are known outliers discussed above.
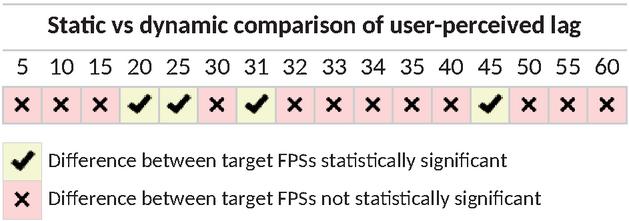
Figure 6 Comparing differences in user-perceived lag for the static versus dynamic scenes, using McNemar’s tests with a significance level of p=0.05. Cells with means a statistical significance in the participants’ reported lag difference for the respective FPS, while means a difference that is not statistically significant. The existence of statistically-significant differences is largely attributed to the effects of the different pseudorandom ordering of static versus dynamic scenes.
3.2.2 Time to decide
In addition to recording the participants’ decisions, the time taken for to decide was also recorded for every scene. The results are summarised in Table 1. FPS on the extreme ends (the ones that are considered either very smooth or very laggy) seem to be the easiest for users decide on, requiring less time to decide. Participants tended to take longer deciding on FPS in the middle range, understandably as the lag becomes more borderline. The 35 FPS stands out with the longest mean time across both static and dynamic. This is most likely due to it being the first scene presented in both cases. In the static scenes, 35 FPS was the first to appear in the entire evaluation—so participants were probably familiarising themselves to the app interface. In the dynamic scenes, 35 FPS was the first time users see the lion statue started moving—so participants were probably intrigued with this new behaviour. While these results present no unusual information, they do help to reinforce the previous results where participants may have struggled determining whether some FPS were laggy or not.
Table 1 Time to decide for static and dynamic scenes
| Target FPS | |||||||||||||||||
| 5 | 10 | 15 | 20 | 25 | 30 | 31 | 32 | 33 | 34 | 35 | 40 | 45 | 50 | 55 | 60 | ||
| Static | Mean (s) | 1.7 | 2.6 | 2.5 | 3.8 | 4.6 | 3.6 | 4.6 | 3.8 | 3.7 | 3.7 | 6.0 | 4.0 | 4.8 | 3.1 | 3.3 | 3.0 |
| SD | 1.23 | 1.43 | 1.99 | 2.39 | 3.04 | 2.30 | 2.74 | 2.25 | 2.42 | 2.75 | 3.07 | 2.31 | 2.75 | 2.51 | 2.20 | 1.94 | |
| Dynamic | Mean (s) | 1.0 | 2.4 | 2.3 | 3.5 | 4.1 | 3.6 | 4.0 | 3.9 | 3.2 | 4.3 | 5.8 | 3.3 | 2.8 | 3.3 | 2.5 | 2.6 |
| SD | 0.44 | 1.61 | 1.24 | 2.22 | 2.29 | 2.97 | 2.44 | 2.99 | 1.94 | 2.28 | 3.32 | 1.78 | 1.52 | 1.70 | 1.67 | 1.49 | |
3.2.3 Actual FPS validation
As the target FPS presented to users were software-generated within the VR app, validation was carried out to verify that participants were indeed seeing the intended target FPS. To achieve this, the VR app was polling and recording the effective “actual” FPS every 100 milliseconds. Due to lack of an external method to read the actual FPS, this had to be implemented within the evaluation app itself. At each polling point, the app logs the time passed since the immediately-preceding frame within Unity’s Update() function (which executes on every frame).
It is important to keep in mind that these actual FPS recorded are what the VR app is capable of generating and sending to a smartphone, and not what the smartphone is physically displaying to the user. As a result, it is possible for the app to generate more than 60 frames per second—but the devices (Samsung Galaxy A8 2018) are physically only capable of displaying 60 FPS. This is generally not a problem as smartphones would try to push out as many frames as possible. The overall process of limiting to target FPS (and the subsequent recording of effective FPS) for each scene tends to be largely accurate, but not 100% perfect. Figure 7 plots all the polled actual FPS for all the targeted FPS across all the scenes.
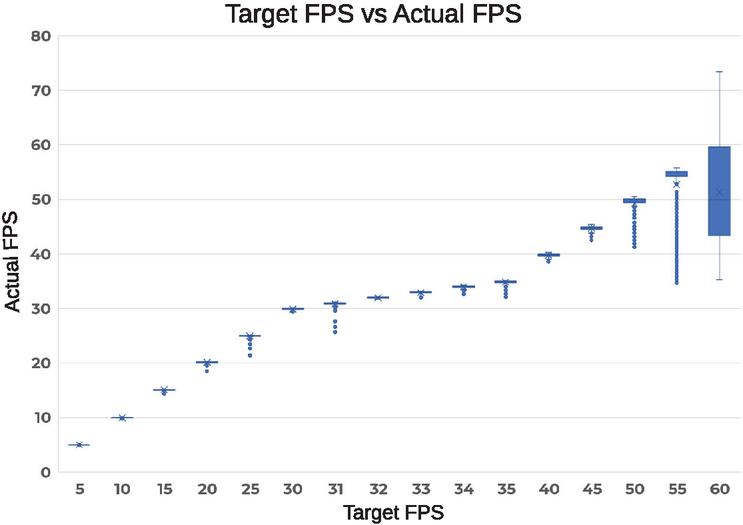
Figure 7 Target FPS versus the actual FPS that what were generated to be shown to the participants.
For the most part, the FPS are reliable, and participants saw what was intended. Towards the higher FPS, particularly 50–60 FPS, the actual frame rates start to deviate more substantially. Fortunately, most of the data points here were outliers for 50–55 FPS. This did not seem to affect the perceived lag, as participants were still reporting high performance at these target FPS (Figure 3). The issue seems to be more concerning with 60 FPS, to the point where users might not have been seeing that value during the evaluations. It is assumed this might have been due to the synchronisation of frame delivery and displaying, potentially coupled with the smartphone struggling to work at maximum pressure trying to deliver at its physical limits of 60 FPS.
To determine if the unstable pattern was only happening with 60 FPS, additional tests were carried out where the frame rate was capped at new targets beyond 60: as well as uncapped entirely. Actual FPS were again polled for each of the target FPS every 100 milliseconds, for a total of three minutes per target FPS. The results in Figure 8 show that limiting the VR app’s FPS to 60 is very similar to capping it beyond 60 FPS, and even not capping it at all. An ANOVA test between these target FPS confirms that the differences are not statistically significant (p-value 0.409).

Figure 8 Additional testing was performed to investigate what happened when the target FPS was set over 60 FPS. Ultimately, the smartphone still caps the actual FPS to 60 and aims to deliver around this.
Uncapping the frame rate would mean that the mobile device in question is running at its maximum potential, and a VR app would not be able to appear any smoother to users. Since 60 FPS follows this pattern, it can be safely concluded that the abnormally-varying values do not affect the results of the user evaluations. Nevertheless, the inaccuracy of capping high FPS cannot be ignored. While there is no reliable explanation at this time, the behaviour is best explained by the implementation of the code itself. Limiting the FPS is achieved by busy waiting depending on the targeted FPS. This action utilises the platform’s system time via the Unity API, and perhaps the time granularity is less accurate than desired.
4 VR Settings Benchmarking
Software developers have numerous settings and tools at their disposal when developing VR apps. The goal was to determine how many of these software factors affected mobile device performance, so commonly-used ones were selected from the Unity game engine, and individually benchmarked on three different smartphones (OnePlus 3, Huawei Nova 3i, and Samsung Galaxy A8). Experiments conducted in this section used a VR application developed by Unity Ver. 2020.3.31f1.
4.1 Design and Implementation
The creative freedom enjoyed by software developers is immense, and there are a large number of setting options available. After exploring the possibilities within Unity, the following software factors were selected to be investigated based on fundamentality, practicality, and impactfulness:
• Polygons
• Point lights
• Shadows and ambient occlusion
• Post-processing effects (chromatic aberration, depth of field, grain, vignette)
• Anti-aliasing
The building blocks of 3D graphics are polygons, which are used to model different shapes and objects. Therefore, every benchmark made for the VR app had to have them. In order to test the entire range, a comfortable amount was set as the baseline (100,000), and this value was incremented in steps of 100,000 all the way up to 3 million. The performance impact of the other software factors were eventually evaluated by adding them to these scenes separately. In order to accumulate enough data, each scene was presented on the VR app for 20 seconds before switching to the next one while the FPS were automatically logged.
4.2 Results
Due to the amount of data points collected, only the median FPS were plotted for the following graphs.
4.2.1 Polygons
The impact of different amounts of polygons on FPS is shown in Figure 9. The results show a clear trend for all three smartphones. As more polygons were added to the scene, the effective FPS significantly dropped until around 10–15 FPS. Since Section 3 determined that the cutoff point for a smooth VR experience is 50 FPS, software developers should avoid having more than 500,000 polygons for a mobile VR app (assuming the targeted smartphones are similar to those in the chart). One feature worth noting is flat line at 60 FPS. This was explained in Section 3.2.3, where the frame rates presented to the smartphone are logged rather than what the smartphones are physically displaying.
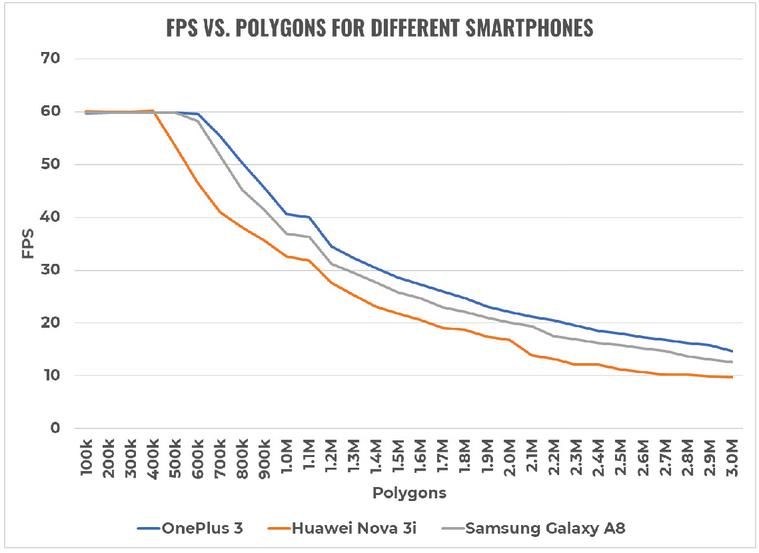
Figure 9 Impact of polygon count on FPS for the three different smartphones. These performances represent best-case “baselines” for the respective smartphones, as all additional settings that might affect performance are disabled.
After experimenting with polygons, the benchmarking process hit an unexpected obstacle. Plotting the results from the other software factors showed that they were all highly unstable with unexpected spikes. No amount of retesting fixed the issue, and the only device that appeared unaffected (and continued producing clean readings) was the OnePlus 3. Additional research was carried out, and althou-gh there was no definitive clear answer, the cause is believed to be hardware-related (for example, online benchmarks reveal that the OnePlus 3’s Adreno 530 performs better than the Mali-G51 and Mali-G71 in the other two smartphones). In order to report only stable results, and have a more reliable understanding of the impact, the remainder of the benchmarks will predominantly focus on performance exhibited on the OnePlus 3.
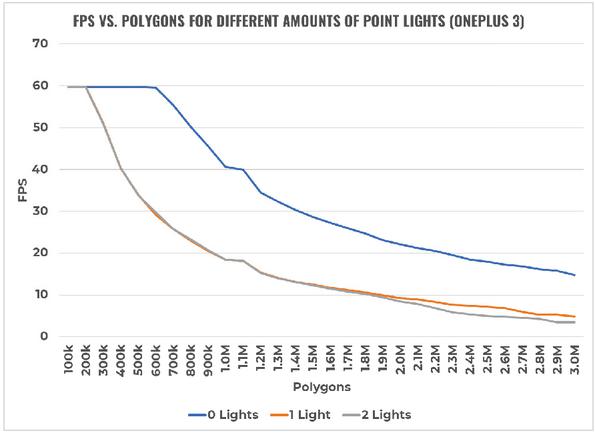
Figure 10 Impact of point lights (OnePlus 3).
4.2.2 Point lights
Point lights are light sources, and they were benchmarked by pointing them at all the polygons present in the scene, with 10 range, 135 spot angle, 1 intensity, and 0 indirect multiplier. The impact on FPS is shown in Figure 10 carried out on the OnePlus 3. For completeness, Figure 11 has also been included demonstrate the unstable performance on the Samsung Galaxy A8 (with similar behaviour for the Huawei Nova 3i). The results show that point lights have a major impact on performance—adding just one to a scene can decrease FPS by up to 30 (at 600,000 polygons). Additional lights thereafter will decrease frame rates by a negligible amount. If point lights are necessary, it is recommended that less than 300,000 polygons be present in a scene. It was discovered during the benchmarking process that when a point light was inserted into a scene, the total polygon count reported by Unity (listed as ‘triangles’) doubled exactly.
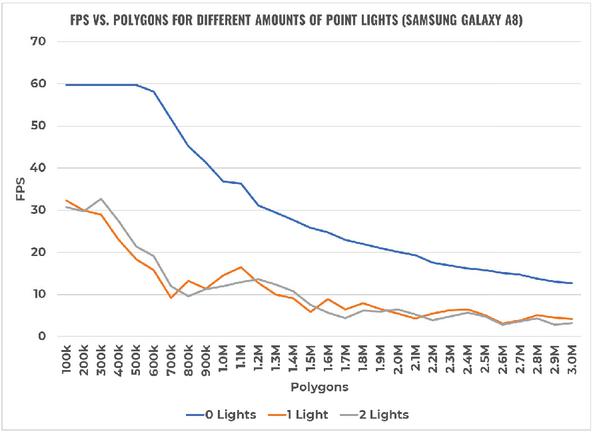
Figure 11 Impact of point lights (Samsung Galaxy A8).
4.2.3 Shadows and ambient occlusion
Shadows can be cast under objects, but at least one light source must be present in the scene. For these benchmarks, one point light was used and the shadow was set to 1 strength, 0.05 bias, and 0.2 near plane. Ambient occlusion, on the other hand, is a shading technique that adds subtle shadows around the edges of objects, and does not require a light source to be present. The impact of the different settings are shown in Figures 12 and 13 respectively. These results show that turning on shadows will cause performance to drop by about 5 FPS, regardless of the amount of polygons present (but keep in mind that FPS would have already dropped significantly as this required adding at least one light source). This trade-off is arguably worth it for the increased realism. However, in doing so, the amount of polygons in the scene should be kept around or below 250,000 to maintain a comfortable VR experience. On the other hand, ambient occlusion is a setting that is extremely taxing. Turning it on will cause frame rates to plummet well below the cutoff of 50 FPS. This setting should therefore never be turned on when developing VR apps for mobile devices.
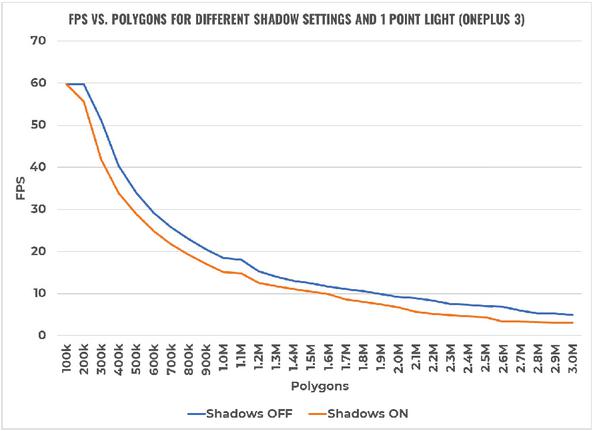
Figure 12 Impact of shadows (OnePlus 3).
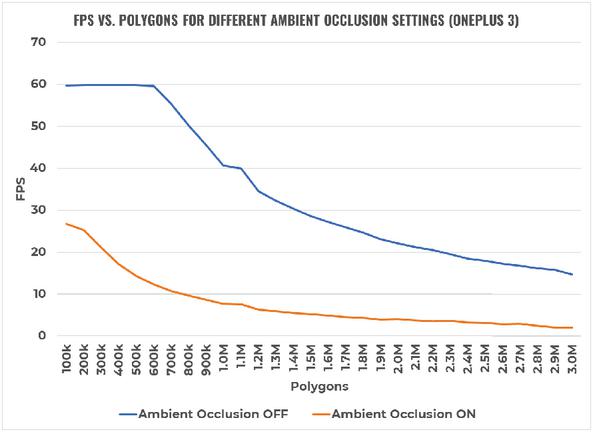
Figure 13 Impact of ambient occlusion (OnePlus 3).
Figure 14 Impact of chromatic aberration (OnePlus 3).
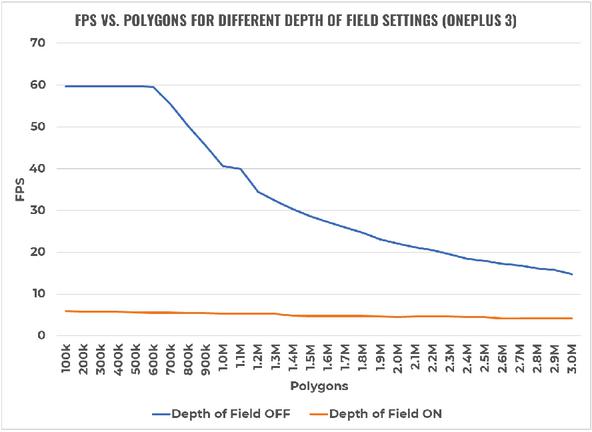
Figure 15 Impact of depth of field (OnePlus 3).
4.2.4 Post-processing effects
Post-processing effects are filters that are applied to the lens of a camera in order to modify and enhance the look and feel of an app. Chromatic aberration is one that distorts colours, often for cinematic effect, while depth of field involves focusing on a subject and blurring the background. The impact of the two post-processing effects are shown in Figures 14 and 15 respectively. The results show that chromatic aberration has almost the same impact as point lights. As a result, the same recommendation applies and the total polygon count should not exceed 300,000 if this post-processing effect is to be used. For depth of field, the graph clearly shows that turning this setting on at any point will cause FPS to plummet—making the VR experience on mobile devices intolerable. This post-processing effect should therefore never be turned on when developing mobile VR apps.
Grain is a post-processing effect that adds digital noise to a scene, while vignette makes what the camera sees more “cinematic” by darkening the edges of its frame. The impact of these effects are shown in Figures 16 and 17 respectively. Grain and vignette effects seem to follow the same trend, mirroring the performance impact of point lights and chromatic aberration. Again, this means that the suggested polygon count should be constrained below 300,000 if either of these options are to be used.
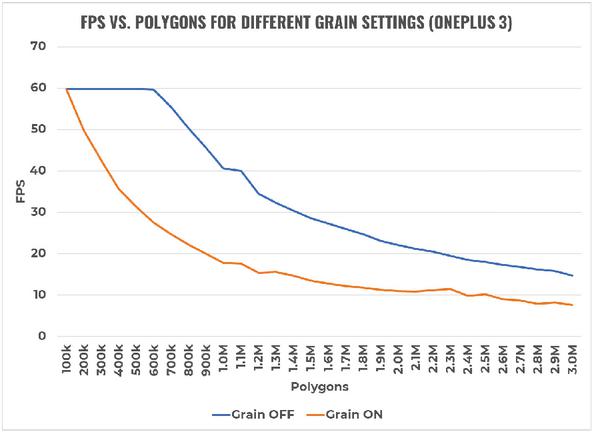
Figure 16 Impact of grain (OnePlus 3).
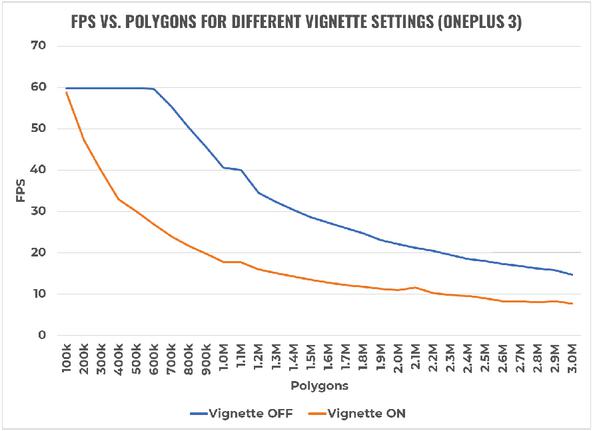
Figure 17 Impact of vignette (OnePlus 3).
4.2.5 Anti-aliasing
Anti-aliasing is a processing technique that aims to eliminate the “jaggedness” of edges around objects. This is particularly important for mobile VR, since the screens are close to a user’s eyes and pixels are easily noticeable. Unity uses multisample anti-aliasing (MSAA), and it comes in three levels: 2x, 4x, and 8x. The larger the number, the more samples are used to smooth out edges. The impact of these different settings are shown in Figure 18. Results reveal that all levels of MSAA have roughly the same impact on performance, similar to those of point lights and most of the post-processing effects. If anti-aliasing is to be used, 8x MSAA is a good option as it produces the best visual results without extra performance hits.

Figure 18 Impact of anti-aliasing (OnePlus 3).
4.2.6 Heat and battery tests
In order to evaluate the impact of software factors on the temperature and battery life of mobile devices, a simple test was carried out using a custom-made Android app that monitored these metrics in one second intervals. The experiment only involved two test cases, one when the FPS was at its maximum capability (60 FPS), and another when it was at its recommended minimum (50 FPS). These frame rates were achieved by utilising the polygon-only scenes for the OnePlus 3. With the monitoring app in the background, these scenes were left running for 30 minutes. This amount of time was chosen to collect sufficient amounts of data, and because most people would not typically use mobile VR for beyond 10-15 minutes due to potential nausea [77, 78]. The results are shown in Figures 19 and 20 respectively.
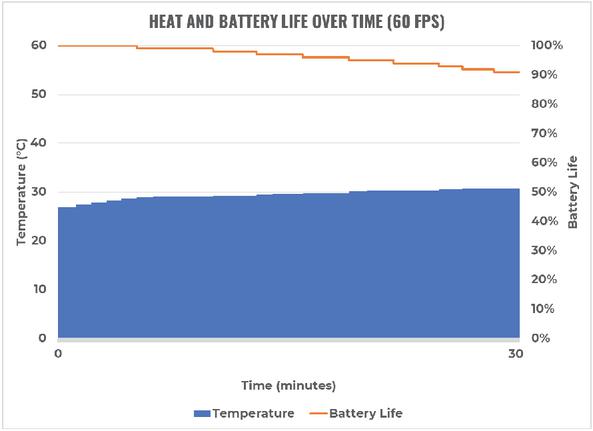
Figure 19 Heat and battery life of the OnePlus 3 over 30 minutes at 60 FPS.
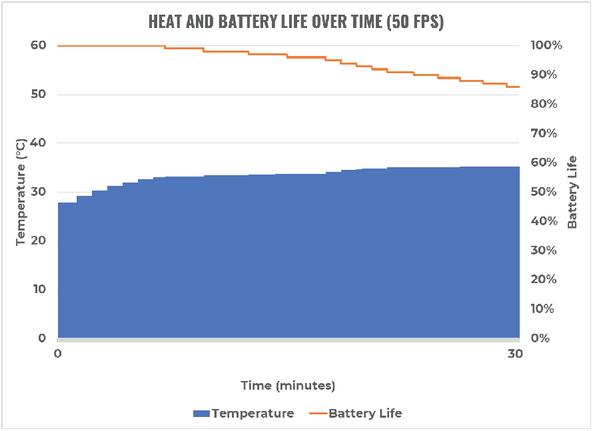
Figure 20 Heat and battery life of the OnePlus 3 over 30 minutes at 50 FPS.
The temperature rose by 3.9C with 60 FPS, whereas it rose by 7.5C at 50 FPS. As for battery levels, 60 FPS drained only 9% over 30 minutes, while 50 FPS drained 14%. The results might appear worrying for the lower frame rate, but this is not a major concern. The temperatures still remain lower than the typical limits of 60C. Similarly, even at its current rate of discharge, the battery would still last for more than 3 hours; it is unlikely that anyone will run a mobile VR app for this long. With these results, heat and battery levels should be adequately manageable when targeting 50–60 FPS.
5 Discussion
Taking into account the above evaluations, the research questions can now be answered.
RQ1: How does user-perceived lag vary among users for mobile VR apps?
Given that the refresh rate of displays on mobile devices is limited to 60 Hz, this results in a maximum achievable frame rate of 60 FPS for mobile VR apps. The user evaluations reveal that a minimum of 50 FPS is demanded for a comfortable mobile VR experience to reduce user-perceived lag. While going slightly below would still be tolerable by most users, this cutoff is immediately noticed (and frowned upon) by attentive users. For any given target FPS, the user-perceived lag did not differ across static versus dynamic content.
Interestingly, it is possible to mislead users into perceiving low-mid FPS as smooth (when they otherwise may have perceived them as laggy). Similarly, it is possible to mislead users into perceiving mid-high FPS as laggy (when they otherwise may have perceived them as smooth). Such outliers result from a relativity effect, where the immediately-preceding scene’s FPS rate plays an important role in determining the lag of the current scene. This has important implications for software developers when transitioning users between different scenes in the VR app.
Even with outlier FPS identified, the middle range of FPS (30–45 FPS) were still generally patchy in terms of users perceiving lag. Pilot testing suggested that the cutoff point resided between 30 and 35 FPS; most users were not able to differentiate the frame rates in this range, thereby resulting in somewhat random selections. This belief was further supported by the participants’ time to decide, as they generally took longer in the middle range. Considering the encountered outliers, and the general lack of no perceived statistically significant differences between the static and dynamic scenarios (Figure 6), equivalence classes of mobile VR lag can be identified:
• 5–25 FPS is considered unanimously laggy, and should be completely avoided.
• 30–45 FPS is considered tolerable by most users, but still laggy by sensitive users.
• 50–60 FPS is considered smooth, and developers should aim to always stay within this range.
RQ2: What software factors affect performance of VR apps deployed on mobile devices?
The benchmarks illustrated severe limitations facing mobile devices in allowing the delivery of realistic and detailed VR simulations. Software developers need to remain vigilant, recognising the wide variety of mobile devices with varying hardware capabilities. Even high performing mobile devices will quickly drop performance, well below the minimum frame rate of 50 FPS, as soon as many of the available VR settings are enabled. To counter this, software developers will need to keep the polygon counts very low. If also targeting medium-level mobile devices, avoid using any of the settings where possible. The good news is that heat and battery life are unlikely to be a problem, and rather the focus is on maintaining high FPS.
Threats to validity
A number of limitations exist. First and foremost, the pseudorandom ordering of the FPS scenes were intended to force participants to consider each FPS scene independently of their opinion of the immediat-ely preceding scene. Unfortunately, the history of the previous scene was shown to have an influence on the results—as noticed with some of the outlier results. This caused an unintended bias as participants rated some target FPS relative to another scene. Fortunately, the impact of this was consistent for all participants (since all participants were bound to the same ordering and therefore exposed to the same biases). This consequently led to other interesting lessons arising from the study, opening future research opportunities to further investigate this influence.
A total of 35 scenes (including three tutorial scenes) were presented to the users. As a result, maturation may have played a role in that some participants may have rushed their choices as they progressed through the evaluation. However, given the mean time to decide for each scene, it can be seen that participants required much less than 5 minutes to complete the entire evaluation. Although 51 participants were selected from three different engineering specialisations, an external threat to validity is that the results are not generalisable to the wider public. Contamination is always possible, in that some participants may not have been genuine in their responses. The instrumentation process may have also impacted the measured data, in that the actual FPS was accomplished (and validated) internally by the same VR app.
6 Conclusions
As VR becomes increasingly more viable for mainstream mobile market, an increasing number of mobile VR apps will be developed and released on the app stores. While this is exciting for many software developers, it is important to remember the severe limitations of mobile devices. This study found that 50 FPS is the lowest target frame rate that software developers should target, which is very close to the physical display limits of 60 FPS. This small window means that many of the typical settings in VR development engines need to be avoided, or at least carefully assessed. When developing future VR evaluations, an important consideration is to include a sufficient tutorial to allow for a period of adaptation for users.
Results show that no more than 500,000 polygons should be present in a mobile VR app scene at any time, and that this value should immediately half down to 250,000 if a combination of points lights and shadows are used. All post-processing effects (excluding depth of field) and anti-aliasing levels have the same performance impact as point lights. Settings such as ambient occlusion and depth of field should never be enabled under any circumstance due to their overwhelmingly negative effect on FPS. No concerns have been found regarding heat and battery life at recommended performance levels.
Although the most common software factors were benchmarked on mobile devices, additional resea-rch is needed to explore other aspects such as sounds, particles, animations, and optimisation techniques such as occlusion culling, field of view, and level of detail. Additionally, different software factors could be combined together to observe if this compounds the impact on performance. Also worth investigating is the plateau appears (around the one-million polygon mark) on every performance chart, regardless of the mobile device. Further research could also investigate biases that appear with when users are presented with FPS in various orderings.
Building on the unstable results, it would be valuable to determine the causes behind the somewhat jagged FPS performances for smartphones such as the Huawei Nova 3i and Samsung Galaxy A8. This issue limited the availability of generalising the effects of the VR settings to smartphones other than the OnePlus 3. It is anticipated that hardware factors such as CPU and GPU specifications are to blame, so research should start here. A final factor worth investigating is motion-to-photon latency; this effect is far less noticeable than frame rates, but should be tested regardless to see how this affects the mobile VR user experience compared to frame rates. A cutoff threshold for this metric could be determined by carrying out another user evaluation with varying latency between scenes.
References
[1] A. Nayyar, B. Mahapatra, D. Le, and G. Suseendran, “Virtual reality (VR) & augmented reality (AR) technologies for tourism and hospitality industry,” International Journal of Engineering & Technology, vol. 7, no. 2.21, pp. 156–160, 2018.
[2] G. Burdea and P. Coiffet, “Virtual reality technology. John Wiley & Sons,” Inc-1993, 1994.
[3] S. LaValle, Virtual Reality/University of Illinois. Cambridge University Press., 2017.
[4] R. A. Kramer, A. Y. Taikar, W. Paweenbampen, H. Alorayj, and S. T. Godambe, “The challenges and advances in mixed reality video technology,”
[5] M. Alcañiz, J. A. Lozano, and B. Rey, “Technological background of vr,” Cybertherapy, no. 10.3233/978-1-60750-943-1-199, pp. 199–214, 2004.
[6] M. El Beheiry, S. Doutreligne, C. Caporal, C. Ostertag, M. Dahan, and J.-B. Masson, “Virtual reality: Beyond visualization,” Journal of Molecular Biology, vol. 431, no. 10.1016/j.jmb.2019.01.033, pp. 1315–1321, 2019.
[7] Z. Tan, Y. Li, Q. Li, Z. Zhang, Z. Li, and S. Lu, “Supporting mobile vr in lte networks: How close are we?,” Proc. ACM Meas. Anal. Comput. Syst., vol. 2, apr 2018.
[8] G. Arrighi, Z. S. See, and D. Jones, “Victoria theatre virtual reality: A digital heritage case study and user experience design,” Digital Applications in Archaeology and Cultural Heritage, vol. 21, no. 10.1016/j.daach.2021.e00176, p. 176, 2021.
[9] M. Nagappan and E. Shihab, “Future trends in software engineering research for mobile apps,” in 2016 IEEE 23rd International Conference on Software Analysis, Evolution, and Reengineering (SANER), vol. 5, pp. 21–32, March 2016.
[10] R. Alturki and V. Gay, “Augmented and virtual reality in mobile fitness applications: a survey,” Applications of Intelligent Technologies in Healthcare, pp. 67–75, 2019.
[11] Y. Hu, J. Zhu, W. Li, Y. Zhang, Q. Zhu, H. Qi, H. Zhang, Z. Cao, W. Yang, and P. Zhang, “Construction and optimization of three-dimensional disaster scenes within mobile virtual reality,” ISPRS International Journal of Geo-Information, vol. 7, no. 6, 2018.
[12] L. Gugerty and G. Olson, “Debugging by skilled and novice programmers,” in Proceedings of the SIGCHI conference on human factors in computing systems, pp. 171–174, 1986.
[13] W. L. Johnson, “Understanding and debugging novice programs,” Artificial intelligence, vol. 42, no. 1, pp. 51–97, 1990.
[14] J. Martín-Gutiérrez, C. E. Mora, B. Añorbe-Díaz, and A. González-Marrero, “Virtual technologies trends in education,” EURASIA Journal of Mathematics Science and Technology Education, vol. 13, no. 2, pp. 469–486, 2017.
[15] D. Cearley and B. Burke, “Top 10 strategic technology trends for 2019.” https://www.gartner.com/doc/3891569. Accessed: March 2020.
[16] “Buy PS VR.” https://www.playstation.com/en-nz/explore/playstation-vr/buy-now. Accessed: March 2020.
[17] “Oculus Rift.” https://www.oculus.com/rift. Accessed: March 2020.
[18] “Buy VIVE hardware.” https://www.vive.com/nz/product. Accessed: March 2020.
[19] “HoloLens 2 pricing and options.” https://www.microsoft.com/hololens/buy. Accessed: March 2020.
[20] L. Avila and M. Bailey, “Virtual reality for the masses.,” IEEE computer graphics and applications, vol. 34, no. 5, pp. 103–104, 2014.
[21] J. M. Zelle and C. Figura, “Simple, low-cost stereographics: VR for everyone,” in ACM SIGCSE Bulletin, vol. 36, pp. 348–352, ACM, 2004.
[22] A. Amer and P. Peralez, “Affordable altered perspectives: Making augmented and virtual reality technology accessible,” in IEEE Global Humanitarian Technology Conference (GHTC 2014), pp. 603–608, IEEE, 2014.
[23] W. Powell, V. Powell, P. Brown, M. Cook, and J. Uddin, “Getting around in Google Cardboard–exploring navigation preferences with low-cost mobile VR,” in 2016 IEEE 2nd Workshop on Everyday Virtual Reality, pp. 5–8, 2016.
[24] B. S. Santos, P. Dias, A. Pimentel, J.-W. Baggerman, C. Ferreira, S. Silva, and J. Madeira, “Head-mounted display versus desktop for 3D navigation in virtual reality: a user study,” Multimedia Tools and Applications, vol. 41, no. 1, p. 161, 2009.
[25] J. R. Smith, B. Snapp, S. Madar, J. R. Brown, J. Fowler, E. Andersen, C. D. Porter, and C. Orban, “A smartphone-based virtual reality plotting system for stem education,” PRIMUS, no. just-accepted, p. 1, 2021.
[26] A. Agrawal, “Putting VR/AR to work,” IEEE Computer Graphics and Applications, vol. 38, no. 1, pp. 115–118, 2018.
[27] T. Wasserman, “Software engineering issues for mobile application development,” FoSER 2010, 2010.
[28] X. Ma, Z. Deng, M. Dong, and L. Zhong, “Characterizing the performance and power consumption of 3D mobile games,” Computer, vol. 46, no. 4, pp. 76–82, 2012.
[29] Z. Luo, H. Cho, X. Luo, and K.-i. Cho, “System thermal analysis for mobile phone,” Applied Thermal Engineering, vol. 28, no. 14-15, pp. 1889–1895, 2008.
[30] A. Prakash, H. Amrouch, M. Shafique, T. Mitra, and J. Henkel, “Improving mobile gaming performance through cooperative CPU-GPU thermal management,” in Proceedings of the 53rd Annual Design Automation Conference, p. 47, ACM, 2016.
[31] Z. Lai, Y. C. Hu, Y. Cui, L. Sun, N. Dai, and H. Lee, “Furion: Engineering high-quality immersive virtual reality on today’s mobile devices,” IEEE Transactions on Mobile Computing, pp. 1–1, 2019.
[32] S. He, Y. Liu, and H. Zhou, “Optimizing smartphone power consumption through dynamic resolution scaling,” in Proceedings of the 21st Annual International Conference on Mobile Computing and Networking, MobiCom ’15, (New York, NY, USA), pp. 27–39, Association for Computing Machinery, 2015.
[33] X. Chen, T. Tan, G. Cao, and T. F. L. Porta, “Context-aware and energy-aware video streaming on smartphones,” IEEE Transactions on Mobile Computing, vol. 21, no. 3, pp. 862–877, 2022.
[34] T. A. Funkhouser and C. H. Séquin, “Adaptive display algorithm for interactive frame rates during visualization of complex virtual environments,” in Siggraph, vol. 93, pp. 247–254, 1993.
[35] M. M. Wloka, “Lag in multiprocessor virtual reality,” Presence: Teleoperators & Virtual Environments, vol. 4, no. 1, pp. 50–63, 1995.
[36] S. Sharples, S. Cobb, A. Moody, and J. R. Wilson, “Virtual reality induced symptoms and effects (VRISE): Comparison of head mounted display (HMD), desktop and projection display systems,” Displays, vol. 29, no. 2, pp. 58–69, 2008.
[37] H. Khalid, E. Shihab, M. Nagappan, and A. E. Hassan, “What do mobile app users complain about?,” IEEE Software, vol. 32, no. 3, pp. 70–77, 2015.
[38] B. Fu, J. Lin, L. Li, C. Faloutsos, J. Hong, and N. Sadeh, “Why people hate your app: Making sense of user feedback in a mobile app store,” in Proceedings of the 19th ACM SIGKDD international conference on Knowledge discovery and data mining, pp. 1276–1284, ACM, 2013.
[39] “Optimisation for VR in Unity.” https://unity3d.com/learn/tutorials/topics/virtual-reality/optimisation-vr-unity. Accessed: March 2020.
[40] “VR performance best practices.” https://developers.google.com/vr/develop/best-practices/perf-best-practices. Accessed: March 2020.
[41] “CPU usage profiler.” https://docs.unity3d.com/Manual/ProfilerCPU.html. Accessed: March 2020.
[42] “CPU profiling.” https://docs.unrealengine.com/en-US/Engine/Performance/CPU. Accessed: March 2020.
[43] J. Ruan and D. Xie, “Networked vr: State of the art, solutions, and challenges,” Electronics, vol. 10, no. 2, 2021.
[44] K. Foo, “Understanding the VR potential of mobile devices: Literature review and statement of research intent,” 2019.
[45] Oculus, “Guidelines for vr performance optimization,” 2019.
[46] M. S. Elbamby, C. Perfecto, M. Bennis, and K. Doppler, “Toward low-latency and ultra-reliable virtual reality,” IEEE Network, vol. 32, no. 2, pp. 78–84, 2018.
[47] J. Zhao, R. S. Allison, M. Vinnikov, and S. Jennings, “Estimating the motion-to-photon latency in head mounted displays,” in 2017 IEEE Virtual Reality, pp. 313–314, 2017.
[48] S.-W. Choi, S. Lee, M.-W. Seo, and S.-J. Kang, “Time sequential motion-to-photon latency measurement system for virtual reality head-mounted displays,” Electronics, vol. 7, no. 9, p. 171, 2018.
[49] M. Meehan, S. Razzaque, M. C. Whitton, and F. P. Brooks, “Effect of latency on presence in stressful virtual environments,” in IEEE Virtual Reality, pp. 141–148, 2003.
[50] B. Conner and L. Holden, “Providing a low latency user experience in a high latency application.,” in SI3D, pp. 45–48, 1997.
[51] I. Tošić, D. Hoffman, and N. Balram, “Effect of latency on simulator sickness in smartphone virtual reality,” Journal of the Society for Information Display, vol. 29, no. 7, pp. 561–572, 2021.
[52] L. Rebenitsch and C. Owen, “Review on cybersickness in applications and visual displays,” Virtual Reality, vol. 20, 06 2016.
[53] G. Reina, H. Childs, K. Matković, K. Bühler, M. Waldner, D. Pugmire, B. Kozlíková, T. Ropinski, P. Ljung, T. Itoh, E. Gröller, and M. Krone, “The moving target of visualization software for an increasingly complex world,” Computers and Graphics, vol. 87, pp. 12–29, 2020.
[54] F. Salimi and F. Salimi, “Chapter 5 – modeling and simulation: The essential tools to manage the complexities,” in A Systems Approach to Managing the Complexities of Process Industries (F. Salimi and F. Salimi, eds.), pp. 279–407, Elsevier, 2018.
[55] D. Weidlich, L. Cser, T. Polzin, D. Cristiano, and H. Zickner, “Virtual reality approaches for immersive design,” CIRP Annals, vol. 56, no. 1, pp. 139–142, 2007.
[56] K. Debattista, K. Bugeja, S. Spina, T. Bashford-Rogers, and V. Hulusic, “Frame rate vs resolution: A subjective evaluation of spatiotemporal perceived quality under varying computational budgets,” Computer Graphics Forum, vol. 37, 09 2017.
[57] A. Mackin, F. Zhang, and D. R. Bull, “A study of high frame rate video formats,” IEEE Transactions on Multimedia, vol. 21, no. 6, pp. 1499–1512, 2019.
[58] K. Sekar, “Power and thermal challenges in mobile devices,” in Proceedings of the 19th annual international conference on Mobile computing & networking, pp. 363–368, 2013.
[59] Q. Xie, J. Kim, Y. Wang, D. Shin, N. Chang, and M. Pedram, “Dynamic thermal management in mobile devices considering the thermal coupling between battery and application processor,” in 2013 IEEE/ACM International Conference on Computer-Aided Design (ICCAD), pp. 242–247, IEEE, 2013.
[60] M. Pedram and S. Nazarian, “Thermal modeling, analysis, and management in VLSI circuits: Principles and methods,” Proceedings of the IEEE, vol. 94, no. 8, pp. 1487–1501, 2006.
[61] S. Wen, “Cell balancing buys extra run time and battery life,” Analog Applications Journal, vol. 1, 2009.
[62] W. Wang, V. Reddy, A. T. Krishnan, R. Vattikonda, S. Krishnan, and Y. Cao, “Compact modeling and simulation of circuit reliability for 65-nm CMOS technology,” IEEE Transactions on Device and Materials Reliability, vol. 7, no. 4, pp. 509–517, 2007.
[63] K. Y. Wong, “Cell phones as mobile computing devices,” IT professional, vol. 12, no. 3, pp. 40–45, 2010.
[64] Y. G. Kim, J. Kong, and S. W. Chung, “A survey on recent os-level energy management techniques for mobile processing units,” IEEE Transactions on Parallel and Distributed Systems, vol. 29, no. 10, pp. 2388–2401, 2018.
[65] M. Xia, W. He, X. Liu, and J. Liu, “Why application errors drain battery easily?: a study of memory leaks in smartphone apps,” in Proceedings of the Workshop on Power-Aware Computing and Systems, p. 2, ACM, 2013.
[66] R. Mittal, A. Kansal, and R. Chandra, “Empowering developers to estimate app energy consumption,” in Proceedings of the 18th annual international conference on Mobile computing and networking, pp. 317–328, ACM, 2012.
[67] A. Banerjee, L. K. Chong, S. Chattopadhyay, and A. Roychoudhury, “Detecting energy bugs and hotspots in mobile apps,” in International Symposium on Foundations of Software Engineering, pp. 588–598, 2014.
[68] K.-T. Cheng and Y.-C. Wang, “Using mobile GPU for general-purpose computing–a case study of face recognition on smartphones,” in International Symposium on VLSI Design, Automation and Test, pp. 1–4, 2011.
[69] R. S. Pressman, Software engineering: a practitioner’s approach. No. 007301933X, Palgrave macmillan, 2005.
[70] Y. Hu, J. Zhu, W. Li, Y. Zhang, Q. Zhu, H. Qi, H. Zhang, Z. Cao, W. Yang, and P. Zhang, “Construction and optimization of three-dimensional disaster scenes within mobile virtual reality,” ISPRS International Journal of Geo-Information, vol. 7, no. 6, p. 215, 2018.
[71] P. M. Isaacs, “Interactively reducing polygon count in three-dimensional graphic objects,” Apr. 13 1999. US Patent 5,894,308.
[72] G. Schaufler and W. Stürzlinger, “A three dimensional image cache for virtual reality,” in Computer Graphics Forum, vol. 15, pp. 227–235, Wiley Online Library, 1996.
[73] R. W. Latham, “If VR is so great, why are VR entertainment systems so poor?,” ACM SIGGRAPH Computer Graphics, vol. 28, no. 2, pp. 113–114, 1994.
[74] Y.-J. Tsai, Y.-X. Wang, and M. Ouhyoung, “Affordable system for measuring motion-to-photon latency of virtual reality in mobile devices,” in SIGGRAPH Asia 2017 Posters, pp. 1–2, 2017.
[75] R. Munro and J. Morgan, “Delay analyser.” https://csfieldguide.org.nz/en/interactives/delay-analyser. Accessed: March 2020.
[76] M. Cinelli, A. Patla, and B. Stuart, “Involvement of the head and trunk during gaze reorientation during standing and treadmill walking,” Exp Brain Res, vol. 181, no. 1, pp. 183–91, 2007.
[77] M. H. Draper, E. S. Viirre, T. A. Furness, and V. J. Gawron, “Effects of image scale and system time delay on simulator sickness within head-coupled virtual environments,” Human factors, vol. 43, no. 1, pp. 129–146, 2001.
[78] J. Treleaven, J. Battershill, D. Cole, C. Fadelli, S. Freestone, K. Lang, and H. Sarig-Bahat, “Simulator sickness incidence and susceptibility during neck motion-controlled virtual reality tasks,” Virtual Reality, vol. 19, no. 3-4, pp. 267–275, 2015.
Biographies

Zhong Wang is a Master of Engineering Student (Thesis-based) at the University of Auckland, New Zealand. His research interests are infrastructure project management via digital twin and decision-making systems assisted by data visualization techniques including Virtual Reality, Augmented Reality, and Mixed Reality.

Kenneth Foo is a final-year Bachelor of Engineering (Honours) student studying Computer Systems Engineering at the University of Auckland, New Zealand. His development interests include AI, machine learning, and virtual reality.

Steven Yan is a final-year Bachelor of Engineering (Honours) student studying Computer Systems Engineering at the University of Auckland, New Zealand. His development interests include neural networks, game development, and virtual reality.

Vicente A. Gonzalez is an Associate Professor in the Department of Civil and Environmental Engineering Department at the University of Auckland, New Zealand. His research interests are at the interface of construction engineering and management, and computer science focusing on lean construction, AI, computer simulation and modelling, mixed-reality and building information modelling.

Nasser Giacaman is a Senior Lecturer in the Department of Electrical, Computer, and Software Engineering at the University of Auckland, New Zealand. His disciplinary research includes parallel programming, with current research focusing on exploring software technologies for a number of different educational domains.
Journal of Mobile Multimedia, Vol. 18_6, 1561–1598.
doi: 10.13052/jmm1550-4646.1865
© 2022 River Publishers