Influence of Density on Throughput Performance in Cognitive Ultra-dense Networks
Antoni Ivanov*, Krasimir Tonchev, Pavlina Koleva and Vladimir Poulkov
Faculty of Telecommunications, Technical University of Sofia, bul. Kl. Ohridski 8, Sofia 1000, Bulgaria
E-mail: astivanov@tu-sofia.bg; k_tonchev@tu-sofia.bg; p_koleva@tu-sofia.bg; vkp@tu-sofia.bg
*Corresponding Author
Received 11 March 2022; Accepted 24 April 2022; Publication 25 August 2022
Abstract
Current advancements of Fifth Generation (5G) of mobile communications and beyond, have envisioned future networks as highly dense and coexisting in various bandwidths, providing seamless connectivity to users at any location. Thus, it is important to describe the effects and limits of densification and spectrum sharing. This article examines a less explored system model of a terrestrial cognitive radio (CR) based ultra-dense network (UDN) that operates within the range of a cellular macro base station (BS) and its users. It shares the incumbent spectrum in the interweave mode to avoid interference to the primary network, by implementing two common methods for energy detection (ED) spectrum sharing – Gaussian ED and Fading ED (FED). Through extensive simulations, the critical density of the UDN’s cognitive access points (CAPs), the ED efficiency, as well as the throughput gains, are determined through the measured signal-to-noise-ratio (SNR) at the CAPs and SUs. Additionally, the influence of different SU densification on the throughput is analyzed for the critical CAP density. It has been assessed that due to the high path loss in UDNs, the spectrum utilization gain (SUG) is small, but it may be improved through appropriate SU densification.
Keywords: 5G, densification, cognitive radio, energy detection, network coexistence, spectrum sharing, ultra-dense networks.
1 Introduction
Energy With the continual roll-outs of 5G networks all over the world, the development of diverse concepts and applications for wireless communications, has grown substantially. These research efforts have been motivated by the ever present spectrum utilization, throughput optimization and interference mitigation problems. The UDNs have been well established as an important scenario for user-centric wireless access (UCWA) in 5G and beyond [1–3]. The UCWA is achieved through the increased density of access point (AP) deployment over that of the user equipment (UE). Each UE may thus be served by multiple APs with small coverage area, while channels can be reused spatially between groups of APs due to the high path loss in such networks [4, 5]. The AP densification postulates advantages for more agile and reliable communications that provide uninterrupted connectivity [6] as well as challenges for efficient resource allocation. Additionally, the user association problem has become crucial to the network’s performance as with the dense deployment and high path loss, the gain between UE-AP pairs needs to be maximized. This includes the consideration that the number of associated APs also needs to be optimized, so the rest of them can be idle and conserve energy [1]. UDNs have been extended by the application of the CR technology, thus enhancing their potentials for spectrum utilization [1, 3, 7, 8]. Implementing the UDN nodes as CRs can facilitate their integration with legacy networks in the sub-6GHz range, which has also been shown to be significantly underutilized via multiple measurement campaigns [9–11]. Network coexistence in both the licensed and industrial, scientific and medical (ISM) bands is viable [12]. Moreover, the increased utilization of spectrum chunk can provide higher economic gain for the service provider to whom the spectrum is licensed to [13]. The densification of modern internet of things (IoT) and cellular networks and the proliferation of throughput-intensive applications additionally emphasize the need for efficient spectrum usage. CR has significantly advanced in the recent years to allow robust spectrum availability characterization so as to allow cognitive secondary user (SU) UEs to utilize frequency bands that are not used in a particular period of time [14]. It is the crucially important spectrum sensing function that is designed to accurately determine which portions of the spectrum are unoccupied (spectrum holes). Once this is done, the available resources may be distributed by the CAP to the SUs. Due to the rapid movement of both PUs and SUs, the spectrum holes are highly variable in time and frequency (the dependency of height is not considered because only ground-based communications are assumed in this work). This requires the spectrum sensing function to achieve both high detection accuracy and signal processing speed. As a consequence, the ED has been established as the most prominent spectrum sensing method. It does not require computationally intensive processing of the received signal because it only needs to estimate its current power level. Despite of its relative simplicity, it has been proven to yield promising results, if the decision threshold that determines the presence or absence of PU signal, is accurately estimated. This paper is an extension of the study [15] presented at the International Scientific Conference of Communications, Information, Electronic and Energy Systems (CIEES) 2021, considering even greater densification. It focuses on the influence of CAP and SU deployment density on the spectrum sensing performance and the SU potential throughput.
The rest of this paper is organized as follows. Section 2 provides a brief review of relevant works in the field. The system model on which the simulations are based, is described in Section 3. Then, the discussion on the simulation results is presented in Section 4. Finally, Section 5 gives the conclusion to this work.
2 System Model and Simulation Setup
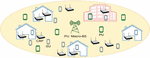
The system model, for which the experiments are performed, is as follows. A UDN operating on CR principles is deployed within the coverage region of a macro-BS that serves its own UEs that are PUs of the spectrum, divided into individual channels [7]. Figure 1 illustrates the simulation setup, with the macro-BS and its PUs and CAPs and their SUs (slightly smaller than the PUs in the illustration).
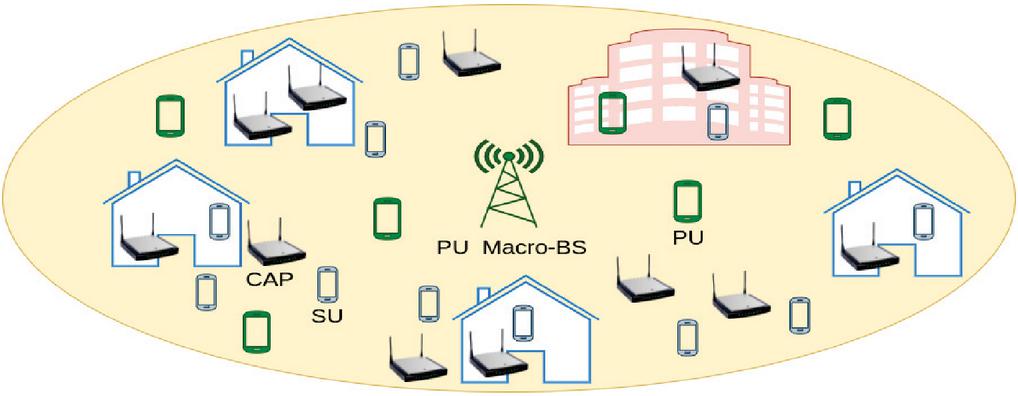
Figure 1 Simulation setup.
Each PU is assigned a random number of unique channels. The UDN’s APs operate in interweave mode and determine the available spectrum chunks that they can distribute to their users (the SUs). Each CAP is allocated two channels (of those unoccupied by the PUs) and serves exactly one SU, which has the smallest path loss between itself and the CAP. Consequently, each SU is served by exactly two particular CAPs, thus it is served on four channels in total. The constraint on the SU’s number of channels is imposed in order to reduce the interference within the cognitive UDN nodes, considering that over 50% of all channels will be allocated to the PUs. In other words, the probability of PU occupying a channel is:
| (1) |
where is the number of allocated channels for all PUs, and is the overall number of channels of the system. This probability remains constant throughout the simulation. The CAPs and all PUs and SUs are deployed via the Matern distribution as it utilizes the thinning process that disregards nodes that are within a certain minimum distance (for CAPs) and (for PUs and SUs) [16, 17]. It defines how close they can realistically be placed from each other. The main parameter of a Matern distribution is the average deployment density . The CAPs’ placement remains constant throughout the simulation, while the SUs and PUs change their location with a random speed in the interval of [0; 3 km/h] and angle between 0 and 2 PI, according to the random walk algorithm [18]. In the beginning of each iteration, the UEs move and the CAPs perform ED-based spectrum sensing by measuring the downlink (DL) signal-to-noise ratio (SNR) of the PU macro-BS on their assigned particular channels. The SNR at the CAPs is defined as follows:
| (2) |
where is the PU macro-cell transmission power per channel, is the noise power per channel, and is the noise figure for the CAP. The signal-to-interference-plus-noise (SINR) SU and potential throughput at the SUs are given as
| (3) | |
| (4) |
where is the CAP transmission power per channel, is the number of allocated channels for per SU, and is the noise figure for the SU. The SUG determines the benefit in terms of throughput, from applying the CR network in the incumbent spectrum. It is defined as
| (5) |
i.e. the sum of throughputs of SUs and PUs respectively, ( and ) over all iterations and simulation instances is taken. The two EDs assessed in this study are the standard Gaussian ED (GED) and the Fading ED (FED) [19]. The former assumes Gaussian distributions for the PU signal and noise, whereas the latter considers the influence of Rayleigh fading on the received signal. The probability of detection of the GED is defined as a function of the number of samples, and decision threshold (which depends on the noise level per bandwidth, and the probability of false alarm ). The of the FED can be described as a function of the same parameters, but offers greater agility as the threshold is also dependent on . The full expressions are omitted for brevity but can be found in [19].
3 Simulation Results
Two rounds of simulations are performed – the first determines the performance of the two types of EDs for spectrum sensing in the studied scenario, as well as the critical density of CAPs, while the second explores the influence of SU density on the throughput. The simulation parameters are as presented in Table 1.
Table 1 Simulation parameters
| Parameter | Value |
| 30 m | |
| 0.3 m | |
| Carrier frequency | 2 GHz |
| Overall bandwidth | 20 MHz |
| Individual channel width | 180 kHz |
| Spectrum sensing time | 0.5 ms |
| Sampling frequency | 360 kSps |
| Macro-BS transmission power | 43 dBm |
| CAP transmission power | 24 dBm |
| 53% |
A simulation region of 1 km is considered. A standard distance-dependent path loss model for cellular communications is used to compute the DL SNR of the PU macro-cell at the PUs and CAPs [20, 21]. The important probabilistic path loss model for UDNs, which considers both the line-of-sight and non-line-of-sight components of the received signal [4, 5] describes the channel between the CAPs and SUs. The parameters for each CAP/SU are averaged over 50 simulation instances, each comprised of 100 iterations (steps) during which the PUs and SUs are moving throughout the coverage area.
3.1 First Simulation Round – Critical CAP Density
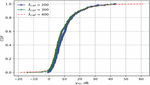
For this simulation round, the specific simulation parameters are as follows: , , and is changed to 200, 300 and 400. This analysis begins with the cumulative distribution function (CDF) of the SNR of the PU macro-BS at the APs (Figure 2). This dependency has three notable aspects. First of all, it is seen that comparatively very few measurements have less than 0 dB, that appear for , due to the increased number of CAPs that are located far from the PU BS. The CDFs for of 300 and 400 are roughly the same, with the latter showing some measurements that are much higher than the maximum values for the other two densities (i.e. between 43 and 62 dB). These measurements, however, are still much fewer than those in the interval of [0; 40] dB, which comprises the majority of the measured values. Lastly, it is also notable that some measurements in the interval of [7; 12] dB appear most often for the lowest density . This trait is also exhibited for between 0 and 7 dB but the difference is not very significant. Higher SNR levels (over 25 dB) are exhibited more often for because higher density also leads to more CAPs that are close to the PU BS. For the EDs, a of 0.1% is assumed.

Figure 2 CDF of the PU SNR for various .
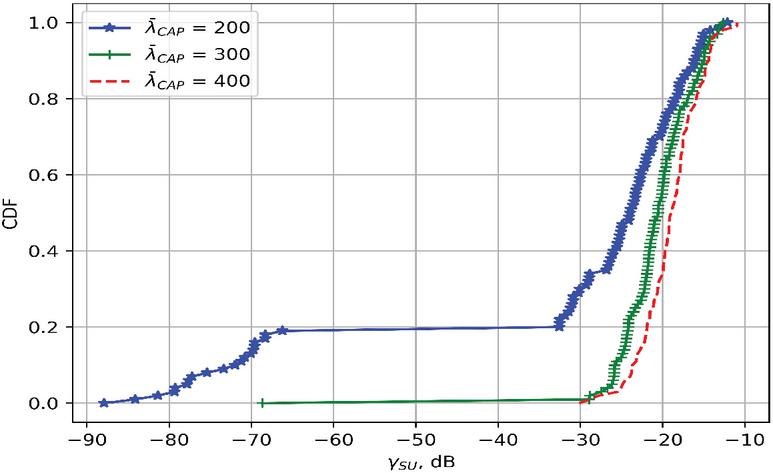
Figure 3 CDF of the SU SINR for various .
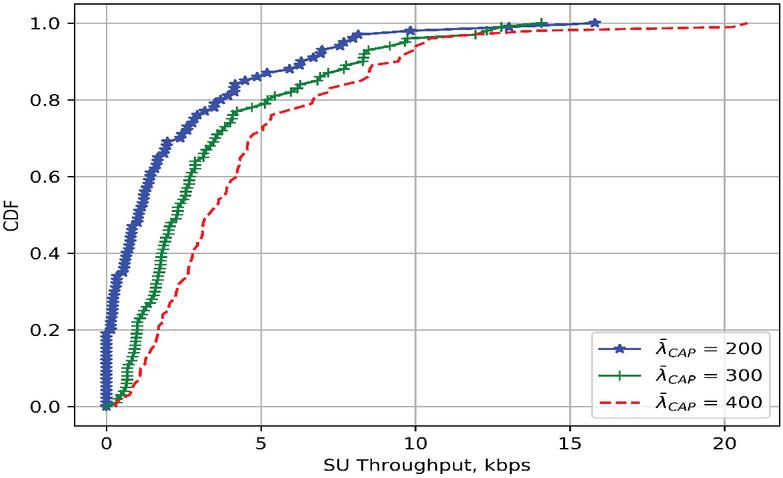
Figure 4 CDF of the potential SU throughput for various .
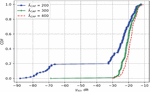
Greater clarity for the influence of the CAP density on the SU throughput is provided by the CDF of the measured AP SINR at the SUs (Figure 3) and that of their capacity (Figure 4). It is seen from Figure 3 that the number of measurements of lower than 25 dB is much higher for the lowest AP density (). About 20% of the measurements show dB. Thus, the CAPs are not deployed densely enough to provide good coverage in the conditions of the probabilistic UDN path loss model, which are much more challenging, than those of the traditional cellular propagation model. Consequently, the useful signal’s power diminishes very quickly, whereas the noise’s influence becomes stronger. In addition, there are limits on the CAP deployment imposed by the minimum distance between the CAPs themselves and the CAPs and the SUs (through the Matern distribution generation method), which underlines the need for the CAP critical density determination. For , the measured dB, with the CDFs differing from each other only slightly. Most of the measurements have values greater than 20 dB.
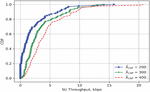
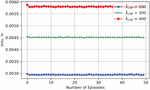
Naturally, the CDF of the individual SU throughput (Figure 4) follow the ones for . Due to the high path loss, they range up to no more than 21 kbps. The CDF of exhibits about 20% lower values for the majority of the measurements for . Due to the significant number of very low measurements, almost a fifth of all measured throughputs are very close to zero in this case. Most of the measured throughputs are below 5 kbps for all three CAP densities. It is also observed that for , few measurements that are much higher than the rest (reaching to over 20 kbps), are recorded. For at 300 and 400 the CDFs have about 10% difference for kbps. It becomes negligible for the throughputs above that range. Furthermore, from Figure 5, the SUG of the CR-based UDN as the simulation instances progress, in each case for can be assessed. First of all, it can be seen that these distributions are nearly constant because the SUs does not move at a very fast pace throughout the simulations’ runtime. Then, it is also notable that the SUG is very small (below 0.006%), which is accredited to the very high path loss between the CAPs and the SUs, in comparison to that between the macro-BS and the PUs. It is seen that there is a clear growth, though not very significant, in the SUG with the increase of .
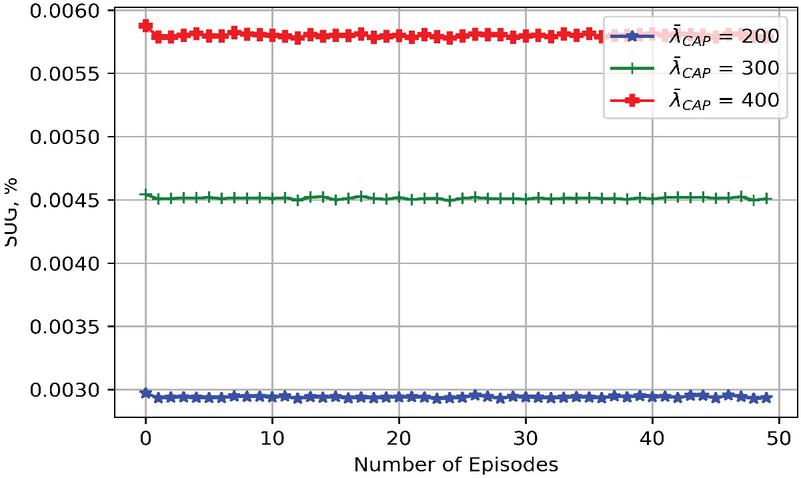
Figure 5 Spectrum utilization gain.
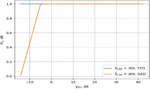
Considering these very slight gains, the increase of average CAP density to 400, which would involve the deployment cost and the UDN’s energy consumption, is not amply justified. Thus, the critical average CAP density for this scenario is determined to be 300. Exploring the of the two EDs in that case (Figure 6), it is observed that the FED performs better than the alternative, achieving probability of detection close to 100%. This can be explained by the more efficient SNR-based adaptive threshold determination in the FED, that accounts well for fading in the standard cellular path loss model, whereas the GED utilizes constant threshold value that depends primarily on the noise level and the predetermined . Thus, the GED is feasible (i.e. achieves over 90%) for higher than 5 dB, whereas the same is true for FED in the whole range. As observed from Figure 2, very few measurement samples have lower than 0 dB, which is a natural consequence of densification that locates more CAPs closer to the macro-BS, and of the more favorable propagation between the BS and the CAPs.
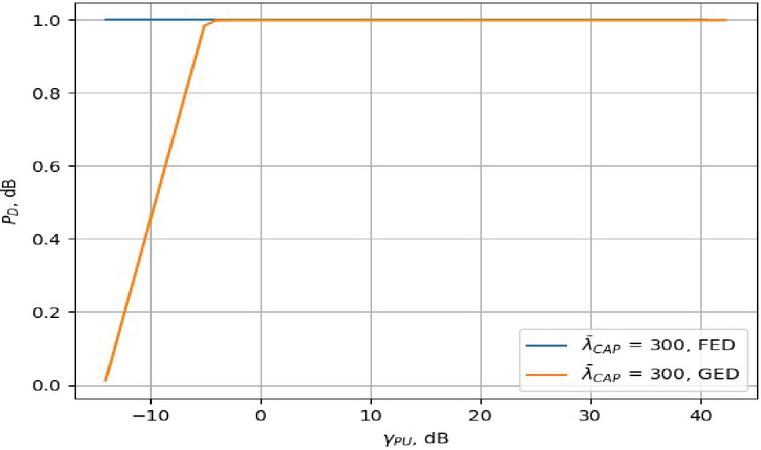
Figure 6 Probability of detection as a function of the PU SNR for the critical .

Figure 7 CDF of the PU SNR for various and the critical .
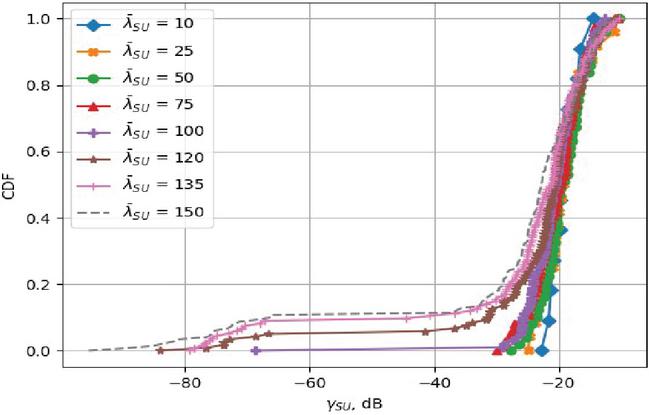
Figure 8 CDF of the SU SINR for various and the critical .
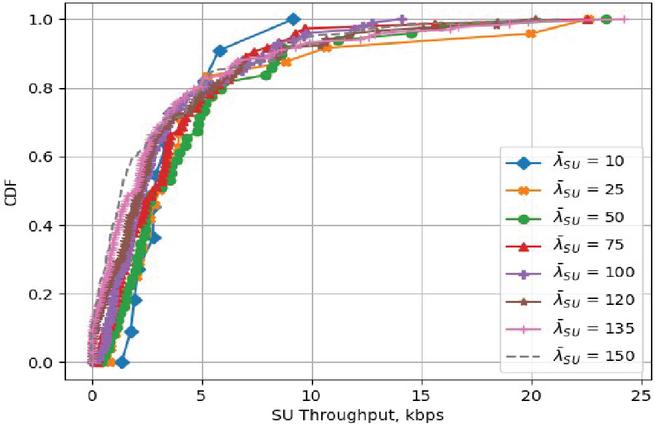
Figure 9 CDF of the SU throughput for various and the critical .
3.2 Second Simulation Round – SU Density Analysis
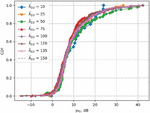
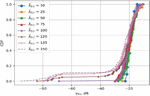
For this simulation round, the is set to be the critical density 300 as determined from the previous round, remains the same, and is changed among these two sets densities – 100, 120, 135, 150, and 10, 25, 50, 75. To analyze the influence of the SU density on the throughput in the same simulation setup, the CDFs of , and the SU throughput (Figures 7, 8 and 9, respectively). Starting from the measured PU SNR at the CAPs, it is observed that the CDFs have slight differences from each other for dB (Figure 7). There are, however, some measurements of dB for of 135 and 150, due to the slight increase of the number of CAPs, leading to stronger levels. For , SNR over 10 dB is measured with notably higher frequency. As the SU density declines, the number of channels available for PU usage in the interweave CR network, increases. Consequently, there is an increase in the measured SNR levels. Nevertheless, this dependency does not necessarily occur, as with the decrease of the number of SUs, there is lower probability that they will be served by CAPs that are close to the PU macro-BS. Thus, the high CAP densification yields substantial gains only when the SU density is appropriately large. As some examples observed in Figure 7, the CDFs for of 10, 25 and 75 do not show significant advantage over the other densities (there is a decline in frequency of measuring dB for , and the measured for only reaches up to 23 dB).
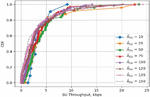
In contrast, the CDFs of the measured SINR at SUs (Figure 8) illustrates that for the whole range up to 20 dB, the decrease in leads to higher , although the changes between each two consecutive distributions, are only modest. Exception is made for 120 and 100 for dB, where a variation of as much as 20% can be observed. Moreover, this inverse dependency is not observed for over 20 dB, as the CDF for shows the best performance, even though it is only slightly higher than that of the rest. For of 10, 25 and 75, the improvements appear only sporadically, with the CDFs generally showing worse SINR measurements than those for of 50, 100 and more. These occurrences point to the uncertain probability for quality of service (QoS) improvement as decreases. In other words, there is no guarantee that for the CAP critical density, the decline in will yield more gains, as the SUs will not necessarily experience better channel conditions. Furthermore, with the limited number of available channels, the lower number of SUs will naturally lead to less interference. Nevertheless, the influence of this factor will not be very significant, as due to the high path loss model in UDN communications, the noise (which is not affected by the channel model) will retain its impact. These observations are corroborated by the CDFs of the measured SU throughput (Figure 9). For IN [0; 2.5] kbps, the throughput increases with the decline in . Then, the CDF for shows the best performance up until of 8 kbps when the results for become slightly better. This is due to some SINR measurements in the high levels (around 10 dB) for that density, as seen in Figure 8. Nevertheless, the CDF for reaches nearly 24 kbps together with the CDFs for higher than 100. Compared to Figure 4, it is seen that for of 50, 120, 135 and 150, there is a substantial increase of of up to 42% (for the critical CAP density).
4 Conclusions
This article presents an extensive simulation-based examination on the performance gains of an interweave cognitive UDN operating within the region of a PU macro-BS. The influence of CAP deployment density on the detection efficiency of two prominent EDs for spectrum sensing is analyzed, together with the throughput to determine the critical CAP density, which is 300 for this simulation. Then, conducting new experiments in the same environment with varying SU densities, the influence of on the throughput is characterized via the relevant parameters. Due to the high deployment density leading to favorable detection of the PU signal, the application of a simple spectrum sensing method such as GED or FED, has been shown to be very advantageous. A significant factor in UDN performance is the high path loss, which leads to relatively low SINR and throughput at the individual SUs, in comparison to that achieved by the PUs, and thus, the SUG is small. The second simulation round shows that even at the critical CAP density, the decrease in the number of SUs, does not necessarily lead to greater performance gain in terms of both PU signal reception and SU throughput. Consequently, the analysis presented in this paper can serve as a base for further study in the following aspects. Due to the high attenuation in UDNs, it may be beneficial to explore the application of underlay CR mode, and in this way, increase the availability of channels for SUs. Exploring CR-based network coexistence in ultra-dense unmanned aerial vehicle (UAV) communications has merit for further development of beyond 5G [22]. Furthermore, an advanced joint user association and resource allocation scheme for the CAPs and SUs can significantly increase the UDN’s throughput.
Acknowledgements
This work was supported by research project KP-06-N27/3/08.12.2018 “Resource self-configuration and management in ultra-dense networks with user centric wireless access” of the Bulgarian Research Fund of the Ministry of Education and Science.
References
[1] S. Chen, F. Qin, B. Hu, X. Li, Z. Chen, ‘User-centric ultra-dense networks for 5G: Challenges, methodologies, and directions’, IEEE Wireless Communications, pp. 78–85, 23(2), 2016.
[2] A. Gupta, R.K. Jha, ‘A survey of 5G network: Architecture and emerging technologies’, IEEE access, pp. 1206–1232, 3, 2015.
[3] F.H. Tseng, H.C. Chao, J. Wang, ‘Ultra-dense small cell planning using cognitive radio network toward 5G’, IEEE Wireless Communications, pp. 76–83, 22(6), 2015.
[4] 3GPP, ‘TR 36.828 (V11. 0.0): Further enhancements to LTE Time Division Duplex (TDD) for Downlink-Uplink (DL-UL) interference management and traffic adaptation’, 2012.
[5] AHG, S.C.M. Subsection 3.5.3, Spatial Channel Model Text Description V6.0, 2003.
[6] M. Agiwal, A. Roy, N. Saxena, ‘Next generation 5G wireless networks: A comprehensive survey’, IEEE Communications Surveys & Tutorials, pp. 1617–1655, 18(3), 2016.
[7] A. Ivanov, K. Tonchev, V. Poulkov, A. Manolova, ‘Framework for implementation of cognitive radio based ultra-dense networks’, In 2019 42nd International Conference on Telecommunications and Signal Processing (TSP) (pp. 481–486). IEEE, 2019.
[8] Z. Zhang, W. Zhang, S. Zeadally, Y. Wang, Y. Liu, ‘Cognitive radio spectrum sensing framework based on multi-agent architecture for 5G networks’, IEEE Wireless Communications, pp. 34–39, 22(6), 2015.
[9] M. R. Dzulkifli, M. R. Kamarudin, T. A. Rahman, ‘Spectrum occupancy at UHF TV band for cognitive radio applications’, In 2011 IEEE International RF & Microwave Conference (pp. 111–114). IEEE, 2011.
[10] K. Patil, R. Prasad, K. Skouby, ‘A survey of worldwide spectrum occupancy measurement campaigns for cognitive radio’, In 2011 International conference on devices and communications (ICDeCom) (pp. 1–5). IEEE, 2011.
[11] A. Fakhrudeen, O.Y. Alani, ‘Comprehensive survey on quality of service provisioning approaches in cognitive radio networks: Part one’, International Journal of Wireless Information Networks, 24(4), pp. 356–388, 2017.
[12] B. Chen, J. Chen, Y. Gao, J. Zhang, ‘Coexistence of LTE-LAA and Wi-Fi on 5 GHz with corresponding deployment scenarios: A survey’, IEEE Communications Surveys & Tutorials, 19(1), pp. 7–32, 2016.
[13] J.M. Peha, S. Panichpapiboon, ‘Real-time secondary markets for spectrum’, Telecommunications Policy, 28(7–8), pp. 603–618, 2004.
[14] M.S. Gupta, K. Kumar, ‘Progression on spectrum sensing for cognitive radio networks: A survey, classification, challenges and future research issues’, Journal of Network and Computer Applications, 143, pp. 47–76, 2019.
[15] A. Ivanov, V. Stoynov, D. Mihaylova, V. Poulkov, ‘Applicability Assessment of Energy Detection Spectrum Sensing in Cognitive Radio based Ultra-Dense Networks’, International Scientific Conference of Communications, Information, Electronic and Energy Systems (CIEES 2021), Ruse, Bulgaria, 25th–27th November 2021, accepted.
[16] Q. Zhu, X. Wang, Z. Qian, C. Tian, ‘Performance Analysis of an Intelligent Association Scheme in Ultra-Dense Networks Using Matern Cluster Process’, In 2019 IEEE/CIC International Conference on Communications in China (ICCC) (pp. 140–145). IEEE, 2019.
[17] S. Zhao, J. Zhao, H. Qu, G. Ren, ‘Analysis of User Content Retrieval Delay Based on the Matern Hard-Core Point Process of Type II’, Wireless Communications and Mobile Computing, 2018.
[18] 3GPP, ‘TR 38.901 (V14.0.0): Study on channel model for frequencies from 0.5 to 100 GHz (Release 14)’, March 2017.
[19] A. Kumar, P. Thakur, S. Pandit, G. Singh, ‘Threshold selection and cooperation in fading environment of cognitive radio network: Consequences on spectrum sensing and throughput’ AEU-International Journal of Electronics and Communications, 117, p. 153101, 2020.
[20] D. Zhao, H. Qin, B. Song, B. Han, X. Du, M. Guizani, ‘A graph convolutional network-based deep reinforcement learning approach for resource allocation in a cognitive radio network’, Sensors, 20(18), p. 5216, 2020.
[21] A. Goldsmith, ‘Wireless communications’, Cambridge university press, NY, USA, 2005.
[22] M.A. Jasim, H. Shakhatreh, N. Siasi, A. Sawalmeh, A. Aldalbahi, A. Al-Fuqaha, ‘A Survey on Spectrum Management for Unmanned Aerial Vehicles (UAVs)’, IEEE Access, 2021.
Biographies
Antoni Ivanov received the PhD degree in Communication Networks and Systems from the Technical University of Sofia (TUS), Bulgaria. He holds a Master degree in Innovative Communication Technologies and Entrepreneurship from TUS, and Aalborg University, Denmark in 2016. He is currently a Postdoctoral researcher at the “Teleinfrastructure Lab”, Faculty of Telecommunications, TUS. His research interests include cognitive radio networks, adaptive algorithms for dynamic spectrum access, deep learning-based solutions for cognitive radio applications, volumetric spectrum occupancy assessment, and graph signal processing for resource allocation in current and future wireless networks.
Krasimir Tonchev is a senior researcher leading the research activities at the “Teleinfrastructure Lab”, Faculty of Telecommunications, Technical University of Sofia, Sofia, Bulgaria. His research interests include Model Based Machine Learning, Bayesian data analysis and modelling, Neural Networks with applicatoins in Computer Vision and data analysis. He has also implemented many commercial projects including photogrammetry, object detecion and tracking using thermal vision, dynamic system modeling and image processing for embedded systems.
Pavlina Koleva received her M.Sc. and Ph.D. degrees in Telecommunications from the Technical University of Sofia, Bulgaria, in 2001 and 2013, respectively. Currently she is Associate Professor at the Faculty of Telecommunications. She has more than 15 years of teaching and research experience in the field of telecommunications. She has been involved in numerous projects, related to software design, development and support of various types of communication and data processing systems. Her main research interests are in Information Theory, Communication Networks, Game Theory, Cognitive networks, and Next Generation Networks, Big Data.
Vladimir Poulkov has received the M.Sc. and Ph.D. degrees from the Technical University of Sofia (TUS), Sofia, Bulgaria. He has more than 30 years of teaching, research, and industrial experience in the field of Telecommunications. He has successfully managed numerous industrial, engineering, R&D and educational projects. He has been Dean of the Faculty of the Telecommunications at TUS and Vice Chairman of the General Assembly of the European Telecommunications Standardization Institute (ETSI). Currently the Head of the “Teleinfrastructure” R&D Laboratory at TUS and Chairman of Cluster for Digital Transformation and Innovation, Bulgaria. He is Fellow of the European Alliance for Innovation; Senior IEEE Member. He has authored many scientific publications and is tutoring BSc, MSc, and PhD courses in the field of Information Transmission Theory and Wireless Access Networks.
Journal of Mobile Multimedia, Vol. 19_1, 29–46.
doi: 10.13052/jmm1550-4646.1912
© 2022 River Publishers