The Queue’s Automated Creation of Doctor’s Calls by Patients in the Hospital with Visualization via the Mobile Application
Iryna Zhuravska1,*, Mykhailo Dvoretskyi2, Inessa Kulakovska3, Anzhela Boiko1 and Svitlana Dvoretska2
1Department of Computer Engineering, Petro Mohyla Black Sea National University, Mykolaiv, Ukraine
2Software Engineering Department, Petro Mohyla Black Sea National University, Mykolaiv, Ukraine
3Department of Intelligent Information Systems, Petro Mohyla Black Sea National University, Mykolaiv, Ukraine
E-mail: iryna.zhuravska@chmnu.edu.ua; mykhaylo.dvoretskyy@chmnu.edu.ua; inessa.kulakovska@chmnu.edu.ua; anzhela.boiko@chmnu.edu.ua; svitlana.dvoretska@chmnu.edu.ua
*Corresponding Author
Received 15 March 2022; Accepted 05 September 2022; Publication 15 February 2023
Abstract
The spread of the COVID-19 virus is challenging society to provide medical care to a growing number of patients in the hospital. It is important to determine the patient from whom an urgent appeal was received earlier and to automate the creation of the calls’ queue. Determining the direction of the sound source, which is the patient’s voice, can be realized using the passive acoustic location method. In this case, it is necessary to place sound sensors in the wards with patients. In such a case, these sensors it is expedient to build in the lighting equipment executed in the shape of Platonic polyhedra. The microcontroller system, located inside such a spatial structure, ensures the transmission of sound to a server computer system. The above system alternately records the receipt of urgent appeals, analyzes the location of the sound source, and sends the relevant data to the doctor’s smartphone. The mobile application visualizes information about the location of the patients who need consultation or help. The proposed solution for intelligent analysis of voice appeals by inpatients may also be useful for post-stroke, post-infarction, and other bedridden patients who are unable to call medical staff otherwise than a voice.
Keywords: Automatic doctor calls’ queue, microcontroller system, Platonic polyhedra, determining the direction of the sound source, mobile application.
1 Introduction
To automate the construction of the queue of doctor calls from immobile patients in inpatient treatment, it is possible to identify and study objects as sound sources using the method of passive acoustic location (PAL) [1]. In this case, the location of the patient as a source of sound is determined by analyzing the ultrasonic waves (voice) emitted by him [2]. At the same time, the hosts of the computer network can be made as spatial structures based on a microcontroller system to which microphones or sound sensors are connected. Such devices can determine the exact or approximate location of the sound source based on the waves or time difference using the sound oscillation queues generated by the object (i.e., patient).
The object of research is the location of sound sensors in the spatial system of passive acoustic location. To determine the sequence of the response of sound sensors and create an appropriate queue of calls, it is necessary to calculate the vector of orientation to the source of sound vibrations while minimizing the number of calculations. The physical implementation of this PAL system can be carried out based on one of the Platonic polyhedra (abbreviated PP) [3].
Considering and analyzing these systems, the problem arises: how tightly should such speakers be located, and how many sound sensors should be connected to each of them for maximum system efficiency. Due to the need to deploy sometimes very extensive systems (with an increasing number of inpatients, for example during the COVID’19 epidemic), it is advisable to process data from a large number of sensors with different spatial coordinates using acoustic software and hardware complex (ASOHAC). It should be noted that the system of calling a doctor by voice may be the only one available for use by bedridden patients, for example, with damages of the cervical-thoracic spine [4]. The hardware solution of such an ASOHAC can be a microcontroller system based on a single-board computer Orange Pi PC Plus [5].
Implementation of the achievements of theoretical studies of automatic control [6] in the process of automated forming of the queue of medical personnel calls in hospitals will contribute to the improvement of the quality of service to patients in hospitals and, as a result, to a faster improvement of their health.
2 System Architecture and Proposed Solutions
The system architecture of the queue’s automated creation of doctor’s calls provides circulation and processing of uplink traffic (green line in Figure 1) from the patient to the sound sensor in the ASOHAC module built into the luminaire, traffic exchange between the ASOHAC modules and the server (yellow line in Figure 1), as well as downlink traffic to the mobile device of the doctor on which the call is distributed (brown line in Figure 1).
It’s possible using hybrid wireless communications to deliver a call from a patient to a doctor’s mobile device, taking into account the order of calls. A flexible hybrid optical-radio wireless network can be used depending on the mobile application requirements and the radio air condition and/or “Line of Sight” (LoS) availability. Among the radio technologies used to monitor the operation of sound sensors using mobile devices, the most common is Wi-Fi technology [7, 8]. The most promising light-based technology is visible light communications (VLC), where LED lamps provide both rooms with illumination and optical wireless communication [9].
It should be noted that after receiving a call on the doctor’s mobile device, for example, from the Dispatcher (see a brown line in Figure 1), the doctor should be able to discuss the details of the call using multimedia technology, such as video conferencing. For this purpose, it is necessary to distribute between the cores of the mobile device CPU the stream of calls and the stream of multimedia inside traffic [10, 11]. Taking into account the intensity of the formation of the call queue, it is necessary to control the loading of the processor of the mobile device so that incoming calls do not interrupt the doctor’s dialogue when providing a consultation using multimedia, including video conferencing [12]. In this, the development of a graphic representation of the existing call queue in multimedia devices is extremely important [13]. It is advisable to duplicate the indicated graphical representation with a voice assistant, solving communication problems in conditions of a poor Internet connection, using the methodology described, for example, in [14]. Thus, we conclude that the methods proposed in this article for forming a queue of requests for medical care can be extended to remote care for patients undergoing treatment/rehabilitation in individual (home) conditions [15].
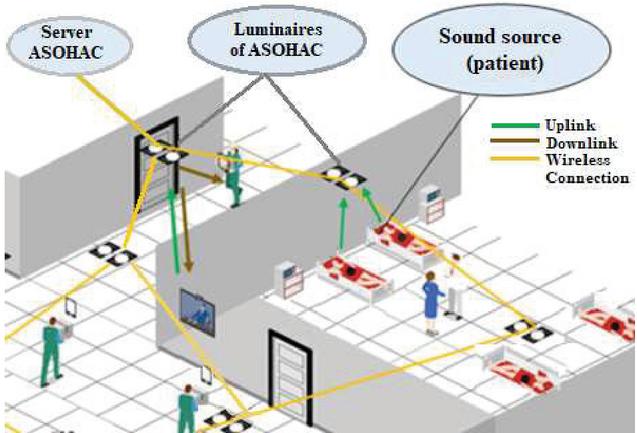
Figure 1 Data traffic and infrastructure of the patient care system in the hospital.
The number of sound sensors embedded in the luminaire is determined by the appropriate from 3 to 20. The question arises at what distance and at what coordinate position relative to the ASOHAC central unit should be placed sound sensors.
The relative position of the minimum number of three sound sensors is considered uniform and is shown in Figure 2. We will assume that microphones are fixed at base points with known coordinates, and the sound emitted by the object (patient) can be recorded by at least part of the microphones. Depending on the relative position of the object and the microphones, the emitted sound signal falls on different microphones with different time delays [16].
Let’s analyze the distance at which:
• Sound sensors can be spaced from the central unit of the PAL system;
• It is possible determining the presence of an audio source using sensors designed to embed in ASOHAC.
It should be noted that the issue of spatial placement of PAL sound sensors should be addressed separately for two-dimensional (2D) and three-dimensional (3D) space. The most common and studied application of this method in the military field for determining the location of artillery and small gun arms after firing from it [17].
At present, it’s created a powerful mathematical apparatus for calculating the coordinates of the sound source for three or four microphones [18]. Modern research is aimed at simplifying the calculation algorithm for the location of the sound source and determining the number of sensors needed to calculate the distance to the sound source [19]. The results of the research show that the use of a single microphone will provide only a rough estimate of the acoustic signal. Therefore, to increase the accuracy of the bearing and/or to determine the directional vector of the source of acoustic oscillations developed designs of acoustic gratings of microphones, which also allow estimating the time of arrival of the wavefront in different nodes (sound sensors or microphones) of such a lattice [20]. Modern devices use gratings with 4–12 microphones at distances of 10–30 cm. This solution reduces the error of determining the sound source by almost 6 times (from 100 m to 15 m). But a significant disadvantage of this design is that the sound sensor is used to determine the direction of arrival of the sound wave from the “front side” of such a construction. At the same time “rear site” of such a launcher – with the microphones lined up – is a “blind spot” (Figure 2, a, b).
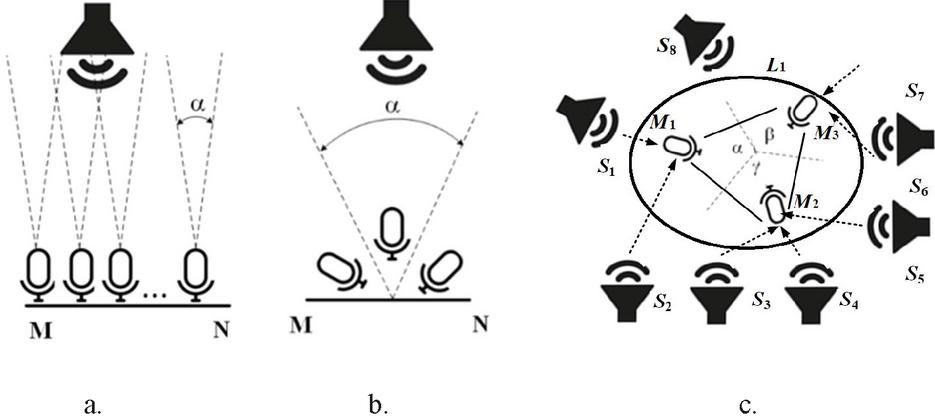
Figure 2 Examples of possible locations of sound sources and sensors on a plane with a linear (a) or spatial (b) arrangement with a coverage angle of 180 and with the placement of sensors in 3D space (c).
In the mathematical model of the proposed system of building queues, pulse emission of sound by the object (patient) has assumed. The validity of such a choice has been explained precisely by the fact of the call of the personnel, that is, by a one-time or repeated discrete action. In this case, the arrival time of the pulse on different sensors can be fixed.
In the case of continuous sound emission (if the patient’s bed is equipped with some kind of device for calling medical personnel according to the type of continuous signal “Alarm”), correlation methods for determining the delay of signals can be used.
As the number of microphones increases, it is advisable to consider not the linear but the spatial location of the microphones. One of the effective constructions can be considered the military system of gunshot detection “Boomerang” (Figure 3, a) [21], in which the grille of 7 microphones is implemented as two separate structures, which respectively consist of 3 (Figure 3, b) and 4 microphones (Figure 3, c) separated one from the other spatially.
At the same time, such constructive solutions should be used to solve similar problems in civilian areas, including in determining the direction and coordinates of the sound source in hospitals (voice, moan, etc.).
If the sensors (microphones) are located in a plane in the shape of a right triangle, then based on only a fixed time it is possible to determine the sector of 60 degrees in which the sound coming from. Then it is possible to find 2 points in this sector, one of which is the desired sound source.
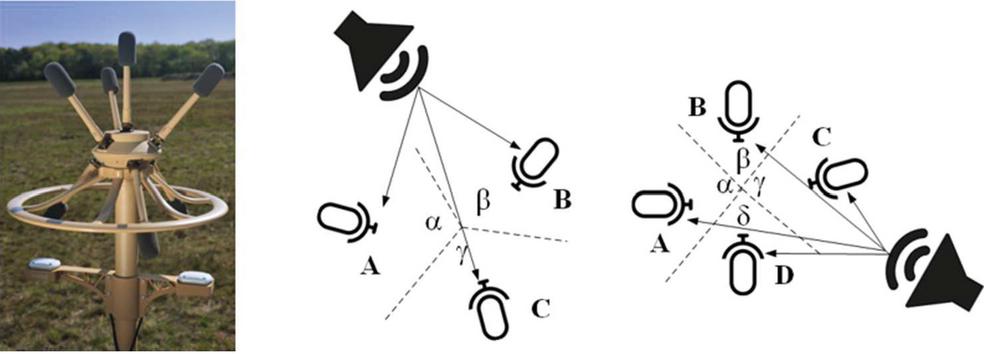
Figure 3 3D placement of the 7-sensor system of passive acoustic location “Boomerang”.
We present an extension of the sound source localization approach. In the proposed solution, the nearest sensor M, embedded in the luminaire L, first detects the sound from the source S and sends to the ASOHAC the time of the sound signal receiving and the coordinates (x, y) of the source Spatient in need of help and doctor). It should be noted that the number of sound sensors at the vertices of the luminaire does not have to be equal to the number of patients in the ward (see Figure 2, c). For any number of sensors, the appearance of the sound wave is registered only by the sensor M, closest to the source S. The construction of ASOHAC is considered expedient when , i. e., the number of sensors m in the luminaire L is equal to the number of patients n in the ward; then the call from is registered by the sound sensor M.
Regarding the possible effect of reflected sound from room walls on the operation of the ASOHAC detection system, consideration should be given to the absorption coefficients of common building materials and finishes used in medical facilities. More specifically, when reflected from painted walls and plasterboard (as basic in hospitals), the sound intensity is reduced by the coefficient of 0.10.29 [22]. In addition, the scattering of sound on uneven and inhomogeneous boundaries of the medium also leads to a decrease in the intensity of sound pressure. Due to scattering and absorption, the sound intensity decreases with distance according to the exponential law e, where d is the coefficient of sound attenuation. In this case, the intensity of the reflected sound signal is beyond the threshold for adjusting the sensitivity of the used sound sensors and cannot cause another, duplicating, voice call to appear.
It allows for detecting a speaker due to segmenting speech input. To speed up processing with high accuracy, it is advisable to use hardware systems that consist of several arrays of microphones [23]. In our case, it is necessary to use not luminaires, and “chandeliers” (i. e., “pendant lights”), each of which has more microphones. At the same time, neither the microphones inside the chandelier nor the chandeliers themselves should be placed too close to each other to avoid interference of signals from neighboring objects and as a result of noise in the data traffic [24].
In any case, when generating a sound that is louder than the set threshold, each of the sensors located at a known equal distance from neighboring sensors will notify ASOHAC via a communication line, for example, based on Orange Pi, of the receipt of a sound signal (Figure 4).
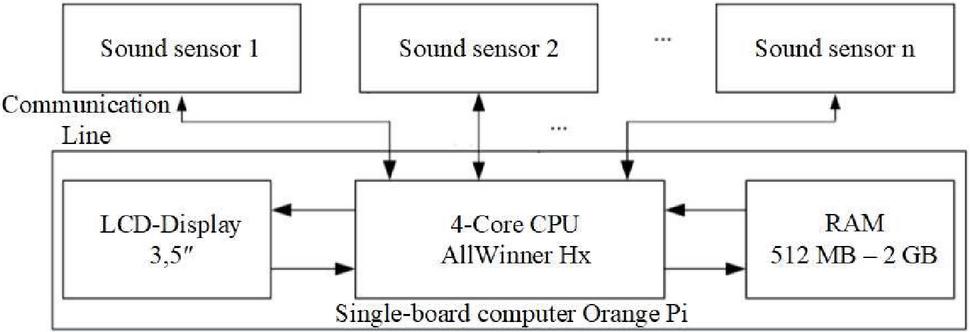
Figure 4 Block diagram of a multi-sensor system of passive acoustic location.
The memory of the specified minicomputer will store the time of receiving the audio signal to the nearest microsecond for each of the sensors [25]. In this way, it will be known which of the sensors and when it recorded the sound. After processing the passive acoustic location algorithm, the data on the directional vector of the sound vibration will be displayed on the LCD display and/or on the mobile device using the developed software application.
Sensors are controlled by special programs from the Orange Pi controller or other microprocessor control device [26]. The module consists of a microphone and a potentiometer that allows you to adjust the sensitivity of the sensor.
If the number of sensors does not correspond to the number of vertices of a regular polygon and it is impossible to build a lattice with equally spaced nodes, you should follow the convex configuration of the polygon formed by spaced sound sensors. In any of these cases, the sphere can be circumscribed around all sensors, and the distance between a pair of adjacent sensors is always the same within each of the resulting spatial bodies.
2.1 Spatial Location of System Sensors of the Calls Queue’s Creation based on Passive Acoustic Location
It should be noted that the case of determining the location of the sound source with a set of microphones significantly increases not only the accuracy but also the computational complexity of the problem. A significant reduction in the computational complexity of this problem can be achieved if you place the sensors on the vertices of the so-called Platonic polyhedra – regular polyhedrons [27].
There are a total of five three-dimensional Platonic polyhedra (PP): Tetrahedron, Hexahedron (Cube), Octahedron, Icosahedron and Dodecahedron [28]. In this case, according to Euler’s theorem for convex polyhedra, we derive the equation for finding the number of sound sensors embedded in ASOHAC (numbers of vertices):
| (1) |
where V – numbers of vertices of PP; E – numbers of edges; F – numbers of faces. The results of calculating the numbers of sound sensors are given in Table 1.
Table 1 Numbers of sound sensors (vertices) for each Platonic polyhedra
| Type of Platonic polyhedra | Edges (E) | Faces (F) | Vertices (V) |
| Tetrahedron | 6 | 4 | 4 |
| Hexahedron (Cube) | 12 | 6 | 8 |
| Octahedron | 12 | 8 | 6 |
| Icosahedron | 30 | 20 | 12 |
| Dodecahedron | 30 | 12 | 20 |
This arrangement gives the same distance (edge length of a regular polyhedron) between adjacent sensors (located in the vertices of PP), which greatly simplifies the calculation.
The most interesting option is the design in the so-called form factor “pendant light” or “luminaires” (Figure 5), as it allows combining several functions within one device: lighting, lighting control system, and the direction of a sound source.
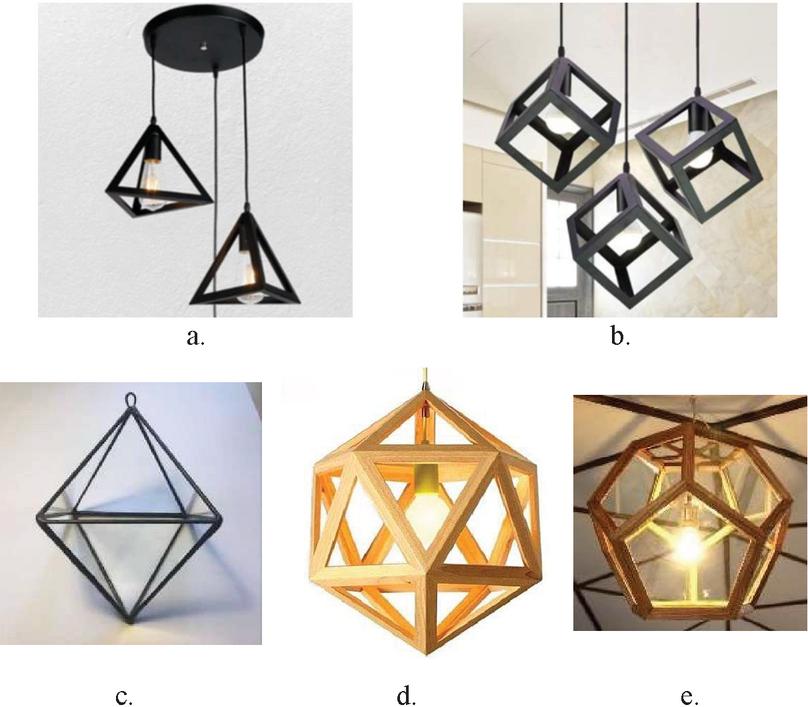
Figure 5 Luminaires in the shape of Platonic polyhedra: a – tetrahedron; b – hexahedron (cube), c – octahedron; d – icosahedron; e – dodecahedron [29–33].
The frame of the luminaire can be wooden, made of a metal profile, or printed on a 3D printer of ABS plastic (Figure 6, a). In a vertex (Figure 6, b) of such luminaire in the shape of PP a sound sensor is mounted, for example, GY-MAX4466 (Figure 6, c), KY-037(038) or any sound sensor for Arduino, Raspberry Pi, Orange Pi, etc. [34, 35]. The main thing is that the thickness of the frame does not exceed 10 mm (microphone height above the sensor board).
The graphic model of the designed construction was made using the modern professional 3D modeling package 3Ds MAX 2022 from Autodesk. Autodesk provides educational institutions with a free educational license for 1 year [36]. This software has powerful and flexible tools for constructing simple and complex geometric objects. 3Ds MAX 2022 is a convenient editor for creating materials of any complexity, provides significant opportunities for working with light, a modern and high-quality visualization system.
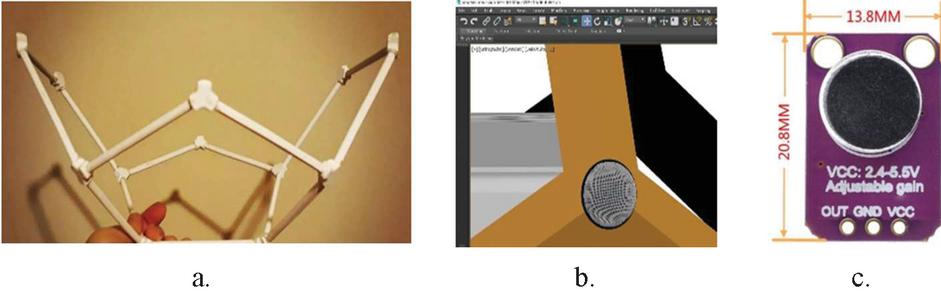
Figure 6 The frame of the luminaire in the shape of a dodecahedron (a) with embedded in the vertex (b) sound sensor (c).
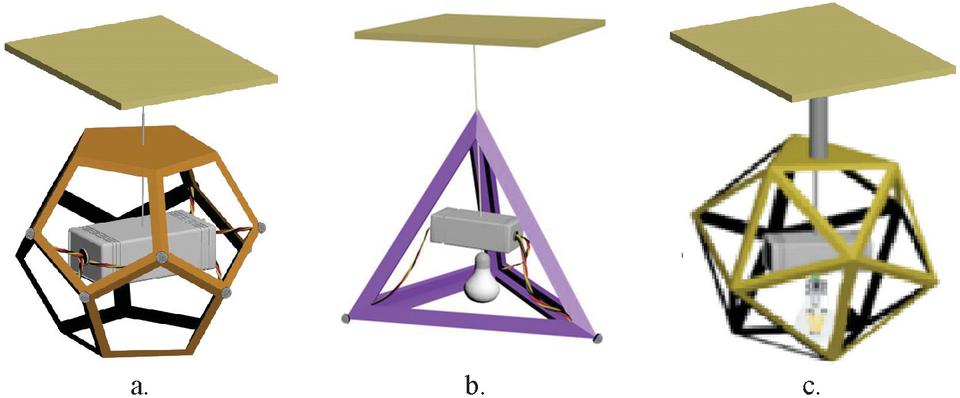
Figure 7 3D model of a luminaire in the shape of a dodecahedron with sound sensors embedded in some vertices (a), and luminaire in the shape of a tetrahedron (b) and the icosahedron (c) with an implemented unit of microcontroller system and light bulb inside the construction.
The ASOHAC kit is integrated (“hung from”) into the construction of the PP mold so that the wires from each sensor converge in the center of the sphere circumscribed around the PP, where the microcontroller unit is physically located (Figure 7, a). In this case, the length of all wires is considered to be the same, and their capacity equally affects the result of signal processing from each sensor.
Since such construction is also used for lighting, the power cord for the light bulb, located under the body of the ASOHAC kit, passes together with the ASOHAC power cord, then through the ASOHAC body. Given that the ASOHAC kit is located inside the sphere circumscribed around the PP, the lighting system is allocated about half of the pendant light construction (Figure 7, b). In this case, it allows using LED light bulbs of any power under a usual socle E26/E27 [37].
It should be noted that according to the international standard the minimum level set of the illuminance in healthcare – wards should be no less 200 Lux [38]. In this case, the selection of the model and the number of lamps in the lamp should be made on the basis of the luminous flux characteristics of the lamp in lumens (Lumen) and the radius of the sphere described around the lamp. Taking into account the selected model of the lamp [37], the calculations showed that to ensure compliance with the lighting standards, it is enough to install one LED light bulb of the specified type in any of the designs of luminaires in the shape of Platonic polyhedra (Figures 5 and 7).
To increase the energy efficiency of the proposed solution, it is possible to use the different values of the standards for lighting in hospitals premises (according to their functionality) from 5 Lux to 1000 Lux during the day and at night as specified in the Ukrainian DBN V.2.5-28:2018 “Natural and artificial lighting”, Table 8.41 [39]. In this case, it is advisable to use dimmers for halogen and incandescent bulbs with appropriate operating voltage [40].
One of the most complex Platonic polyhedra is the dodecahedron, in the vertices of which it is possible to place the largest number of sound sensors – 20. Then the ratio of the distance between the sensors, equal to the length of the edges d of the dodecahedron, and the radius of the circumscribed sphere R is d : R 1.176 : 1.118, as proved by Euclid and calculated in the paper [41]. Based on this, it is possible to calculate the ratio of the distance between the sound sensors and the ASOHAC overall dimensions (Table 2). It should be noted that for maximum lighting the cage size must be 7 inches 6 inches. Thus, the distance from the sensors in this construction is from 15 cm to 50 cm.
Table 2 Overall dimensions of the microcontroller system of passive acoustic location based on Platonic polyhedra
| DistanceBetween theSound Sensors2d, In Centimeters | Number of Sensors | The Shape of the Hardware of the ASOHAC Kit (Type of Platonic Polyhedra) | The Radius of the Sphere Around the Hardware of the ASOHAC Kit R, In Centimeters | The Volume of the Hardware of the ASOHAC Kit V, In Cubic Meters |
| 50 | 4 | tetrahedron | 30 | 0,015 |
| 8 | hexahedron (cube) | 43 | 0,125 | |
| 6 | octahedron | 35 | 0,059 | |
| 12 | icosahedron | 47 | 0,273 | |
| 20 | dodecahedron | 70 | 0,958 | |
| 40 | 4 | tetrahedron | 24 | 0,008 |
| 8 | hexahedron (cube) | 35 | 0,064 | |
| 6 | octahedron | 28 | 0,030 | |
| 12 | icosahedron | 38 | 0,140 | |
| 20 | dodecahedron | 56 | 0,490 | |
| 30 | 4 | tetrahedron | 18 | 0,003 |
| 8 | hexahedron (cube) | 26 | 0,027 | |
| 6 | octahedron | 21 | 0,013 | |
| 12 | icosahedron | 29 | 0,059 | |
| 20 | dodecahedron | 42 | 0,207 | |
| 20 | 4 | tetrahedron | 12 | 0,001 |
| 8 | hexahedron (cube) | 17 | 0,008 | |
| 6 | octahedron | 14 | 0,004 | |
| 12 | icosahedron | 19 | 0,017 | |
| 20 | dodecahedron | 28 | 0,061 | |
| 15 | 4 | tetrahedron | 9 | 0,001 |
| 8 | hexahedron (cube) | 13 | 0,003 | |
| 6 | octahedron | 11 | 0,002 | |
| 12 | icosahedron | 14 | 0,007 | |
| 20 | dodecahedron | 21 | 0,026 |
Table 3 Overall dimensions of pendant light in depending on the area of the premises
| Room (Ward) Area | Diameter of Pendant Light |
| up to 10 m | up to 40 cm |
| from 10 to 20 m | from 40 to 60 cm |
| from 20 to 30 m | from 60 to 75 cm |
| from 30 to 40 m | from 90 cm |
The ratio of the size of the chandelier and the parameters of the room can be calculated based on the lighting standards given in ISO 8995, depending on the type of premises, spaces, and activities [42]. The results of calculations for medical facilities are given in Table 3.
Given the fact that in hospitals and other public institutions with an area of 20–80 square meters luminaires with a radius of up to 30–60 cm (i.e., 12–24 inches) are used, ASOHAC kits with similar dimensions (up to 30 cm 20 cm 10 cm) can be built into their construction. For larger rooms, it is advisable to install several luminaires of the above sizes. In addition, the length of the wires from the sound sensor to the APAC kit can be reduced according to the size of the luminaire, but not less than the housing for the microcontroller system (minimum 6 cm).
2.2 Mathematical Model of Spatial Passive Acoustic Location System Based on Platonic Polyhedra
To ensure the alternate care of patients who made a voice call to the doctor, it is necessary to determine the coordinates (, ) of the i-th sound source S from the total number of m sources (, where m is the number of patients in the ward), the acoustic signal from which came to the nearest microphone M from the total number of n microphones (, where n is the number of microphones), built into the spatial construction (“pendant light”), having the shape of one from Platonic polyhedra.
Consider the case where the spatial construction is a tetrahedron with 3 sensors in the plane, forming a right triangle with a known side length. Schematically it will look like this. Each of the sensors T will have its designation. For example, T is named as A, T is named as B, T is named as C (Figure 8).
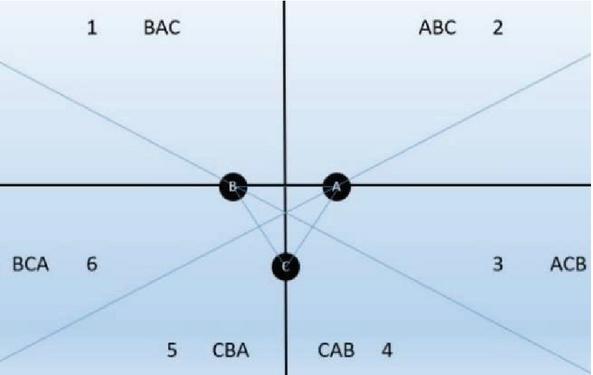
Figure 8 Placement of sensors in a regular triangle in a spatial pendant light designed in the shape “Tetrahedron”.
Denote the distance between the sensors 2d. Then the vertices’ coordinates of the tetrahedron base are , , . Let us denote the time of signal receipt so that (in seconds). In the general case, the coordinates of the location of sound sources can be calculated by measuring the sensors’ response time according to the numbering of the areas of sound origin, shown in Figure 9. The sets of values are given in Table 4.
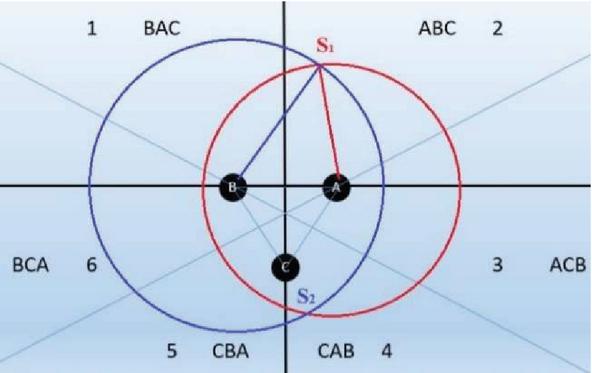
Figure 9 Determination of values sets for the coordinates of the location of sound sources when they are registered by sensors of the spatial luminaire type of “Tetrahedron”.
Table 4 Order of the sensors’ response
| Valid | ||||
| Designation | Designation | Area Number | Coordinates | |
| of the Sensor | of the Sensor | Where the Sound | Positive or | |
| That | That | is Coming | (Negative) | |
| Responds First | Responds Second | From | ||
| A | B | 2 | ||
| A | C | 3 | ||
| B | A | 1 | ||
| B | C | 6 | ||
| C | A | 4 | ||
| C | B | 5 |
For sound coming from the 1st area (BAC) shown in Table 4, it is possible to determine the distances traveled by sound to the sensor, according to formulas (2). The time of receipt of the signal is such that .
| (2) | ||
At these distances from the sensors, it’s needed to find the points’ set of the circles with corresponding radii SA, SB, and SC. There are two points of two circles’ intersection under these conditions – S and S (Figure 10). However, taking into account the order of the sensors’ response, we are interested in only one point – S, from the relevant area. Therefore, in the subsequent calculations, we consider only it as S.
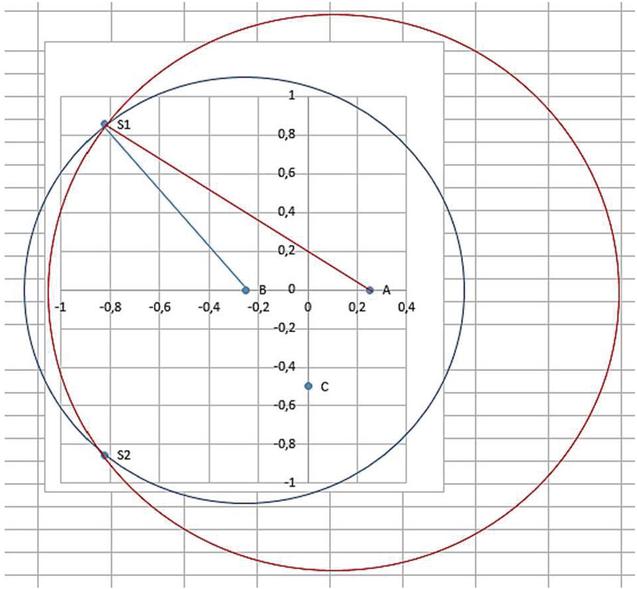
Figure 10 Determining the points of intersection of two circles for the 1st area where the sound is coming from.
The calculations are applicable for the value of the speed of sound is 343 m/s in dry air at C (68F), which has recommended by the Centers for Disease Control and Prevention controlled by the U.S. Department of Health, for healthcare facilities for patient comfort, staff efficiency [43]. Speed of sound vs. Temperature for the range to t 25C recommended for healthcare in the coldest [44] and warmest [45] regions of the world changes by no more than 1% (346 m/s). So, the effect of temperature on the speed of sound was not considered in the mathematical calculations of the article.
To calculate the exact coordinates, we solve a system of Equations (3):
| (3) |
Then, it’s needed to subtract the second from the first equation of the system (3) and reduce the squares of the unknown variables:
Thereafter, . For area “1” we are interested in a positive value of y, shown in Table 5. In Table 5 and in the following, as well as in Table 2, “2d” denotes the distance between the sound sensors in PP.
Table 5 Coordinates of the sound source’s location for the 1st area of sound origin
| 2d, | d, | t, | t, | t, | S, | S, | ||
| In | In | In | In | In | In | In | ||
| Meters | Meters | Seconds | Seconds | Seconds | Meters | Meters | x | y |
| 0.5 | 0.25 | 0.0032 | 0.003 | – | 1.098 | 1.029 | 0.146 | 1.024 |
| 0.4 | 0.20 | 0.0032 | 0.003 | – | 1.098 | 1.029 | 0.182 | 1.029 |
| 0.3 | 0.15 | 0.0032 | 0.003 | – | 1.098 | 1.029 | 0.243 | 1.025 |
| 0.2 | 0.10 | 0.0032 | 0.003 | – | 1.098 | 1.029 | 0.365 | 0.994 |
| 0.15 | 0.075 | 0.0032 | 0.003 | – | 1.098 | 1.029 | 0.486 | 0.943 |
| 0.1 | 0.05 | 0.0032 | 0.003 | – | 1.098 | 1.029 | 0.729 | 0.773 |
For sound coming from the 2nd area (ABC) shown in Table 4, it is possible to determine the distances traveled by sound to the sensor, according to formulas (4):
| (4) | ||
At these distances from the sensors, it’s needed to find the points’ set of the circles with corresponding radii SA, SB, and SC. There are two points of two circles’ intersection under these conditions – S and S (Figure 11). However, taking into account the order of the sensors’ response, we are interested in only one point – S, from the relevant area.
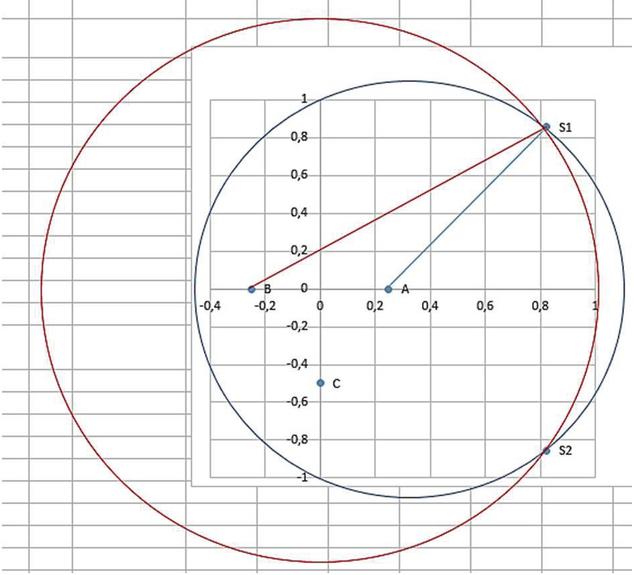
Figure 11 Determining the points of intersection of two circles for the 2nd area where the sound is coming from.
To calculate the exact coordinates, we solve a system of Equations (5):
| (5) |
Then, it’s needed to subtract the second from the first equation of the system (5) and reduce the squares of the unknown variables:
Thereafter, . For area “2” we are interested in a positive value – this is a point S (see Table 6).
Table 6 Coordinates of the sound source’s location for the 2nd area of sound origin
| 2d, | d, | t, | t, | t, | S, | S, | ||
| In | In | In | In | In | In | In | ||
| Meters | Meters | Seconds | Seconds | Seconds | Meters | Meters | x | y |
| 0.5 | 0.25 | 0.003 | 0.0032 | – | 1.029 | 1.098 | 0.146 | 1.024 |
| 0.4 | 0.20 | 0.003 | 0.0032 | – | 1.029 | 1.098 | 0.182 | 1.029 |
| 0.3 | 0.15 | 0.003 | 0.0032 | – | 1.029 | 1.098 | 0.243 | 1.025 |
| 0.2 | 0.10 | 0.003 | 0.0032 | – | 1.029 | 1.098 | 0.365 | 0.994 |
| 0.15 | 0.075 | 0.003 | 0.0032 | – | 1.029 | 1.098 | 0.486 | 0.943 |
| 0.1 | 0.05 | 0.003 | 0.0032 | – | 1.029 | 1.098 | 0.729 | 0.773 |
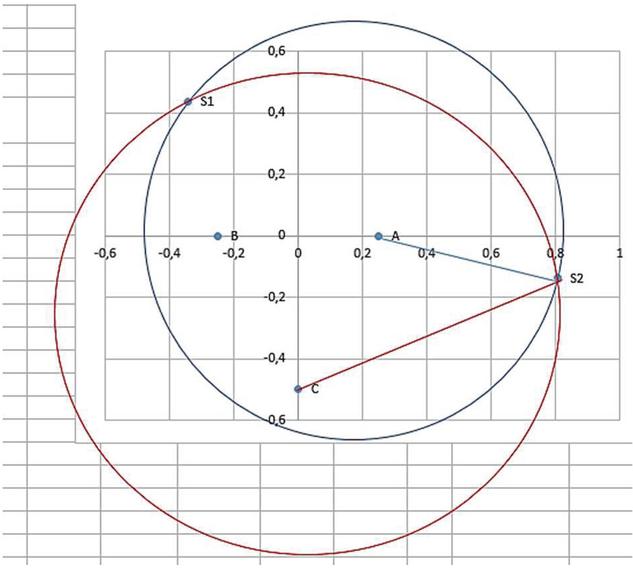
Figure 12 Determining the points of intersection of two circles for the 3rd area where the sound is coming from.
For sound coming from the 3rd area (ACB) shown in Table 4, it is possible to determine the distances traveled by sound to the sensor, according to formulas (6). The time of receipt of the signal is such that .
| (6) | ||
At these distances from the sensors, it’s needed to find the points’ set of the circles with corresponding radii SA, SB, and SC. There are two points of two circles’ intersection under these conditions – S and S (Figure 12). However, taking into account the order of the sensors’ response, we are interested in only one point – S, from the relevant area. Therefore, in the subsequent calculations, we consider only it as S.
To calculate the exact coordinates, we solve a system of Equations (7):
| (7) |
The results of this and subsequent calculations were obtained using the Wolfram Alpha service [46].
To the values set of the 3rd area correspond the formulas (). We will use them hereinafter to find the coordinates for this area (Table 7).
Table 7 Coordinates of the sound source’s location for the 3rd area of sound origin
| 2d, | d, | t, | t, | t, | S, | S, | ||
| In | In | In | In | In | In | In | ||
| Meters | Meters | Seconds | Seconds | Seconds | Meters | Meters | x | y |
| 0.5 | 0.25 | 0.003 | – | 0.0035 | 1.029 | 1.201 | 0.805 | 0.137 |
| 0.4 | 0.20 | 0.003 | – | 0.0032 | 1.029 | 1.098 | 0.687 | 0.221 |
| 0.3 | 0.15 | 0.003 | – | 0.0032 | 1.029 | 1.098 | 0.688 | 0.126 |
| 0.2 | 0.10 | 0.003 | – | 0.0032 | 1.029 | 1.098 | 0.725 | 0.005 |
| 0.15 | 0.075 | 0.003 | – | 0.0032 | 1.029 | 1.098 | 0.771 | 0.098 |
| 0.1 | 0.05 | 0.003 | – | 0.0032 | 1.029 | 1.098 | 0.867 | 0.295 |
For sound coming from the 4th area (CAB) shown in Table 4, it is possible to determine the distances traveled by sound to the sensor, according to formulas (8). The time of receipt of the signal is such that .
| (8) | ||
At these distances from the sensors, it’s needed to find the points’ set of the circles with corresponding radii SC, SA, SB. There are two points of two circles’ intersection under these conditions – S and S. However, taking into account the order of the sensors’ response, we are interested in only one point – S, from the relevant area. Therefore, in the subsequent calculations, we consider only it as S.
To calculate the exact coordinates, we solve a system of Equations (9):
| (9) |
Then, it’s needed to subtract the second from the first equation of the system (9) and reduce the squares of the unknown variables:
We will further use them to find the point’s coordinates of the sound source in the case of the sequence of the sensors’ response CAB(Table 8).
Table 8 Coordinates of the sound source’s location for the 4th area of sound origin
| 2d, | d, | t, | t, | t, | S, | S, | ||
| In | In | In | In | In | In | In | ||
| Meters | Meters | Seconds | Seconds | Seconds | Meters | Meters | x | y |
| m, 2d | c | c | c | m | m | |||
| 0.5 | 0.25 | 0.0035 | – | 0.003 | 1.201 | 1.029 | 0.499 | 0.749 |
| 0.4 | 0.20 | 0.0032 | – | 0.003 | 1.098 | 1.029 | 0.541 | 0.513 |
| 0.3 | 0.15 | 0.0032 | – | 0.003 | 1.098 | 1.029 | 0.494 | 0.515 |
| 0.2 | 0.10 | 0.0032 | – | 0.003 | 1.098 | 1.029 | 0.433 | 0.589 |
| 0.15 | 0.075 | 0.0032 | – | 0.003 | 1.098 | 1.029 | 0.382 | 0.680 |
| 0.1 | 0.05 | 0.0032 | – | 0.003 | 1.098 | 1.029 | 0.283 | 0.872 |
For sound coming from the 5th area (CBA) shown in Table 4, it is possible to determine the distances traveled by sound to the sensor, according to formulas (2.2). The time of receipt of the signal is such that .
| (10) | ||
At these distances from the sensors, it’s needed to find the points’ set of the circles with corresponding radii SC, SB, and SA. There are two points of two circles’ intersection under these conditions – S Ta S. However, taking into account the order of the sensors’ response, we are interested in only one point – S, from the relevant area. Therefore, in the subsequent calculations, we consider only it as S.
We will further use them to find the point’s coordinates of the sound source in the case of the sequence of the sensors’ response CBA(Table 9).
Table 9 Coordinates of the sound source’s location for the 5th area of sound origin
| 2d, | d, | t, | t, | t, | S, | S, | ||
| In | In | In | In | In | In | In | ||
| Meters | Meters | Seconds | Seconds | Seconds | Meters | Meters | x | y |
| 0.50 | 0.25 | 0.0035 | 0.003 | 1.201 | 1.029 | 0.499 | 0.749 | |
| 0.40 | 0.20 | 0.0032 | 0.003 | 1.098 | 1.029 | 0.541 | 0.513 | |
| 0.30 | 0.15 | 0.0032 | 0.003 | 1.098 | 1.029 | 0.494 | 0.515 | |
| 0.20 | 0.10 | 0.0032 | 0.003 | 1.098 | 1.029 | 0.433 | 0.589 | |
| 0.15 | 0.08 | 0.0032 | 0.003 | 1.098 | 1.029 | 0.382 | 0.680 | |
| 0.10 | 0.05 | 0.0032 | 0.003 | 1.098 | 1.029 | 0.283 | 0.872 |
For sound coming from the 6th area (BCA) shown in Table 4, it is possible to determine the distances traveled by sound to the sensor, according to formulas (2.2). The time of receipt of the signal is such that .
| (11) | ||
At these distances from the sensors, it’s needed to find the points’ set of the circles with corresponding radii SB, SC, and SA. There are two points of two circles’ intersection under these conditions – S and S. However, taking into account the order of the sensors’ response, we are interested in only one point – S, from the relevant area. Therefore, in the subsequent calculations, we consider only it as S.
The calculation of the exact coordinates is solved via a system of equations such as discussed above. We will use them hereinafter to find the coordinates for the 6th area (Table 10).
Table 10 Coordinates of the sound source’s location for the 6th area of sound origin
| 2d, | d, | t, | t, | t, | S, | S, | ||
| In | In | In | In | In | In | In | ||
| Meters | Meters | Seconds | Seconds | Seconds | Meters | Meters | x | y |
| 0.5 | 0.25 | – | 0.0030 | 0.0035 | 1.029 | 1.201 | 0.499 | 0.137 |
| 0.4 | 0.20 | – | 0.0030 | 0.0032 | 1.029 | 1.098 | 0.541 | 0.221 |
| 0.3 | 0.15 | – | 0.0030 | 0.0032 | 1.029 | 1.098 | 0.494 | 0.126 |
| 0.2 | 0.10 | – | 0.0030 | 0.0032 | 1.029 | 1.098 | 0.433 | 0.005 |
| 0.15 | 0.075 | – | 0.0030 | 0.0032 | 1.029 | 1.098 | 0.382 | 0.098 |
| 0.1 | 0.05 | – | 0.0030 | 0.0032 | 1.029 | 1.098 | 0.283 | 0.295 |
To implement the obtained results, it is not optimal to derive more generalizing formulas, because it is always necessary to choose the actual one from two points of intersection of circles. In the software implementation, it is advisable to choose the first two sound sources (or which of the 6 cases is implemented), and then use the appropriate formulas to calculate the required coordinates. For other Platonic polyhedra – Cube, Octahedron, Dodecahedron, Icosahedron, – it’s possible creating similar response schemes. To consider the three-dimensional microphones’ spatial arrangement in the pendant light, you will need to solve equations which take into account intersection spheres (Figure 13).
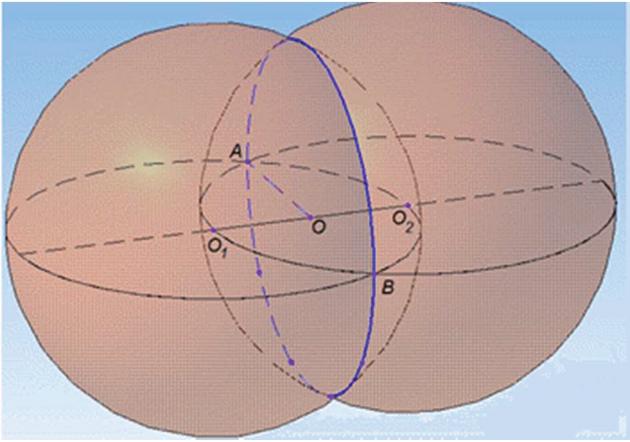
Figure 13 Determining the points of intersection of two spheres.
This, in turn, will lead to three-dimensional equations of the circle, and choosing the right point will be a very difficult task. That is, it needs further research.
3 The Software Application
The software was built on classic three-tier architecture using client-server technologies. While realizing separate parts of the application were used following technologies: MySQL client-server database management system – as a database server; Laravel framework [47] which is designed for development using MVC [48] technology – as an application server; and Angular Ionic frameworks for building a client-side application. To organize interaction between the database and application server layers object-relational mapping (ORM) [49] was used. This approach allows the execution of SQL queries to the database using entity object methods [50]. The Ionic framework was used to implement the frontend component of the application [51]. Within the current project, the Angular framework was used [52], which implements basic and additional functionality as a set of TypeScript libraries that have been added to the project. Using Apache Cordova (or Ionic Capacitor) technology allows to build a project for the target platform of the mobile device and receive the app that can be used on any device with the appropriate operating system installed. The work also discusses the possibility of improving the developed mobile application using machine learning algorithms, as described in [53].
There is also one more separate component whose task is to collect sensors’ responses and pass its data to the database. The alarm signal is transmitted from the sensors to the webserver and recorded into the database. To structure the generated database of transactions, an approach using the coarse set theory presented in [54] can be applied. The developed UI connects to the webserver and receives from the database data on the occurrence of an alarm. In Figure 14 the basic scheme of interaction of application components is given. To store data of buildings and rooms lists and alarms received from the respective sensors the MySQL database management system (DBMS) was used [55].
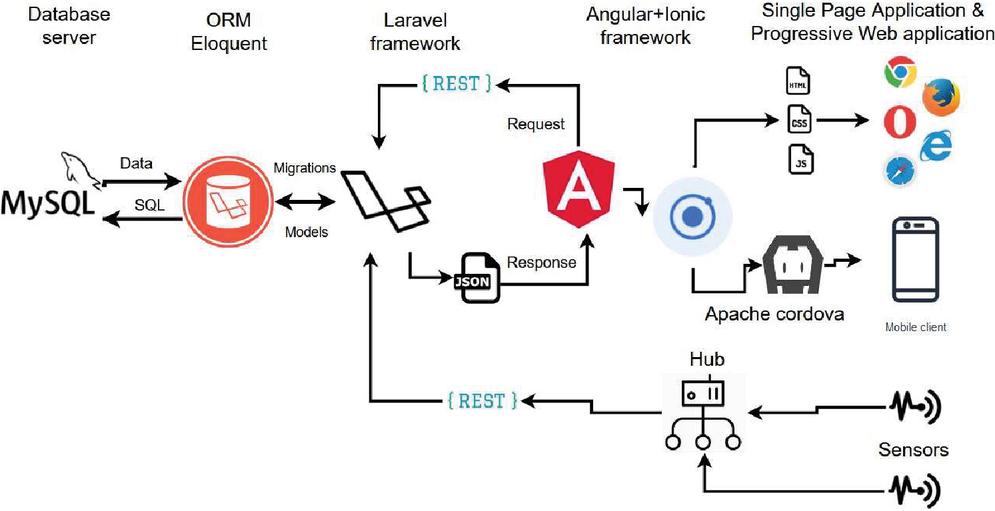
Figure 14 Scheme of the interaction of application components.
Next, the process of incoming the new data of sensors’ responses is given. The sequence diagram that is shown in Figure 15, makes it clear how four different layers of the application interact with one another.
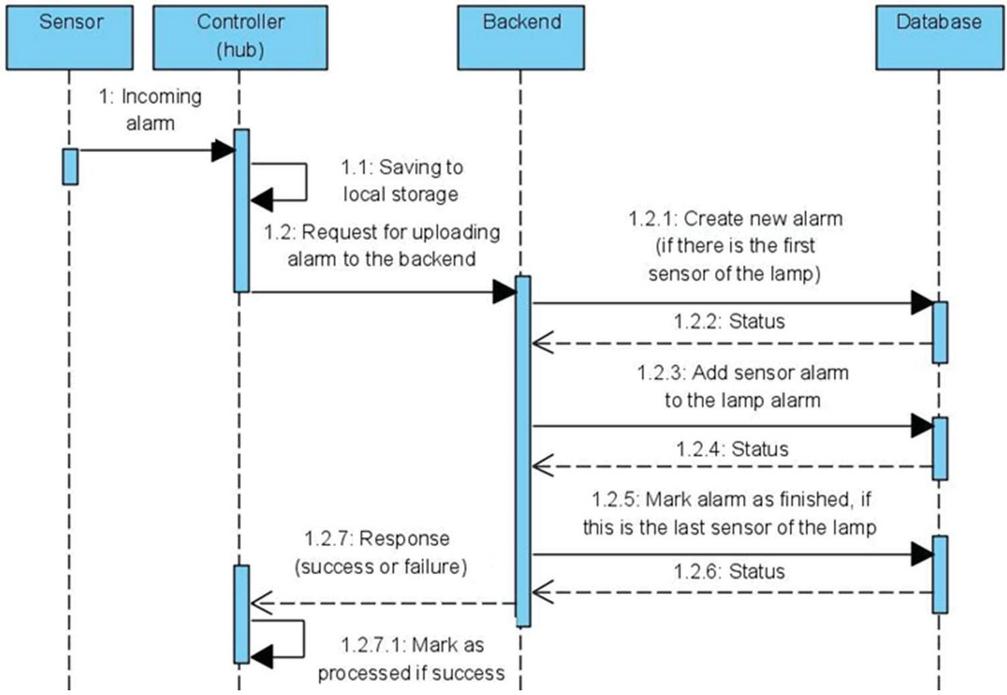
Figure 15 Sequence diagram of the process of saving new alarm to the database.
Firstly, the signal of occurred alarm comes from the sensor to the sensors’ controller. It collects data about the sensor build-in to the pendant light and the moment when the event took place. The controller saves incoming data to the local storage and then tries to connect to the application server. After that, the controller waits for the response from the application server and if the response status is “success” follows changing status of the alarm in the local storage to “processed”. The alarms with “processed” status could be cleaned from the local storage in the future to save the memory space on the controller.
When the application server gets the request for storing alarm data, it should determine if this alarm is first in the alarms sequence or not. It is considered to be the first if in the database there is no unfinished alarm in the current room (current pendant light). In this case, follows the command for creating a new alarm entity. Otherwise, the application server determines the unfinished alarm of the current room and gives the database server command to add a new sensor response to this alarm entity. After the sensor response is successfully added to the database it should be performed the verification for the last element in the alarm sequence. The verification works in the following way: if there are no sensors on the current pendant light that is not in the sensor response list of the current alarm object, the current alarm object is considered to be finished. And according to this, it is marked with the appropriate flag.
The application server layer provides a full-rest API for making all necessary operations to show information that the user needs and to edit data that has to be edited. Table 11 gives the extract of the available routes list where can be seen the route itself, its request method type, and formats of input and output data on the example of working with buildings list.
Table 11 Application server routes description (on the example of working with buildings list)
| Response | ||||
| URI | Method | Description | Parameters/Body | Structure (JSON) |
| /building | GET | Getting the current user’s buildings list | [{id: number, name: string}] | |
| /building /{id} | GET | Getting “building” entity with “id” identifier | Id: number – building’s unique identifier | {id: number, name: string} |
| /building | POST | Creating a new building | Body: {name: string} | {id: number, name: string} |
| /building /{id} | PUT | Editing the data of the “building” entity with “id” identifier | Id: number – building’s unique identifier Body: {name: string} | {id: number, name: string} |
| /building /{id} | DETELE | Removing the “building” entity with the “id” identifier | Id: number – building’s unique identifier | {} |
Another part of the software application provides the user functionality of getting data about alarms that occur in their rooms and buildings. The user interface consists of several user forms, which include forms for viewing a pendant light type list, viewing and editing buildings and rooms, and for getting information about sensor responses and their details. The user interface state diagram that is shown in Figure 16, gives a detailed graphical description of the application states and possible transitions between them. After the user has been authenticated, he gets to the main tabbed page where he chooses what to do next. There are four available options: view pendant light type list; view buildings or rooms lists; and view alarm list. While viewing lists of buildings or rooms, they can be edited by adding new elements, and editing or deleting existing ones. Working with the list of rooms it has to be firstly filtered in the hierarchy of buildings. When looking at the details of the alarm that has occurred the application displays an animation that shows the sequence in which sensors were triggered. Also, this sequence is displayed in table representation.
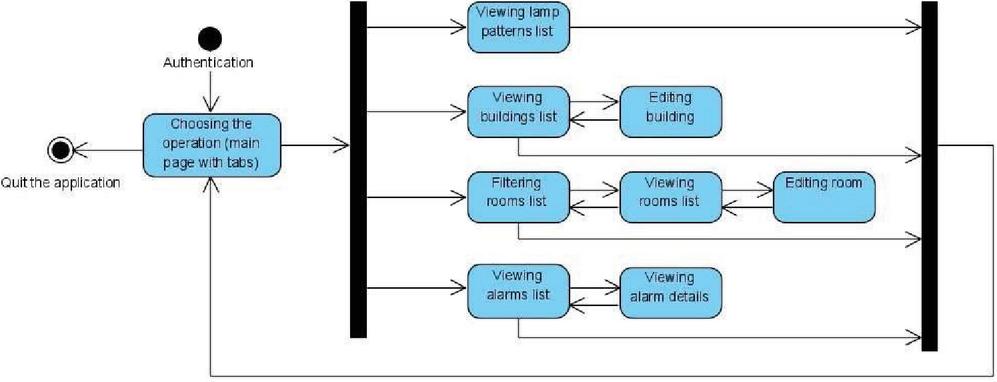
Figure 16 The state diagram of the application user interface.
In Figure 17 the forms of viewing the buildings list (a) and editing (b) one building entity are given. Also in Figure 17, c, there is a screen showing the form of a pendant light type choosing process. At the bottom of the buildings and pendant light types forms, there is the tabs menu that allows navigating between application pages (states).
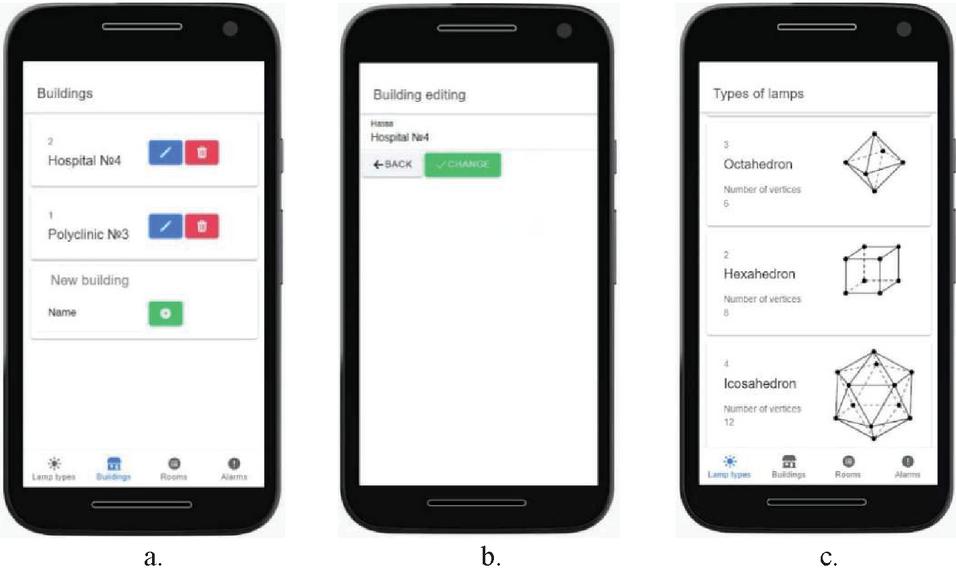
Figure 17 The viewing (a) and editing (b) buildings list and pendant light type list (c).
The next Figure 18 displays the screens of the working with the list of rooms (hospital wards). Here also can be seen screens of filtering list by building and editing pendant light type.
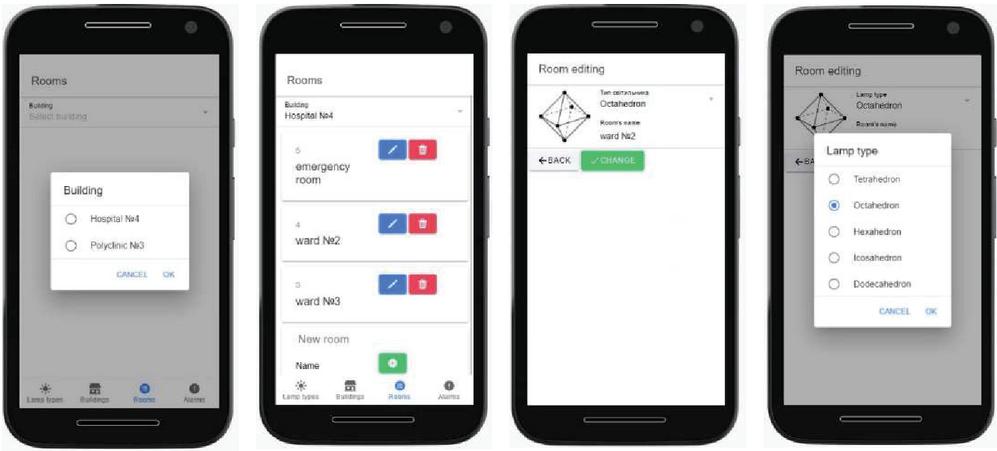
Figure 18 The screens of working with the list of rooms and pendant light type.
4 Analysis of Results
For the Platonic polyhedra shape of “Tetrahedron”, a process for printing acoustic “chandelier” components on a 3D printer (Figure 19) was developed.
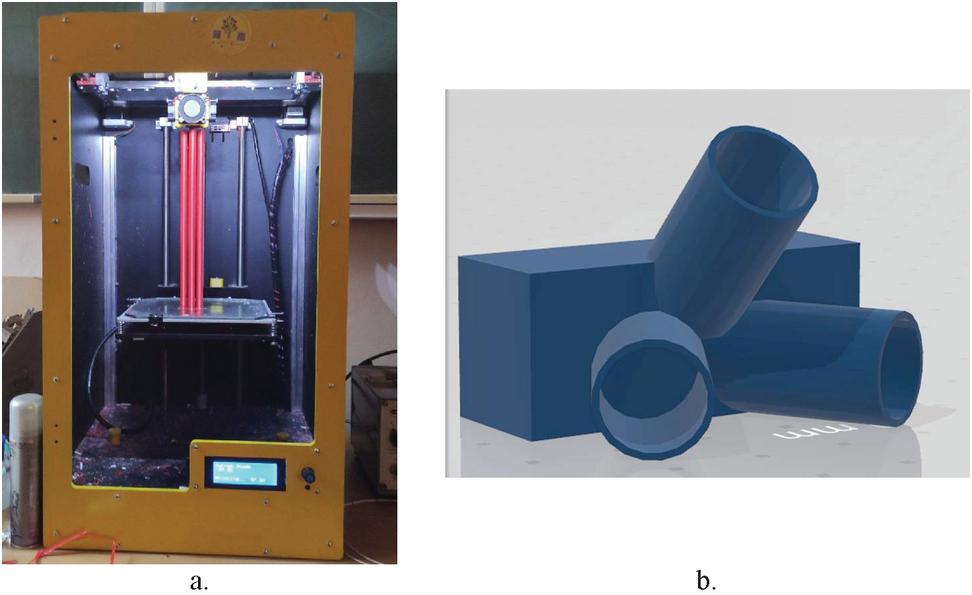
Figure 19 Printing the components of the chandelier in the shape of Platonic polyhedra on a 3D printer: edges (a) and model of vertex (b).
Also, a PAL system design with a built-in central unit based on Orange Pi minicomputer (Figure 20, a) and with sensors assembling sound in the vertices of Platonic polyhedra type of “Tetrahedron” (Figure 20, b) was proposed.
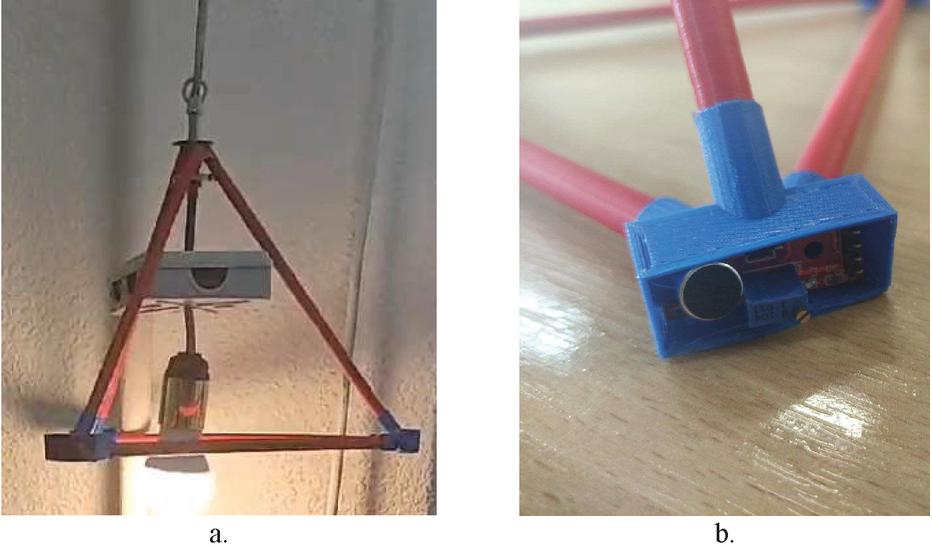
Figure 20 The design of the PAL system, printed on a 3D printer: a – with the built-in central block based on Orange Pi; b – with sound sensors in the vertices of Platonic polyhedra type of “Tetrahedron”.
Data collection and parameter setting in the developed ASOHAC system is based on the triggering of each calibrated sound sensor. The adjustment is made by rotating the potentiometer on the sound power level module. Thus, the sensors have activation settings relative to the noise level threshold in the room. According to the recommendations of the World Health Organization (WHO), hospital ward rooms should have a sound level not above 40 dB. According to the sound intensity tables, loud speech (doctor’s call) corresponds to a threshold of 50 dB, cough – up to 70 dB [56]. Thus, it is advisable to set the threshold of the sound sensor to a sound intensity of 50 dB. In intensive care units, levels can be increased to 80 dB (shout) or reduced to 20 dB (whisper level) [57].
Thus, the sound sensor turns on at a given sound pressure level (SPL) by adjusting the sensitivity manually via potentiometer rotation or using a set of commands written in C/C++ (the so-called “sketch”) and turns off after a specified time using an appropriate sketch.
The list of occurred alarms is displayed on the separate application page. Here the user reaches information about an alarm date and time, rooms’ (hospital wards’) and the building’s data, and also the type of the pendant light where the alarm occurred. In Figure 21 the screen of the alarm list is given. Likewise, it is shown the screens of alarm detailed information. Here can be seen in what sequence responses occurred on each sensor build-in the pendant light.
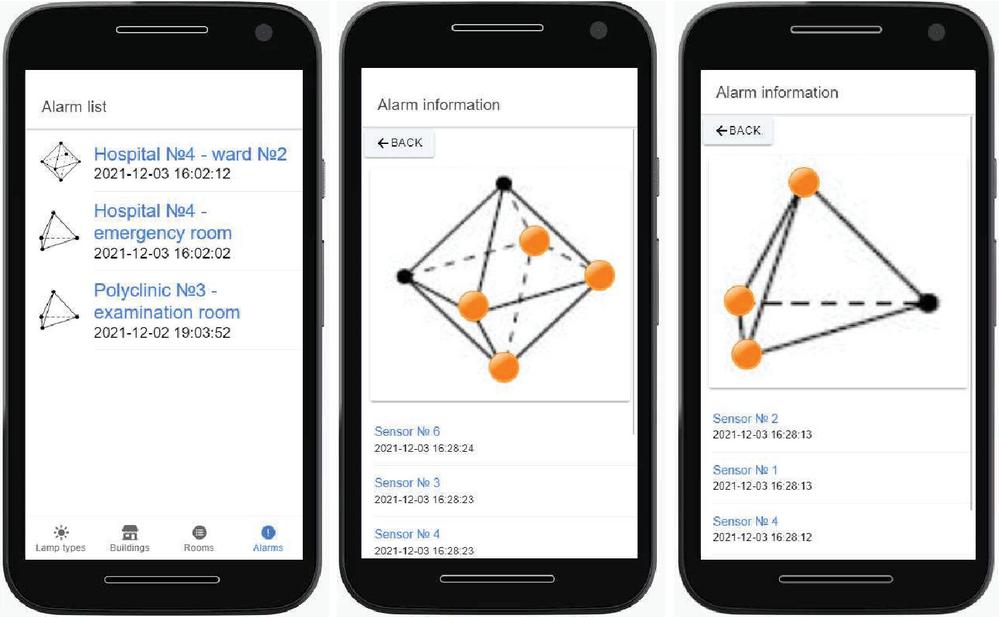
Figure 21 The states of the application user interface with alarm list.
Highlighting sensors of the pendant light in orange color chronologically, the page animation shows to user sequence in which sensors, embedded in the pendant light, are triggered one by another. In the future, it is advisable to pay attention to the chronometric visualization of such information, indicating the sequence of sensors that have registered the receipt of sound vibrations. In this case, it is necessary to develop an analytical definition and formation, for example, of a radar/spider chart in a polar coordinate system showing the chronology of alarms with its display on the user interface in real-time. This solution to the problem will allow determining as soon as possible not only the fact of violation of the perimeter of the organization or the receipt of sound from the victims but also determine the direction of their movement in space. This will significantly increase the speed of response and decision-making in search operations.
Thus, the PAL system can inform doctors in real-time about a certain noise, such as coughing or moaning (depending on the sensitivity of the sensor), as well as the distance to the patient’s bed. Then the doctor will already know which patient to approach in the first place.
The authors in any case do not allege that the system presented in the research will impose on doctors sequentiality of their actions or in any case tell them about actions priority. It is quite a dangerous field that requires special medical education and big medical work experience to make the right decision that could save someone’s life. The system only provides doctors with information about alarm signal time and location.
5 Conclusions and Future Work
Even though a larger population carries the disease COVID-19 in a mild form at home, hospitals are overcrowded with patients with severe disease. Doctors have to work several days under a heavy load when the number of patients exceeds the number of beds.
The created system of passive acoustic location (PAL) in the shape of a chandelier with built-in sound sensors enables the queue’s automated creation of doctor’s calls by patients in the hospital. After a patient lying in the ward has called a doctor via his voice or started moaning, the doctor on duty will receive the ward number and the ID of the patient, who made the call, through the mobile application on his gadget. If there are several such calls, then the developed acoustic software and hardware complex (ASOHAC) will automatically queue the received calls. The proposed approach will allow the doctor to respond promptly to the deterioration of the patient’s condition and provide emergency care.
The paper proposes the construction of a “chandelier” in the form of Platonic polyhedra, in the vertices of which are built-in sound sensors that register the patient’s voice (time and location), which calls the doctor. The program for printing on a 3D printer the components of the acoustic “chandelier” in the shape of one of the Platonic polyhedra – Tetrahedron has been developed to demonstrate the effectiveness of the proposed solution. Also, there was assembled and tested the design of the PAL system consisted of a built-in central unit based on the Orange Pi minicomputer and sound sensors at the tops of the Platonic polyhedra “Tetrahedron”. A mathematical model of PAL operation with the spatial placement of up to 20 sound sensors at the vertices of any Platonic polyhedra has been constructed.
This system can be used for the automatic creation of a queue of a doctor’s calls for providing medical care to patients with coronavirus infection, as well as for people after surgery or those, who have suffered a stroke, etc. Especially relevant is the use of the proposed solution in hospitals and wards filled with patients with diseases that limit their ability to move and speak.
Properly calibrated sensors will allow the system ASOHAC to pick up, for example, coughing or moaning. Information from sound sensors through the microcontroller system is sent to the mobile application on the gadgets of medical staff or to the monitor of the nursing post for processing calls from different wards. As a result, doctors will be able to obtain data on the ward’s number and the ID of the patient, who called a doctor. It will allow doctors to know in advance where medical care should be provided priority per the established queue of calls.
In the future, it is advisable to pay attention to the chronometric visualization of such information, indicating the sequence of sensors that have registered the receipt of sound vibrations. In this case, it is necessary to develop an analytical definition and formation, for example, of a radar/spider chart in a polar coordinate system showing the chronology of the doctor calls from patients with its display on the user interface in real-time. This solution to the problem will allow determining as soon as possible not only the fact of violation of the perimeter of the organization or the receipt of sound from the victims, but also determine the direction of their movement in space. This will significantly increase the speed of response and decision-making in search operations.
References
[1] H. Qian, X. Wu, Ya. Xu, ‘Intelligent surveillance systems’, Springer Science & Business Media, 2011.
[2] B. Ferguson, P. J. Gendron, Z.-H. (E.) Michalopoulou, K. T. Wong, ‘Introduction to the special issue on acoustic source localization’, The Journal of the Acoustical Society of America, 146 (4647), 2019, https://doi.org/10.1121/1.5140997.
[3] A. Garrido, ‘Discrete Mathematics and Symmetry’, MDPI, 2020.
[4] V. Shurbin, M. Hnesdilov, I. Zhuravska, A. Boiko, V. Polianichkin, V. Burenko, ‘Hardware-software complex to diagnostic and rehabilitation the patients with damages of cervical-thoracic spine and hand nerves’, Proc. of the 2020 IEEE 40th Int. Conf. on Electronics and Nanotechnology (ELNANO’2020), pp. 493–498, 2020, https://doi.org/10.1109/ELNANO50318.2020.9088866.
[5] M. Strohmayer, A. Eberhard, ‘Fruit Pi: Raspberry Pi versus Banana Pi versus Orange Pi’, Martin Strohmayer, 2018.
[6] Y. P. Kondratenko, V. M. Kuntsevich, A. A. Chikrii, V. F. Gubarev, ‘Advanced control systems: Theory and applications’, Series in Automation, Control and Robotics, River Publishers, Gistrup, Delft, 2021.
[7] Z. Byelozyorov, A. Trunov, ‘Increasing quality of the wireless module for monitoring and supervision of sound series of the expanded purpose’, Eastern-European Journal of Enterprise Technologies, 6, 5(114), pp. 28–40, 2021, https://doi.org/10.15587/1729-4061.2021.247658.
[8] O. Tohoiev, I. Burlachenko, I. Zhuravska, V. Savinov, ‘The monitoring system based on a multi-agent approach for moving objects positioning in wireless networks’, CEUR Workshop Proc., 2608, pp. 79–90, 2020.
[9] I. Ahmed, H. Karvonen, T. Kumpuniemi, M. Katz, ‘Wireless communications for the hospital of the future: Requirements, challenges and solutions’, International Journal of Wireless Information Networks, 27(5), pp. 4–217, 2020, https://doi.org/10.1007/s10776-019-00468-1.
[10] I. Zhuravska, K. Obukhova, ‘Modeling of multi-core power consumption during online video conference’, Proc. of the IEEE 11th Int. Conf. on Intelligent Data Acquisition and Advanced Computing Systems: Technology and Applications (IDAACS’2021), 2, pp. 640–646, 2021. https://doi.org/10.1109/IDAACS53288.2021.9660941.
[11] I. M. Zhuravska, O. O. Koretska, M. P. Musiyenko, ‘Self-powered information measuring wireless networks using the distribution of tasks within multicore processors’, Proceedings of SPIE, 10445, pp. 1–13, 2017, https://doi.org/10.1117/12.2280965.
[12] I. Zhuravska, K. Obukhova, V. Burenko, ‘Diagnostics of power consumption of a mobile device multi-core processor with detail of each core utilization’, Proc. of the IEEE 15th Int. Conf. on Advanced Trends in Radioelectronics, Telecommunications and Computer Engineering (TCSET), pp. 368–372, 2020. https://doi.org/10.1109/TCSET49122.2020.235456.
[13] Y. Y. Korolova, M. A. Miroshnyk, Y. V. Pahomov, ‘Graphic representation of component algorithms in multimedia devices’, Proc. of the 29th Int. Scientific Symp. on Metrology and Metrology Assurance (MMA’2019), pp. 202–206, 2019.
[14] M. Kaczmarek, A. Bujnowski, K. Osiñski, E. Birrer, T. Neumann, and B. Teunissen, ‘Ella4Life virtual assistant – user centered design strategy – evaluation following labolatory tests’, Proc. of the 13th Int. Conf. on Human System Interaction (HSI), pp. 307–311, 2020, https://doi.org/10.1109/HSI49210.2020.9142690.
[15] I. Zhuravska, ‘Remote rehabilitation of the post-stroke patients with the hand and finger nerves damaged through wireless devices in individual conditions’, Journal of Medical Pharmaceutical and Allied Sciences, 10(5), 1594, pp. 3691–3697, 2021, https://doi.org/10.22270/jmpas.V10I5.1594.
[16] S. Kozeruk, O. Serhiienko, ‘Approbation of evaluation techniques of acoustic waves time delay for sound sources localization’, Proc. of the IEEE 38th Int. Conf. on Electronics and Nanotechnology (ELNANO), pp. 582–586, 2018, https://doi.org/10.1109/ELNANO.2018.8477565.
[17] S. O. Kozeruk, D. V. Maznichenko, ‘Determining of source’s coordinates of shot by mean of acoustic waves’, ElectronCommun, 22(1), pp. 45–49, 2017, https://doi.org/10.20535/2312-1807.2017.22.1.79761 (In Ukrainian).
[18] A. Trunov, Z. Byelozyorov, ‘Forming a method for determining the coordinates of sound anomalies based on data from a computerized microphone system’, Eastern-European Journal of Enterprise Technologies, 2, 4(104), pp. 38–50, 2020, https://doi.org/10.15587/1729-4061.2020.201103.
[19] K. W. Lo, B. G. Ferguson, ‘Acoustic ranging of small arms fire using a single sensor node collocated with the target’, The Journal of the Acoustical Society of America, 137 (EL422), 2015, https://doi.org/10.1121/1.4921447.
[20] R. E. Hudson, K. Yao, J. C. Chen, ‘Acoustic source localization and beamforming: Theory and practice’, EURASIP journal on advances in signal processing, 4, 2003, https://doi.org/10.1155/S1110865703212038.
[21] Boomerang Gunshot Detection, Raytheon Intelligence & Space, pp. 1–4, July 24, 2020 [Online], https://prd-sc101-cdn.rtx.com/-/media/ris/what-we-do/modernization-mission-support/mission-support/boomerang/2020-10/files/boomerang\_data.pdf?rev=b3b7837160db47cca32e50a01a7d175b. Accessed: 2022-02-19.
[22] Absorption coefficients of common building materials and finishes [Online], https://www.acoustic-supplies.com/absorption-coefficient-chart/. Accessed: 2022-07-18.
[23] M. Sewtz, X. Luo, J. Landgraf, T. Bodenmüller, R. Triebel, ‘Robust approaches for localization on multi-camera systems in dynamic environments’, Proc. of the IEEE 7th Int. Conf. on Automation, Robotics and Applications (ICARA), pp. 211–215, 2021, https://doi.org/10.1109/ICARA51699.2021.9376475.
[24] D. Rumiankov, I. Zhuravska, L. Solobuto, M. Musiyenko, ‘Reduction of noise similar to solar interference in computer networks based on power line communication’, Proc. of the 8th IEEE Int. Conf. on Intelligent Data Acquisition and Advanced Computing Systems: Technology and Applications (IDAACS’2017), 1, pp. 215–221, 2017, https://doi.org/10.1109/IDAACS.2017.8095079.
[25] H. Ukhina, V. Sytnikov, O. Streltsov, P. Stupen, V. Kudria, ‘Application of the computer system component with adjustment elements for processing sensor signals’, Proc. of the 11th IEEE Int. Conf. on Intelligent Data Acquisition and Advanced Computing Systems: Technology and Applications (IDAACS 2021), 1, pp. 12–17, 2021, https://doi.org/10.1109/IDAACS53288.2021.9660992
[26] H. Ukhina, V. Sytnikov, O. Streltsov, P. Stupen, V. Kudria, ‘Using similar filters to build the sensor signal digital processing path’, Lecture Notes in Networks and Systems, 217, pp. 433–442, 2022, https://doi.org/10.1007/978-981-16-2102-4\_40.
[27] C. Anastopoulos, ‘Particle or Wave: The Evolution of the Concept of Matter in Modern Physics’, Princeton University Press, 2020.
[28] J.-F. Gabriel, ‘Beyond the cube: The architecture of space frames and polyhedra’, John Wiley & Sons, 1997.
[29] Tetrahedron and light (n.d.) [Online], http://ve4no.blogspot.com/2010/05/blog-post.html (In Russian). Accessed: 2022-02-19.
[30] Leniure gold cubic LED light pendant lamp chandelier [Online], https://www.amazon.com/Cubic-Pendant-Chandelier-Lighting-Fixture/dp/B07KSG39L7/. Accessed: 2022-02-19.
[31] Octahedron light, shining light, pendant light [Online], https://www.etsy.com/il-en/listing/765152952/octahedron-light-shining-light-pendant. Accessed: 2022-02-19.
[32] Factory price loft modern industrial retro restaurant chandelier solid wood hexahedron diamond E27 [Online], https://www.amazon.com/Industrial-Restaurant-Chandelier-Hexahedron-American/dp/B09T3BPJL3/. Accessed: 2022-02-19.
[33] Pendant dodecahedron lamp [Online], https://www.etsy.com/il-en/listing/590494385/pendant-dodecahedron-lamp-geometric. Accessed: 2022-02-19.
[34] V. Ziemann, ‘A hands-on course in sensors using the Arduino and Raspberry Pi’, CRC Press, 2018.
[35] Wireless sound sensor. (n.d.). Pasco [Online], https://www.pasco.com/. Accessed: 2022-02-19.
[36] Autodesk: Educators [Online], https://www.autodesk.com/education/educators https://www.autodesk.com/education/home. Accessed: 2022-02-19.
[37] E26 12V Low Voltage LED Light Bulbs Warm White 3000K, E27 Edison Standard [Online], https://www.amazon.com/Standard-DC12-24V-Equivalent-Off-Grid-Landscape-Pack/dp/B07RGJ4BH6/. Accessed: 2022-02-19.
[38] BS EN 12464-1:2021. Light and lighting. Lighting of work places Indoor work places [Online], https://www.en-standard.eu/search/?q=12464-1-2021. Accessed: 2022-07-18.
[39] DBN V.2.5-28:2018. Natural and artificial lighting [Online], https://www.minregion.gov.ua/wp-content/uploads/2018/09/DBN\_Osvitlennya-ostatochna.pdf. Accessed: 2022-07-18.
[40] Dewenwils table top inline dimmer switch and warm white dimmable LED light bulb [Online], https://www.amazon.com/dp/B07CZXLNWL/. Accessed: 2022-07-18.
[41] S. Kalajdzievski, ‘Math and art: An introduction to visual mathematics’, CRC Press, 2021.
[42] ISO 8995-1:2002. Lighting of work places – Part 1: Indoor [Online], https://www.iso.org/obp/ui/\#iso:std:iso:8995:-1:ed-1:v1:en. Accessed: 2022-02-19.
[43] What is the ideal hospital temperature for patient comfort and facility efficiency? [Online], https://www.primexinc.com/. Accessed: 2022- 07-18.
[44] R. Mora, M. Meteyer, ‘Using thermal comfort models in health care settings’, Preprint, HO-18-003, 12 p., July 16, 2018 [Online], https://commons.bcit.ca/besys/files/2018/08/Thermal-comfort-health-care.pdf. Accessed: 2022-07-18.
[45] S. Sattayakorn, M. Ichinose, R. Sasaki, ‘Clarifying thermal comfort of healthcare occupants in tropical region: A case of indoor environment in Thai hospitals’, Energy and Buildings, 149, pp. 45–57, 2017, https://doi.org/10.1016/j.enbuild.2017.05.025.
[46] WolfreeAlpha: FREE Wolfram|Alpha Step-by-Step Solution [Online], https://wolfreealpha.github.io/. Accessed: 2022-02-14.
[47] M. Stauffer, ‘Laravel: Up & Running: A framework for building modern PHP apps’, 2nd ed., O’Reilly Media, 2019.
[48] E. Freeman, E. Robson, ‘Head first design patterns : Building extensible and maintainable object-oriented software’, O’Reilly Media, 2020.
[49] Eloquent: Getting started [Online], https://laravel.com/docs/8.x/eloquent. Accessed: 2022-02-14.
[50] M. Dvoretskyi, S. Dvoretska, H. Horban, Y. Nezdoliy, ‘Optimization of the database structure of a distributed corporate information system node using the analytic hierarchy process’, CEUR Workshop Proc., 2845, pp. 193–203, 2020.
[51] C. Griffith, ‘Mobile app development with Ionic. Revised Edition: Cross-Platform Apps with Ionic, Angular, and Cordova’, O’Reilly Media, 2017.
[52] N. Murray, F. Coury, A. Lerner, C. Taborda, ‘Ng-book: The complete guide to Angular’, CreateSpace Independent Publishing Platform, 2018.
[53] Y. Kondratenko, I. Atamanyuk, I. Sidenko, G. Kondratenko, S. Sichevskyi, ‘Machine learning techniques for increasing efficiency of the robot’s sensor and control information processing’, Sensors, 22(3), 1062, 2022, https://doi.org/10.3390/s22031062.
[54] I. Kovalenko, A. Shved, K. Antipova, Y. Davydenko, ‘Structuring of a transaction database using the rough set theory’, CEUR Workshop Proc., 2608, pp. 278–287, 2020.
[55] M. Dvoretskyi, S. Dvoretska, Y. Nezdoliy, S. Borovlova, ‘Data utility assessment while optimizing the structure and minimizing the volume of a distributed database node’, CEUR Workshop Proc., 2516, pp. 128–137, 2019.
[56] Comparative examples of noise levels [Online], https://www.iacacoustics.com/blog-full/comparative-examples-of-noise-levels.html. Accessed: 2022-07-18.
[57] F. Astin, J. Stephenson, J. Wakefield, et al., ‘Night-time noise levels and patients’ sleep experiences in a medical assessment unit in Northern England’, The Open Nursing Journal, 14, pp. 80–91, 2020, https://doi.org/10.2174/1874434602014010080.
Biographies
Iryna Zhuravska, Professor, Head at the Computer Engineering Department, Petro Mohyla Black Sea National University, Mykolaiv, Ukraine. Area of interest: Computer Networking, Network Communication, Network Architecture, IT Security, Wireless Security, Modeling/Simulation of Computer Networks and Systems.

Mykhailo Dvoretskyi, Associate Professor at the Software Engineering Department, Petro Mohyla Black Sea National University, Mykolaiv, Ukraine. Area of interest: Software Engineering, Databases, Information Theory.

Inessa Kulakovska, Associate Professor at the Intelligent Information Systems Department, Petro Mohyla Black Sea National University, Mykolaiv, Ukraine. Area of interest: graph theory (discrete mathematics), logistics, system analysis, operations research and more.

Anzhela Boiko, Associate Professor at the Computer Engineering Department, Head at the Computer Science Faculty, Petro Mohyla Black Sea National University, Mykolaiv, Ukraine. Area of interest: 3D Simulation, Optimization, Genetic Algorithms, etc.
Svitlana Dvoretska, Master of Computer Science, Senior Lecturer at the Software Engineering Department, Petro Mohyla Black Sea National University, Mykolaiv, Ukraine. Area of interest: Software Engineering, Coding, Databases.
Journal of Mobile Multimedia, Vol. 19_3, 897–934.
doi: 10.13052/jmm1550-4646.19311
© 2023 River Publishers