A Testing Framework for Multi-Sensor Mobile Applications
Darian Frajberg, Piero Fraternali, Rocio Nahime Torres, Carlo Bernaschina and Roman Fedorov
Dipartimento di Elettronica, Informazione e Bioingegneria
Politecnico di Milano, Piazza Leonardo da Vinci, 32, Milan, Italy
E-mail: darian.frajberg@polimi.it, piero.fraternali@polimi.it,
rocionahime.torres@polimi.it, carlo.bernaschina@polimi.it,
roman.fedorov@polimi.it
Received 26 November 2018; Accepted 11 April 2019;
Publication 06 May 2019
Abstract
Outdoor mobile applications are becoming popular in many fields, such as gaming, tourism and environment monitoring. They rely on the input of multiple, possibly noisy sensors, such as the camera, Global Positioning System (GPS), compass, accelerometer and gyroscope. Testing such applications requires the reproduction of the real conditions in which the application works, which are hard to recreate without automated support. This paper presents a capture & replay framework that automates the testing of mobile outdoor applications; the framework records in real-time data streams from multiple sensors acquired in field conditions, stores them, and let developers replay recorded test sequences in lab conditions, also computing quality metrics that help tracing soft errors.
Keywords: Mobile sensing, Regression testing, Mobile Augmented Reality, Context simulation.
1 Introduction
Outdoor mobile applications support the activity of users in field conditions, where the task at hand requires the processing of inputs from multiple sensors. Exemplary applications are maps (e.g., Google Maps1), touristic guides (e.g., mTrip2), activity tracking (e.g., Garmin Connect3) and augmented reality (e.g., Pokemon Go4). The distinctive characteristics of such applications are their dependency on multiple, heterogeneous, and often noisy sensors, in addition to the need to process sensor data streams in real-time to deliver a proper user experience. For example, a sightseeing Augmented Reality (AR) app, such as PeakLens5 or PeakAR6, must support mountaineers during their trips by processing data streams from the Global Positioning System (GPS), compass, accelerometer, gyroscope, and even from the camera, if the application supports the identification and overlay of objects of interest (e.g., mountain peaks) onto the camera view.
Testing an outdoor mobile application requires verifying its behavior, in terms of failures, soft errors, or performance, in working conditions. Such working conditions, also called context in [1–3] comprise the input values of all the sensors on which the application relies for its functioning. Building a test set that reproduces working conditions faithfully is challenging because most sensors are extremely noisy and their accuracy varies greatly [4], not only on different mobile devices, but also on the same device in different operating conditions (e.g., GPS positioning can be affected by meteorological conditions, compass orientation by the proximity of an electrical source). Furthermore, it is also necessary to take into account the temporal correlation of multiple sensor data streams; for example, in an application that overlays information on the screen based on what the user is looking at, the usage context is composed of the sequence of positions from the GPS sensor, the sequence of orientations of the device from the compass sensor, the sequence of pitch and roll values of the device from the accelerometer and the gyroscope, and the sequence of view frames from the camera. Such sequences are correlated, because the content of the camera frame at a given time depends on the position, orientation, pitch and roll data. In particular, the development of Mobile Augmented Reality (MAR) applications with sophisticated Computer Vision modules, such as [5–8], exploit many of the previously mentioned sensors and may benefit from a mechanism to assess their performance realistically.
The goal of testing can be the identification of the insurgence of hard errors, which cause the application to fail, the quantification of performance properties, or the verification of soft errors, i.e., the occurrence of bugs that do not cause the application to fail, but nonetheless degrade its behavior with respect to some desirable characteristic that impacts user’s acceptance. Investigating soft errors requires defining the property to observe, formalizing quality metrics for its evaluation, extracting the values of the target property from applications runs, and comparing the extracted values with some reference, which acts as a gold standard (i.e., a representation of what is ideal for the user).
Figure 1 portraits the process of testing for soft errors a mobile application that relies on multiple sensors.
The Acquisition and correlation step collects input data from multiple data sources and manages their dependencies and temporal correlation; it outputs a test sequence, which is a temporal series of values, one per type of input.
The Feeding step prepares the ground for executing a test run of the application on a test sequence. It encodes the test sequence in the format required by the execution environment and submits it for processing.
The Execution step actually runs the test session, by executing the application with the test sequence as input. In the case of a mobile application, the execution can be performed on board the device or in a simulator.
The Property extraction step observes an execution run to fetch the values of the property under examination. This can be normal termination, if the testing goal is to uncover failures, resource usage or execution time, if the testing goal is to analyze performance, or an application dependent property, if soft errors are the target.
Figure 1 Testing process of a multi-sensor mobile application.
The Evaluation step concludes the process by reporting the outcome of execution runs. To assess performance and soft errors, the evaluation must characterize the (un)desired behavior by metrics. Such metrics can be the deviation of a directly observable variable from a target value (e.g., the response time exceeding a threshold) or may require comparing some output of the application with an example providing a quality bound (e.g., evaluating the error in tracking the user’s location during motion can be done by comparison with a correct sequence of positions; evaluating the misplacement of information over objects on the screen can be done by comparison with a correct sequence of 2D screen object coordinates).
The implementation of the testing process of Figure 1 poses several challenges. The creation of test sequences in the Acquisition and correlation step must cope with the heterogeneity and dependencies of input data. Albeit model-driven data generators and databases of traces exist for several classes of sensors (e.g., network connectivity [9], position [10], motion [11]). The construction of multi-sensor test sequences by means of the temporal sampling of independent data streams for the different sensors is inadequate for testing applications that have interdependency of input values and for evaluating properties for which sensors interdependency cannot be ignored; for example, assessing the presence of soft errors in the screen position of geo-referenced information during the user’s motion requires considering the interdependency between camera content and compass position, orientation, pitch and roll. In such a situation, a multi-sensor data capture approach, enabling the simultaneous recording of sensor values in field conditions, may be the only viable solution to obtain realistic test sequences and correctly reproduce the usage context for testing purposes. However, the cost of building a multi-sensor data capture tool may be nearly equivalent to that of building the application itself.
The Feed step must be able to supply the Execution with the test sequence in a way that faithfully reflects the reading of sensor in field conditions. If execution is performed in the device, this requires interfacing the component that implements the Feed step to the sensor management services of the mobile operating system; if execution is emulated, the challenge is ensuring that the emulator can be made to supply values to the application at the same rate that would be experienced in the real device [1].
The implementation of the Property extraction step distinguishes the case in which the observed property can be computed without access to the internal structure of the application and the case in which such access is required. Whereas failures and performance issues can be detected without access to the source code, soft errors, being application dependent, may not be observable unless the source code is instrumented to export the application status from which the target property can be observed and the metrics computed.
Finally, the challenge of Evaluation is the encoding of the testing goal into a computable metrics, whose evaluation may require the construction of a gold standard. The gold standard is a mapping between each element of the test sequence and the corresponding value of the observed property that represents a correct or user acceptable output, given that context. The creation of the gold standard is typically a manual procedure, either because it involves human judgment (deciding what is acceptable) or because an algorithmic solution would have the same complexity (and potentially suffer from the same defects) of the system under test.
This paper further extends the work presented in [12] discussing the experience of building a testing framework for mobile multi-sensor applications, evaluated on a considerable number of sequences for a case study consisting of an outdoor Augmented Reality application for the real-time mountain peak identification and on-screen labeling; the interface of such application is shown in Figure 2.
Figure 3 gives an example of soft error in the positioning of the peaks. For the same sensor input (position, orientation, pitch, roll and camera frame), a defect in the application configuration causes the peak labels to be placed with an horizontal offset with respect to the correct screen coordinates.
Figure 2 User interface of the multi-sensor mobile application under test (www.peaklens.com); the application uses multi-sensor input data to compute the position of visible peaks and label them. The testing goal is to uncover soft errors that cause peak labels to be misplaced.
Figure 3 A soft error that cause peak labels to be misplaced.
In the reported case study, the illustrated testing process and framework are characterized by the following aspects:
- A test sequence for the application consists of a multi-sensor temporal series, comprising the correlated values of the GPS, compass, accelerometer, gyroscope (if available) and camera sensors.
- Test sequence acquisition and correlation are performed by a Capture Module, implemented in the mobile device, which records test sequences in field conditions.
- The feeding of the test sequence is implemented by a Replay Module, which services (replays) the elements of a test sequence reproducing the temporal layout and data correlation captured in the field.
- Application execution can be performed both in the mobile device and on an emulator (in the case study, the Android device is used).
- The extracted property for evaluating soft errors is the mountain peak position; a peak position is defined as the pair of 2D screen coordinates of the camera frame at which the summit of a mountain appears and is used to label the peak (as visible in Figure 2). Such property can be computed in two ways: by instrumenting the source code and without instrumentation, by capturing and analyzing the application’s screen.
- Evaluation is performed by means of metrics that compare the peak positions extracted from the application and the “correct” peak positions. The metrics employ a gold standard data set created with a crowdsourcing system that let crowd workers manually specify the position of visible peaks in a series of mountain images.
The contributions of the paper can be summarized as follows:
- We introduce the problem of multi-sensor mobile application testing, along the line of previous works such as [1–3]; unlike prior works, which focused on the fidelity of replaying composite sensor sequences in emulated environments [1], on scalability of testing [3], or on the simulation of usage context at different levels [2], we concentrate on the specific scenario of assessing soft errors in multi-sensor mobile applications, exploiting context traces captured in the field.
- We introduce the architecture of a framework for testing multi-sensor mobile applications according to the process illustrated in Figure 1 and discuss the essential design decisions and rationale.
- We report the evaluation of the proposed testing framework in a case study addressing the evaluation of soft errors in a real word Augmented Reality multi-sensor mobile application.
- We highlight the limitations of the realized framework and the possible paths to its generalization.
The paper is organized as follows: Section 2 surveys the related work on mobile application testing, context simulation, and multi-sensor mobile application testing; Section 3 presents the architecture and components of the proposed multi-sensor mobile testing framework; Section 4 reports on its application to a case study of a mountain peak identification mobile application; Section 5 discusses the framework limitations and how to generalize the proposed approach; finally, Section 6 draws the conclusions and provides an outlook on the future work.
2 Related Work
Developing and testing applications that operate in complex working conditions has become a prominent research task, fueled by the widespread adoption of mobile applications that employ multiple sensors [13–15].
In the software engineering literature, the general conditions in which an application operates are abstracted into the concept of context [16, 17], defined as the information that characterizes any entity relevant to the interaction between the user and an application. Context-aware development has been specifically studied in the case of mobile applications [18], which provide a particularly rich notion of context that embraces the user’s state, the device capability, the sensed environment, and the network connectivity state.
Testing context-aware applications is a special sub-topic of context-aware software development, which recasts the classical methods of conventional application testing to the specific case in which the system under test requires the supply of context information.
The recent work [1] focuses on the generation of context information for the purpose of testing mobile applications in an emulated environment. The authors model the context as a set of modalities, each of which corresponds to a facet of the contextual information, such as network connectivity, position, motion sensors, and camera. They illustrate the design of a tool, called ContextMonkey, which fetches data for each context modality from heterogeneous sources, builds an integrated context stream and feeds such stream to the emulation environment, where it is exploited for running a test session. ContextMonkey is evaluated primarily with respect to its capacity of supplying the context information to an application inside the emulator with fidelity, i.e., at the same rate as in the real working conditions. An interesting collateral finding of the assessment is that the synthetic, model-driven construction of multi-sensor context streams, evaluated in a mobility use case, could not fully reproduce the semantic complexity of the real context streams recorded in the field; this observation is one of the motivations of our capture-based approach. Our work shares with [1] the focus on multi-sensor application testing; however, differently from ContextMonkey, our focus is not the fidelity of the replay of context streams during emulation, but the use of multi-sensors usage traces recorded in the field for the discovery of soft errors.
The VanarSena tool [19] instruments the binary code of the application to perform testing in a way that achieves both coverage and speed. The tool runs on a cloud and lets developers upload the application binary code and run multiple test sessions in parallel to emulate user behavior, network conditions, and sensor data, returning a failure report.
The dynamic testing of (non multi-sensor) mobile applications via controlled execution has also been pursued in a number of works. For example, Machiry et al. [20] describe a system, called Dynadroid, whereby developers can observe, select, and execute Graphical User Interface (GUI) and system events in a mobile device emulator, so as to drive black box analysis of test runs. Other related studies mostly focused on capture and replay at the level of GUI input-output events, without considering the specificity of mobile devices [21,22]. Conversely, Gomez et al. [23] present an approach specifically conceived for mobile devices, in which they record and replay Android apps usage traces by replicating GUI gestures and sensor readings. However, their tool cannot replay such services such as camera preview and GPS location, which are critical signals for sensor- and location-based applications. Our approach is similarly based on the observation of application runs, but focuses on capturing and replaying multi-sensor data; it could be extended with a system and GUI event capture, as in [20] and [23], to create test sessions that span all categories of input events: sensor, UI and system.
The use of a capture and replay approach for testing of mobile applications is reported in [24]; the authors present a tool for the dynamic analysis of executions, the debugging of deployed applications, and regression testing. A relevant finding is that the effectiveness of regression testing highly depends on how well the tool reproduces the way the program is used in the field. The accomplishment of such an objective in a multi-sensor mobile application requires a non trivial capture and replay architecture, which is a main contribution of our work.
3 Architecture of the Testing Framework
In this section, we illustrate the architecture of the framework that implements the testing process of Figure 1. In the next section, we discuss its application to the testing of PeakLens [7], a multi-sensor Augmented Reality mobile application, that identifies mountain peaks and overlays them in real-time on the camera view.
3.1 Framework Architecture
The proposed architecture relies on a capture and replay framework, which enables the collection of correlated multi-sensor traces in field conditions and produces test sequences that can be used for the controlled execution of the system under test both in the mobile device and in an emulator. Figure 4 shows the general system organization.
The Capture Module executes in the mobile device and orchestrates the acquisition of multiple sensor data streams. It interfaces to the sensor Application Programming Interface (API) of the mobile device: the Data Acquisition Manager sub-module handles the parallel execution of the data acquisition threads, one per sensor, and the buffering of the sensed values. The Synchronization Manager is responsible for the temporal alignment of the sensor readings. One sensor is registered as the master, and its callback determines the synchronous reading of the other ones from the buffers. This approach takes into account the fact that the camera sensor is normally the bottleneck in sensor data acquisition. If the camera sensor is registered as the master, the acquisition of each camera frame triggers the reading of the remaining sensor values from the buffers at the time of the callback. The Storage Manager formats the multi-sensor readings in the form of a test sequence, encoded in JavaScript Object Notation (Json) format and archived on the local storage of the device. It is worth to mention that the Capture module is executed independently and not in parallel with the Application, as otherwise the outcome would be a lower performance for both of them.

Figure 4 Architecture of the capture and replay framework.
The Replay Module can be executed in the mobile device and in a workstation, in conjunction with a mobile emulator. It comprises a Sequence Manager, which de-serializes an input test sequence into main memory, and a Sequence Streamer, which feeds the sensor data to the (emulated) sensor API of the execution environment. The Sequence Streamer runs in a single thread and handles the feeding of multiple sensor values; it synchronizes on the timestamp of the master (i.e., the slowest) sensor: it fetches the next master sensor reading, gets the correlated values of the other sensors and submits them to the execution environment. The submission rate of the Sequence Streamer is dictated by the acquisition timestamps recorded in the field by the Capture Module. To reproduce the context as faithfully as possible, the Sequence Streamer replays the sensor data series as it is, i.e., without checking the ready status of the application. This mimics the fact that in slow devices the processing rate of sensor values (typically the rate at which camera frames can be analyzed) may be lower than the acquisition rate; this causes the loss of some sensor readings during the live conditions, a situation that must be reproduced also in the testing session.
As usual in context-based approaches that include the reproduction of sensed values, the testing environment must support the replacement of the real sensor APIs with mocked-up interfaces that can serve predetermined data. In the case of emulated execution, the emulator makes the supply of archived sensor data transparent to the application. Conversely, execution in the mobile device requires the installation of a sensor emulation library, which exposes its own interface. Therefore, the execution within the testing environment requires an alternate version of the application, in which the native sensor API calls are replaced with calls to the emulated APIs.
Figure 4 also shows the components for extracting the properties necessary for the assessment of soft errors from the test sessions (Logger and Property Observer). These modules are application-specific and are discussed in the next section.
3.2 Implementation
The architecture of Figure 4 was implemented in Java and supports the testing of Android applications (version 4.0 Ice Cream Sandwich and above). The Capture Module has been interfaced with the following sensor APIs: the Android Camera API7, the Google Location Services8, and the Android Sensor API9. The latter provides callbacks for different sensors, including gyroscope, accelerometer, and compass. Such information can be interpolated in order to obtain the resulting rotation matrix and orientation vector.
The Storage Manager serializes sensor data into test sequences represented in the Json format illustrated by the following fragment:
{"imageName":"20170430_115643_b52b96d9_1.jpg",
"rotation":1, "sensorAccuracy":3, "orVector":"[-2.373061,
-0.20468707, 3.1223032]", "rotMatrix":"[0.15508807,
0.71608853, 0.6805881, 0.0, 0.13268146, -0.6978047,
0.70394254, 0.0, 0.97896814, -0.018886, -0.20326078,
0.0, 0.0, 0.0, 0.0, 1.0]", "timestamp":1493546203647}
The value of the camera sensor (frames) are stored externally as files, so that the captured frames can be reused more easily for other purposes (e.g., to build the gold standard data set, see Section 4).
The Sequence Streamer of the Replay Module can be interfaced with the Android Studio Emulator. For execution in the testing environment, the alternate version of the application under test must replace the calls to the Android native APIs with calls to the correspondent emulation library APIs.
The addition of another sensor API requires the following steps: 1) the implementation of a SensorEventListener class that listens to the changes in the sensor, computes the values and notifies this event to the application; 2) the registration of the new SensorEventListener to the Data Acquisition Manager of the Capture Module; 3) the addition of the sensor value representation in the Json format of the test sequence; 4) the implementation of a sensor play-out class and its registration in the Sequence Streamer of the Replay Module.
4 Evaluation in the Case Study
The testing framework described in Section 3 has been applied to the PeakLens mobile application [7], whose interface is shown in Figure 2. The application is designed to work in outdoor conditions; it acquires the user’s location, the orientation of the device from the compass sensor, the motion of the device from the gyroscope and accelerometer, and the current view from the camera frames. It analyzes the incoming camera frames and, for each frame, detects the mountain skyline, marks the peaks visible on the skyline with an icon, and labels each identified peak with relevant metadata (name, altitude and/or distance from the viewer). The skyline extraction relies on a computer vision component that analyses the camera frame and detects the pixels in the image that correspond to the skyline (Figure 5 shows an example of the skyline detection).
The peak identification and labeling function exploits a Digital Elevation Model (DEM) of the Earth and a repository of peak metadata and matches the mountain summits of the DEM to the skyline peaks extracted from the camera frame, to compute the correct 2D screen coordinates of the visible peaks. The matching procedure is the core of the application: the user’s location, the device orientation values, and the camera field of view are exploited to generate a bidimensional virtual panorama from the DEM point cloud (Figure 6 shows an example of the virtual panorama generated from the DEM). Then, the DEM and the peaks metadata repository are queried to determine the list of visible peaks, given the position and orientation of the device; hidden peaks masked by the terrain configuration are excluded; the artificial skyline from the virtual panorama (shown in Figure 6) is aligned with the skyline extracted from the frame (shown in Figure 5) and the visible peaks are projected from the 3D space to the 2D space, obtaining the screen coordinates. Based on the 2D coordinates, the visible peaks are ranked by a visual relevance criterion, which is applied in the cases in which more peaks are visible than could displayed on the device small screen. Finally, a GUI component selects the peaks to show based on the ranking and the size of the screen and overlays the peak positions and metadata, producing the visualization shown in Figure 210. The motion sensors are used to trigger the recomputation of the 2D peak positions when the user moves the device. For offline usage, the DEM and the peak metadata repository have been segmented and compressed and can be downloaded and queried in the mobile device, in absence of Internet connectivity.
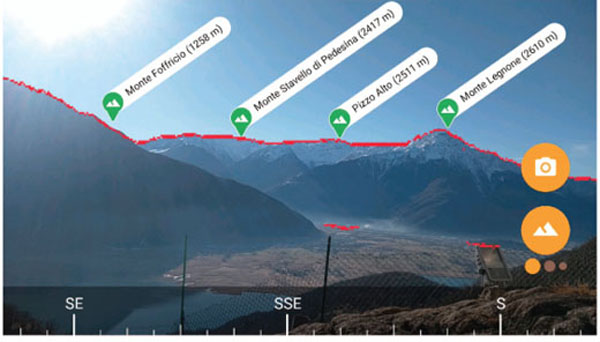
Figure 5 The skyline extracted from the computer vision module from the frame of Figure 2.
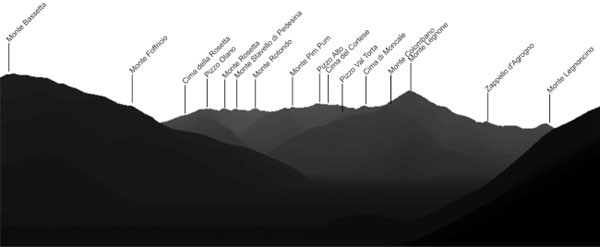
Figure 6 The virtual panorama computed from the DEM, queried with same location and orientation of the device that produces the screen image of Figure 2.
The essential factor that impacts the quality of the users experience is the accuracy of labeling the peaks framed by the camera. As Figure 3 shows, an error in the computation of the screen coordinates of one or more peaks deeply compromises the utility of the application, as clearly revealed by the user’s reviews. In the ideal situation, the application must be able to precisely identify the screen coordinates of the mountain summits that appear in the framed scene and visualize the metadata in the correct places. Soft errors in the computation of the coordinates of peaks can be revealed by comparing the screens produced by the application with a sequence of artificial screens created by a user who manually labels images, as explained in the Section 4.1. Such a set of manually annotated images constitutes a gold standard, which can be used to compute the value of metrics that quantify the quality of the user’s experience, as explained in Section 4.2.
4.1 Test Sequence Acquisition and Gold Standard Creation
The gold standard for assessing the application is defined as a sequence of camera frames, in which each frame portraits an outdoor scene with a mountain skyline and is associated with the set of 2D screen coordinates of (some of) the visible peaks on the skyline.
An effective way to build such a gold standard sequence is to employ the same Capture Module that is used to record the multi-sensor test sequences; from a such sequence it is possible to extract the individual camera frames, and manually annotate them with the 2D coordinates of visible peaks. In the case study, the Capture Module has been employed by a panel of beta testers to gather sequences in diverse mountainous areas around the world.
To support the manual annotation of the peak coordinates in the camera frames, the crowdsourcing Web application (called Peak Annotator) shown in Figure 7 has been created.
This Web interface allows a crowd worker to upload a new sequence of multiple frames or to annotate an already existing one. When a sequence is opened, its first frame is displayed, as shown in Figure 7. To accelerate the work and allow also non experts to annotate frames, a suggestion about which peaks should be visible is computed and displayed. To this end, the DEM is queried with the position and orientation extracted from the test sequence, a virtual panorama with the candidate visible peaks is displayed in the background of the current frame, as illustrated in Figure 7; the worker can simply drag and drop the suggested peak icons to position them in the correct place in the camera frame. Since the default size of a captured sequence is 500 frames, the manual creation of the gold sequences with the Peak Annotator may be a labor-intensive task. To speed-up the process, the Peak Annotator contains a Next button, which shows the successive frame in the sequence with the peaks already pre-positioned on the skyline. The pre-positioning of peaks is performed by exploiting the screen coordinates of the preceding frame and applying a correction based on the projection of the current sensor orientation. Since the frames in the sequence are recorded at a high rate (typically close to 30 per second) and device movements during the capture are slow and continuous, such a simple peak pre-positioning procedure is extremely effective in placing peaks by default; with this simple technique, the number of drag and drop interactions needed to annotate a full sequence is dramatically reduced: down to less than 10% of the peak positions need to be corrected after annotating the first frame. As a further aid to evaluate the quality of the gold standard, the Peak Annotator contains a Play button, whereby the user can play out the annotate sequence.

Figure 7 Crowdsourcing user interface for manually annotating the positions of peaks in a sequence of frames. The user can: 1) drag into the correct position (shown in green) candidate peaks suggested by the system; 2) mark candidate peaks as not visible in the frame (shown in red).
In the case study, 56 sequences have been captured and manually annotated, comprising from 100 to 500 frames. They were taken with different devices, under very diverse conditions and locations around the world, and comprise some extremely challenging scenarios. The annotation time of a sequence ranges from less than 5 minutes to around 25 minutes, the longest time being necessary for 500 frames sequences with a lot of fast and irregular device motion during the capture. Afterwards, a cross-validation task to verify the correctness of the annotations has been performed, preserving as a result 50 correctly annotated sequences.
Furthermore, it is worth to mention the fact that in order to apply the presented testing framework to other use cases, they would require to instantiate their own customized tool for the construction of the corresponding gold standard. The gold standard definition highly depends on the underlying problem and can not be completely abstracted and generalized. Nonetheless, the components of the interface developed for PeakLens can be taken as baseline and further adapted for other applications without considerable effort.
4.2 Defects and Output Quality Metrics
In complex multi-sensor outdoor applications, the success of the application depends primarily on non-functional features such as the accuracy of the outputs, while other functions, such as the user interface, storage and network connectivity management are comparatively simpler to implement and converge to stability more easily. In the case study, the following metrics have been defined to quantify the defects in peak positioning that may lower the accuracy of the application. Most of them are rather generic and their application may be suitable for other use cases focused on the augmentation of other elements of interest instead of mountain peaks.
The Accuracy measures the fraction of peaks correctly handled, which takes into consideration both visible peaks in the gold standard that are projected in the frame and not visible peaks in the gold standard that are not projected in the frame. The sequence accuracy is the average of its frames.
The Precision indicator measures the fraction of peaks positioned in a certain frame of a sequence that are relevant (i.e., appeared also in the same frame of the gold sequence). The overall sequence precision is the average of the precision of every frame. It measures the quantity of false peak positions generated by the application.
The Recall metric measures the fraction of peaks present in the frame of the gold sequence that appears also in the corresponding frame of the tested sequence. It evaluates the erroneous omission of peaks from a frame in which they should appear11. The sequence recall is the average of its frames.
The Average Angular Error (AAE) metric quantifies the positioning errors of all the peaks w.r.t. to the position in the gold sequence. Given a frame, for each visible peak i = 1,...,n let (xi ,yi ) be the on-screen coordinates computed by the application under test, while be the coordinates stored in the gold sequence. The angular error in the position of the i-th peak is defined as:
where
the angular distance (in degrees) between the tested and gold coordinate along the azimuth axis, given the circular symmetry, f is the horizontal Field Of View (in degrees) of the camera and w is the width (in pixels) of the image. The definition of the angular distance along the roll axis is similar. The angular error of a whole sequence is defined as the average error over all its frames.
Finally, the Perceived Quality (PQ) metric measures the percentage of the frames of a sequence that are “good enough”. This indicator can be regarded as the fraction of the entire sequence time during which the user experience was satisfactory. The definition of “good” is based on the other metrics: a frame is good if its average angular error is lower, while peak precision and recall are higher than given thresholds. In the case study, after several experiments, the thresholds have been fixed at 3deg, 0.75 and 0.75 for the three indicators, respectively.
In general, Perceived Quality is the most representative metric at first sight, because it summarizes all the other ones. However, low values of the other indicators may be effective in directing the search for a defect.
Frames that do not contain annotated peaks were not considered for the evaluation. Otherwise, metrics such as the Average Angular Error would be computed as 0 for them, which would affect the metric computation rendering it not so realistic.
4.3 Evaluation Testing Results
The testing consist on applying the framework described in Section 3 to the gold sequences built as explained in Section 4.1 to evaluate the application quality. The detection of low values of the indicators signals the insurgence of defects, and the worsening of a value after a software update highlights potential regression errors. Note that regression errors are particularly relevant, because the computer vision module at the base of the peak positioning methods contains various complex heuristics and a machine learning submodule, which can be retrained with new data to try and achieve better accuracy, and is configured with multiple parameters, which trade accuracy with respect to memory footprint and execution speed. Often a software update aiming at one objective may detriment a conflicting one.
We comment the evaluation of PeakLens for 50 gold sequences and 3 application releases, which has been executed on a Google Pixel device. Furthermore, taking into account the fact that a replay is non deterministic and that an intensive usage of a phone may affect its performance, we opted for executing such replays with small pauses programmed in between. The summarized evaluation results are displayed in Table 1, while the complete evaluation results are reported in Table A.1 in Appendix A. Due to particularly high sensor noise detected at the beginning of the sequences, the first 25 frames of each of them were not considered for the evaluation.
The first application release (SENSOR) represents our baseline, provided that it does not include any intelligent computer vision module analyzing the frames captured by the camera, but just projects the peaks based on the orientation sensor values of the device. The resulting mean and median values of the Average Angular Error and Perceived Quality are rather low, which would probably imply a non satisfactory user experience.
The second application release displayed in the tables reports the indicators for RELEASE A. This version already features the sophisticated computer vision module, which improves significantly the performance of the application achieving an increment in all the overall metrics. Nonetheless, there are a few sequences in which the baseline SENSOR version had a more acceptable performance. By inspecting such sequences we were able to determine that many of these cases are due to flat terrains and uncertain alignments between frame skyline and terrain. Such cases could be improved by introducing specific heuristics able to detect them and to proceed by using just the orientation sensors.
Table 1 Summarized evaluation testing results
| SENSOR | RELEASE A | RELEASE B | |||||||||||||
| Accuracy | Precision | Recall | AAE | PQ | Accuracy | Precision | Recall | AAE | PQ | Accuracy | Precision | Recall | AAE | PQ | |
| (%) | (%) | (%) | ? | (%) | (%) | (%) | (%) | ? | (%) | (%) | (%) | (%) | ? | (%) | |
| Mean | 90,53 | 81,27 | 85,07 | 10,65 | 21,90 | 92,79 | 84,41 | 88,80 | 6,97 | 55,65 | 93,48 | 86,12 | 88,82 | 5,48 | 58,43 |
| Median | 94,14 | 88,83 | 94,75 | 6,00 | 0,55 | 95,54 | 93,06 | 97,78 | 2,15 | 71,17 | 96,65 | 94,09 | 97,88 | 1,95 | 72,75 |
Finally, the last column of the tables refer to RELEASE B, a version that introduced some modifications regarding the machine learning submodule that detects the mountain skyline for the frames, followed by a different post-processing step that is subsequently aligned with respect to the terrain. Overall, the testing framework gave an effective feedback on the new version; the Perceived Quality has not been affected with respect to the previous version and therefore the performance of the release was considered acceptable.
It is worth to mention that the batch replay evaluations can be immediately aborted to save time in case of detecting the insurgence of obvious defects in the first iterations. In the past, we have experienced such situation when dealing with bugs due to scale factor issues, incorrect vertical offset projections and the manifestation of diverse problems with the computer vision module. PQ decreased strongly in such cases, with sensible angular error increase and loss of both precision and recall. Sequence replay permitted us to locate the wrongly positioned peaks and to remove the defect. The overall results obtained by the testing framework are significantly informative, but so can be the visual inspection of the simulations in order to identify and correct specific bugs that may appear in under specific scenarios or conditions.
5 Discussion
In this section, we discuss the limits to generalization of the proposed framework by covering the most challenging issues to tackle and we also assess the fidelity of the multi-sensor context simulation by experimenting with a set of mobile devices.
5.1 Limits to Generalization
The testing framework illustrated in Section 3 has been implemented with both the general aim of supporting multi-sensor application testing and with the specific objective of putting it to work in the development and maintenance of a specific application. Retrospectively, the resulting architecture exhibits dependencies on the mobile operating system, on the emulation environment and on the application under test.
The Capture Module of Figure 4 is the most general component, depending only on the native sensor APIs of the Operating System. It can be extended to new types of sensors (e.g., temperature) simply by following the steps presented in Section 3.2. The temporal correlation of the multiple sensor streams is achieved by synchronizing on a master sensor. This policy is normally applied to synchronize on the slowest sensor; however, it is also possible to elect any sensor as the master and synchronize the other streams on its callbacks; for example, one may define the GPS position sensor a the master and read from the other sensors only when an update of the location occurs.
The Replay Module has a dependency on the virtual sensor APIs, both in the emulated and in-device execution environment. The Sequence Streamer is coupled to the sensor emulation libraries.
5.2 Limits to Fidelity
As in the work of Rege et al. [1], we have evaluated the limits in the reconstruction of realistic working conditions during the testing process. Also in our case study, the most significant challenge is the faithful reproduction of the functioning of the camera sensor, which is the most difficult to simulate. Since the camera sensor is the slowest one, on which the readings of the remaining sensors depend, a prominent goal of the testing process is to achieve a frame replay rate in the testing framework as close as possible to the one observed during the execution of the application in field conditions. This entails that the Capture and Replay modules should be able to acquire frames and replay them at the same rate as the real application.
Table 2 reports the camera frame acquisition rates observed in a set of mobile devices, chosen to have a representative range going from medium-end models (LG G5) to high-end (Google Pixel) models. The results may vary depending on the adopted frame size; the size considered in the case study is 640x480 pixels, which is the one normally used in the case of study for the image analysis in mobile devices.
In general, the Capture module achieves a slightly higher frame rate than the camera preview in the normal execution of the application. This is due to the fact that the application execution requires more system resources for running the computer vision algorithms. Conversely, the Replay module achieves a lower frame rate. The reason is that camera frames are read from secondary storage, which is slower than the access to the frames from the camera sensor. Despite these differences, the Replay module executed in the mobile device still represents a sufficiently good approximation of the real functioning of the application.
The execution in the Android Emulator with the default configuration parameters yielded an extremely low frame rate for the camera preview (6fps at maximum). The Android Emulator can be configured to exploit hardware acceleration using the Graphics Processing Unit (GPU) of the host workstation, thus achieving a frame rate close to the one observed in field conditions. However, in a data-intensive application as the one presented in the case study, such acceleration alters the computation power of the emulated device, and thus results in a far less realistic simulation. To the best of our knowledge, Android Emulators are still unable to replicate realistically the performance of both camera sensors and processors of real devices, which makes them not yet ideal for testing multi-sensor mobile applications with real-time data processing requirements over camera frame data. For this reason, we did not proceed with the implementation of the Replay module on top of the Emulator environment.
Table 2 Comparison of the frame processing rates in the application, in the Capture module and in the Replay module executed in the mobile device
| Phone Model | App (fps) | Capture (fps) | Replay (fps) |
| Google Pixel | 30 | 30 | 27 |
| Motorola Nexus 6 | 28 | 29 | 22 |
| LG Nexus 5x | 27 | 28 | 20 |
| LG G5 SE | 24 | 30 | 17 |
6 Conclusions
We have presented a capture and replay framework for the testing of mobile applications that depend on multiple correlated sensor streams. We have reported a case study in which the framework has supported the development of an outdoor mountain peak identification mobile application, where the input stream is heterogeneous and contains noisy sensor data, and the output is the sequence of 2D coordinates of relevant objects in the camera frames. Future work will concentrate on generalizing the framework by instantiating it for other use case; incorporating the capture and replay also of GUI events, so to achieve the automated testing of application usage sequences including user’s gestures; on the integration of the framework with cloud-enabled mobile execution services, such as e.g., Amazon AWS Mobile Farm12; on the experimentation with mobile emulation platforms to achieve a more realistic reproduction of field conditions; and on the construction of a web version of the testing framework whereby developers could execute the entire testing process completely online.
Appendix A
Table A.1 Complete evaluation testing results
| SENSOR | RELEASE A | RELEASE B | |||||||||||||
| Accuracy | Precision | Recall | AAE | PQ | Accuracy | Precision | Recall | AAE | PQ | Accuracy | Precision | Recall | AAE | PQ | |
| # | (%) | (%) | (%) | (?) | (%) | (%) | (%) | (%) | (?) | (%) | (%) | (%) | (%) | (?) | (%) |
| 1 | 96,50 | 100,00 | 87,16 | 15,12 | 0,00 | 99,62 | 99,68 | 99,02 | 2,06 | 77,05 | 96,67 | 99,26 | 88,77 | 6,50 | 32,00 |
| 2 | 86,09 | 80,62 | 73,30 | 14,60 | 0,00 | 97,53 | 95,56 | 98,58 | 2,13 | 81,18 | 96,93 | 94,31 | 97,42 | 2,18 | 81,18 |
| 3 | 89,46 | 88,14 | 74,89 | 15,39 | 0,00 | 97,52 | 98,11 | 93,95 | 1,09 | 99,79 | 98,87 | 98,67 | 97,79 | 1,42 | 96,63 |
| 4 | 88,62 | 84,26 | 73,00 | 9,28 | 10,65 | 85,79 | 80,99 | 72,52 | 10,07 | 12,11 | 80,87 | 74,09 | 59,81 | 8,76 | 18,64 |
| 5 | 91,68 | 92,70 | 87,56 | 8,68 | 0,00 | 97,87 | 98,45 | 96,60 | 1,34 | 98,52 | 97,45 | 97,33 | 96,66 | 1,47 | 95,57 |
| 6 | 96,33 | 91,95 | 97,05 | 3,70 | 56,84 | 96,44 | 90,91 | 98,02 | 2,45 | 78,32 | 96,67 | 93,07 | 96,02 | 2,60 | 81,68 |
| 7 | 94,89 | 87,99 | 97,82 | 4,08 | 27,22 | 97,11 | 91,88 | 99,76 | 1,20 | 87,50 | 97,64 | 93,92 | 99,76 | 1,14 | 89,44 |
| 8 | 97,80 | 95,93 | 96,24 | 2,81 | 53,47 | 99,33 | 98,34 | 99,19 | 1,25 | 96,21 | 99,27 | 98,19 | 99,20 | 1,31 | 97,05 |
| 9 | 94,98 | 88,93 | 92,00 | 7,85 | 15,58 | 97,65 | 92,58 | 99,32 | 1,04 | 100,00 | 99,53 | 98,96 | 99,39 | 1,18 | 96,84 |
| 10 | 98,56 | 97,25 | 94,86 | 4,94 | 0,68 | 99,22 | 97,71 | 98,19 | 2,09 | 82,25 | 99,57 | 99,01 | 98,84 | 1,60 | 98,63 |
| 11 | 100,00 | 100,00 | 100,00 | 1,92 | 100,00 | 93,75 | 100,00 | 50,00 | 0,51 | 0,00 | 94,19 | 100,00 | 53,51 | 0,71 | 7,02 |
| 12 | 46,29 | 6,39 | 6,65 | 59,09 | 0,00 | 46,93 | 10,25 | 12,34 | 58,38 | 0,00 | 56,69 | 24,68 | 25,00 | 39,94 | 0,00 |
| 13 | 66,78 | 31,53 | 29,71 | 42,82 | 0,00 | 62,04 | 19,48 | 19,68 | 47,33 | 0,00 | 64,47 | 26,44 | 26,16 | 45,13 | 0,00 |
| 14 | 94,54 | 68,22 | 96,88 | 6,09 | 28,97 | 93,95 | 66,24 | 92,60 | 6,33 | 25,70 | 94,22 | 67,33 | 92,99 | 6,87 | 25,70 |
| 15 | 70,69 | 67,30 | 68,26 | 20,64 | 0,00 | 90,73 | 90,36 | 90,35 | 6,38 | 67,94 | 95,87 | 92,58 | 99,16 | 1,72 | 86,12 |
| 16 | 94,51 | 86,66 | 100,00 | 2,14 | 93,97 | 93,46 | 84,31 | 100,00 | 2,04 | 96,12 | 93,46 | 84,74 | 99,25 | 1,59 | 99,14 |
| 17 | 96,62 | 100,00 | 91,54 | 6,62 | 0,00 | 94,75 | 100,00 | 85,31 | 9,25 | 0,00 | 97,36 | 100,00 | 93,40 | 7,16 | 7,42 |
| 18 | 98,13 | 100,00 | 94,76 | 3,02 | 55,86 | 99,06 | 98,07 | 99,31 | 1,91 | 96,55 | 99,26 | 98,07 | 99,86 | 1,68 | 97,93 |
| 19 | 92,90 | 81,02 | 94,83 | 5,82 | 0,42 | 95,92 | 86,19 | 99,74 | 1,34 | 82,95 | 95,56 | 85,45 | 99,38 | 1,39 | 80,63 |
| 20 | 89,32 | 70,20 | 94,25 | 5,69 | 0,31 | 95,13 | 81,73 | 99,03 | 1,56 | 70,22 | 93,77 | 79,20 | 97,60 | 3,12 | 52,98 |
| 21 | 97,91 | 95,30 | 97,64 | 3,45 | 36,42 | 98,79 | 97,16 | 98,96 | 1,43 | 98,95 | 98,72 | 97,14 | 98,79 | 1,58 | 97,89 |
| 22 | 94,20 | 92,74 | 88,33 | 7,66 | 0,00 | 97,49 | 93,55 | 98,58 | 1,73 | 73,63 | 97,57 | 94,27 | 98,10 | 1,92 | 69,62 |
| 23 | 99,52 | 96,89 | 100,00 | 1,60 | 84,86 | 99,63 | 99,59 | 97,97 | 4,21 | 42,70 | 98,73 | 98,78 | 92,97 | 5,54 | 39,73 |
| 24 | 96,77 | 88,73 | 99,92 | 2,48 | 89,95 | 99,11 | 96,87 | 99,92 | 2,39 | 80,90 | 96,63 | 91,98 | 94,29 | 2,08 | 93,47 |
| 25 | 97,25 | 81,16 | 98,37 | 2,94 | 46,29 | 97,21 | 80,69 | 100,00 | 5,41 | 29,97 | 97,61 | 82,49 | 99,70 | 5,57 | 35,31 |
| 26 | 97,27 | 96,52 | 88,90 | 6,14 | 0,00 | 97,56 | 96,10 | 90,22 | 8,28 | 18,39 | 91,17 | 90,99 | 48,32 | 4,33 | 5,04 |
| 27 | 94,41 | 86,50 | 93,19 | 3,08 | 37,37 | 92,96 | 89,69 | 87,15 | 9,82 | 18,79 | 81,07 | 85,30 | 47,97 | 8,32 | 0,00 |
| 28 | 99,65 | 99,95 | 98,92 | 2,11 | 100,00 | 98,27 | 97,76 | 95,99 | 1,25 | 100,00 | 99,15 | 98,55 | 98,49 | 1,13 | 100,00 |
| 29 | 76,34 | 57,30 | 56,42 | 22,09 | 0,00 | 77,91 | 60,38 | 58,46 | 20,55 | 0,00 | 94,25 | 83,82 | 98,53 | 1,50 | 98,04 |
| 30 | 93,61 | 70,42 | 96,51 | 5,45 | 9,42 | 94,47 | 69,55 | 97,03 | 1,93 | 23,04 | 93,61 | 68,85 | 94,42 | 4,45 | 2,62 |
| 31 | 95,46 | 92,82 | 95,76 | 4,48 | 29,18 | 97,64 | 95,79 | 98,64 | 1,51 | 82,56 | 96,53 | 95,20 | 96,56 | 1,50 | 76,16 |
| 32 | 91,37 | 77,24 | 94,74 | 5,32 | 24,63 | 90,48 | 74,82 | 93,22 | 5,21 | 37,68 | 90,48 | 75,20 | 93,73 | 5,59 | 34,11 |
| 33 | 93,04 | 100,00 | 76,03 | 3,88 | 45,88 | 95,15 | 100,00 | 83,53 | 2,17 | 76,47 | 93,87 | 94,85 | 86,52 | 2,97 | 75,88 |
| 34 | 93,75 | 66,67 | 100,00 | 5,97 | 0,00 | 93,75 | 66,67 | 100,00 | 9,35 | 0,00 | 99,68 | 98,31 | 100,00 | 11,77 | 0,00 |
| 35 | 94,07 | 72,08 | 100,00 | 6,40 | 0,00 | 94,52 | 76,06 | 97,59 | 0,79 | 23,10 | 95,23 | 77,50 | 100,00 | 1,48 | 28,93 |
| 36 | 92,87 | 100,00 | 78,60 | 23,82 | 0,00 | 100,00 | 100,00 | 100,00 | 1,66 | 99,56 | 100,00 | 100,00 | 100,00 | 1,14 | 100,00 |
| 37 | 94,07 | 82,14 | 99,83 | 2,44 | 66,84 | 92,69 | 80,70 | 94,64 | 1,52 | 64,29 | 93,28 | 81,63 | 95,58 | 1,45 | 64,80 |
| 38 | 86,54 | 50,48 | 100,96 | 2,20 | 0,00 | 86,95 | 51,44 | 100,96 | 6,03 | 0,00 | 86,54 | 50,48 | 100,96 | 5,39 | 0,00 |
| 39 | 96,36 | 94,36 | 95,08 | 4,21 | 6,37 | 98,32 | 97,73 | 97,46 | 2,48 | 85,14 | 96,83 | 97,26 | 93,06 | 1,63 | 93,84 |
| 40 | 96,36 | 89,68 | 96,09 | 4,94 | 2,95 | 99,43 | 98,77 | 99,00 | 1,33 | 97,26 | 99,19 | 98,21 | 98,74 | 1,36 | 96,63 |
| 41 | 85,50 | 63,54 | 88,60 | 11,39 | 0,00 | 90,24 | 69,33 | 99,58 | 1,42 | 21,47 | 91,21 | 73,58 | 99,72 | 1,83 | 26,11 |
| 42 | 85,99 | 100,00 | 60,53 | 17,95 | 0,00 | 92,60 | 99,58 | 82,07 | 8,02 | 50,74 | 99,61 | 99,09 | 99,72 | 1,54 | 96,21 |
| 43 | 93,09 | 89,89 | 83,47 | 11,48 | 0,00 | 98,32 | 98,00 | 96,95 | 2,66 | 79,58 | 99,19 | 98,95 | 98,63 | 1,34 | 93,89 |
| 44 | 98,35 | 96,12 | 96,42 | 6,03 | 0,00 | 99,38 | 98,02 | 99,25 | 1,84 | 95,58 | 98,76 | 94,30 | 99,49 | 1,55 | 88,21 |
| 45 | 92,06 | 89,40 | 77,16 | 19,98 | 0,00 | 94,48 | 89,65 | 88,53 | 16,93 | 0,00 | 93,05 | 90,14 | 80,74 | 19,83 | 0,00 |
| 46 | 75,58 | 52,08 | 74,39 | 17,05 | 0,00 | 92,91 | 79,07 | 100,00 | 3,70 | 66,74 | 93,16 | 80,41 | 99,37 | 2,62 | 68,63 |
| 47 | 57,05 | 2,24 | 2,24 | 59,49 | 0,00 | 59,29 | 12,18 | 12,18 | 42,21 | 0,00 | 69,55 | 31,41 | 31,41 | 16,79 | 23,72 |
| 48 | 76,42 | 60,14 | 69,65 | 18,92 | 1,68 | 82,18 | 71,05 | 76,81 | 17,85 | 17,89 | 83,75 | 72,46 | 79,09 | 15,80 | 17,26 |
| 49 | 98,46 | 100,00 | 97,06 | 6,66 | 0,00 | 98,91 | 99,57 | 98,08 | 2,94 | 72,12 | 98,91 | 99,79 | 98,40 | 1,99 | 81,09 |
| 50 | 98,37 | 100,00 | 98,16 | 2,34 | 69,05 | 94,95 | 99,86 | 93,51 | 2,04 | 73,68 | 98,21 | 99,74 | 97,96 | 2,41 | 69,47 |
| Mean | 90,53 | 81,27 | 85,07 | 10,65 | 21,90 | 92,79 | 84,41 | 88,80 | 6,97 | 55,65 | 93,48 | 86,12 | 88,82 | 5,48 | 58,43 |
| Median | 94,14 | 88,83 | 94,75 | 6,00 | 0,55 | 95,54 | 93,06 | 97,78 | 2,15 | 71,17 | 96,65 | 94,09 | 97,88 | 1,95 | 72,75 |
References
[1] Manoj R Rege, Vlado Handziski, and Adam Wolisz. Realistic context generation for mobile app testing and performance evaluation. In Pervasive Computing and Communications (PerCom), 2017 IEEE International Conference on, pages 297–308. IEEE, 2017. [2] Vaninha Vieira, Konstantin Holl, and Michael Hassel. A context simulator as testing support for mobile apps. In Roger L. Wainwright, Juan Manuel Corchado, Alessio Bechini, and Jiman Hong, editors, Proceedings of the 30th Annual ACM Symposium on Applied Computing, Salamanca, Spain, April 13-17, 2015, pages 535–541. ACM, 2015.
[3] Chieh-Jan Mike Liang, Nicholas D. Lane, Niels Brouwers, Li Zhang, Börje Karlsson, Hao Liu, Yan Liu, Jun Tang, Xiang Shan, Ranveer Chandra, and Feng Zhao. Caiipa: automated large-scale mobile app testing through contextual fuzzing. In Sung-Ju Lee, Ashutosh Sabharwal, and Prasun Sinha, editors, The 20th Annual International Conference on Mobile Computing and Networking, MobiCom’14, Maui, HI, USA, September 7-11, 2014, pages 519–530. ACM, 2014.
[4] Jeffrey R Blum, Daniel G Greencorn, and Jeremy R Cooperstock. Smartphone sensor reliability for augmented reality applications. In International Conference on Mobile and Ubiquitous Systems: Computing, Networking, and Services, pages 127–138. Springer, 2012.
[5] Gustavo Maglhaes Moura and Rodrigo Luis De Souza Da Silva. Analysis and evaluation of feature detection and tracking techniques using open cv with focus on markerless augmented reality applications. J. Mobile Multimedia, 12(3&4):291–302, 2017.
[6] Carlos GR Santos, Tiago Araújo, Paulo R Chagas, Nelson Neto, and Bianchi S Meiguins. Recognizing and exploring azulejos on historic buildings’ facades by combining computer vision and geolocation in mobile augmented reality applications. Journal of Mobile Multimedia, 13(1-2):57–74, 2017.
[7] Roman Fedorov, Darian Frajberg, and Piero Fraternali. A framework for outdoor mobile augmented reality and its application to mountain peak detection. In International Conference on Augmented Reality, Virtual Reality and Computer Graphics, pages 281–301. Springer, 2016.
[8] Giovanni Taverriti, Stefano Lombini, Lorenzo Seidenari, Marco Bertini, and Alberto Del Bimbo. Real-time wearable computer vision system for improved museum experience. In Proceedings of the 2016 ACM on Multimedia Conference, pages 703–704. ACM, 2016.
[9] Roberta Calegari, Mirco Musolesi, Franco Raimondi, and Cecilia Mascolo. Ctg: A connectivity trace generator for testing the performance of opportunistic mobile systems. In Proceedings of the the 6th joint meeting of the European software engineering conference and the ACM SIGSOFT symposium on The foundations of software engineering, pages 415–424. ACM, 2007.
[10] Arvind Thiagarajan, Lenin Ravindranath, Katrina LaCurts, Samuel Madden, Hari Balakrishnan, Sivan Toledo, and Jakob Eriksson. Vtrack: accurate, energy-aware road traffic delay estimation using mobile phones. In Proceedings of the 7th ACM conference on embedded networked sensor systems, pages 85–98. ACM, 2009.
[11] Nils Aschenbruck, Raphael Ernst, Elmar Gerhards-Padilla, and Matthias Schwamborn. Bonnmotion: A mobility scenario generation and analysis tool. In Proceedings of the 3rd International ICST Conference on Simulation Tools and Techniques, SIMUTools ’10, pages 51:1–51:10, ICST, Brussels, Belgium, Belgium, 2010. ICST (Institute for Computer Sciences, Social-Informatics and Telecommunications Engineering).
[12] Carlo Bernaschina, Roman Fedorov, Darian Frajberg, and Piero Fraternali. A framework for regression testing of outdoor mobile applications. In Proceedings of the 4th International Conference on Mobile Software Engineering and Systems, pages 179–181. IEEE Press, 2017.
[13] Henry Muccini, Antonio Di Francesco, and Patrizio Esposito. Software testing of mobile applications: Challenges and future research directions. In Proceedings of the 7th International Workshop on Automation of Software Test, pages 29–35. IEEE Press, 2012.
[14] Xing Su, Hanghang Tong, and Ping Ji. Activity recognition with smartphone sensors. Tsinghua Science and Technology, 19(3):235–249, 2014.
[15] Ana Javornik. Augmented reality: Research agenda for studying the impact of its media characteristics on consumer behaviour. Journal of Retailing and Consumer Services, 30:252–261, 2016.
[16] Gregory D. Abowd, Anind K. Dey, Peter J. Brown, Nigel Davies, Mark Smith, and Pete Steggles. Towards a better understanding of context and context-awareness. In Hans-Werner Gellersen, editor, Handheld and Ubiquitous Computing, First International Symposium, HUC’99, Karlsruhe, Germany, September 27-29, 1999, Proceedings, volume 1707 of Lecture Notes in Computer Science, pages 304–307. Springer, 1999.
[17] Claudio Bettini, Oliver Brdiczka, Karen Henricksen, Jadwiga Indulska, Daniela Nicklas, Anand Ranganathan, and Daniele Riboni. A survey of context modelling and reasoning techniques. Pervasive and Mobile Computing, 6(2):161–180, 2010.
[18] Guanling Chen and David Kotz. A survey of context-aware mobile computing research. Technical report, Hanover, NH, USA, 2000.
[19] Lenin Ravindranath, Suman Nath, Jitendra Padhye, and Hari Balakrishnan. Automatic and scalable fault detection for mobile applications. In Proceedings of the 12th Annual International Conference on Mobile Systems, Applications, and Services, MobiSys ’14, pages 190–203, New York, NY, USA, 2014. ACM.
[20] Aravind Machiry, Rohan Tahiliani, and Mayur Naik. Dynodroid: An input generation system for android apps. In Proceedings of the 2013 9th Joint Meeting on Foundations of Software Engineering, ESEC/FSE 2013, pages 224–234, New York, NY, USA, 2013. ACM.
[21] Lee J White. Regression testing of gui event interactions. In Software Maintenance 1996, Proceedings., International Conference on, pages 350–358. IEEE, 1996.
[22] Omar El Ariss, Dianxiang Xu, Santosh Dandey, Brad Vender, Phil McClean, and Brian Slator. A systematic capture and replay strategy for testing complex gui based java applications. In Information Technology: New Generations (ITNG), 2010 Seventh International Conference on, pages 1038–1043. IEEE, 2010.
[23] Lorenzo Gomez, Iulian Neamtiu, Tanzirul Azim, and Todd Millstein. Reran: Timing-and touch-sensitive record and replay for android. In 2013 35th International Conference on Software Engineering (ICSE), pages 72–81. IEEE, 2013.
[24] Shrinivas Joshi and Alessandro Orso. SCARPE: A technique and tool for selective capture and replay of program executions. In 23rd IEEE International Conference on Software Maintenance (ICSM 2007), October 2-5, 2007, Paris, France, pages 234–243. IEEE, 2007.
Biographies
Darian Frajberg is a Ph.D. Candidate in Information Technology at DEIB, Politecnico di Milano, Italy. His main research interests concern Artificial Intelligence, Computer Vision and Augmented Reality, with a focus on the creation and evaluation of novel entertainment solutions for outdoor Augmented Reality applications efficiently executable on low-power mobile devices.

Piero Fraternali is full professor of Web Technologies at DEIB, Politecnico di Milano, Italy. His main research interests concern software engineering, methodologies and tools for Web and mobile application development, with a focus on code generation from software models, multimedia content processing, and augmented reality mobile applications.

Rocio Nahime Torres is a Ph.D. Candidate in Information Technology at DEIB, Politecnico di Milano, Italy. Her main research interests concern Artificial Intelligence, Computer Vision and Volunteer Geographic Information Systems, with a focus on novel methods for open source geographic data enrichment.

Carlo Bernaschina is a Ph.D. Candidate of Web and Mobile Technologies at DEIB, Politecnico di Milano, Italy. His main research interests concern software engineering, methodologies and tools for Mobile and IoT application development, with a focus on code generation from software models and agile methodologies.
Roman Fedorov received the Ph.D. (cum laude) degree in Information Technology from Politecnico di Milano, Italy, in 2017 at DEIB. His research interests are in the areas of collective intelligence extraction from user-generated content and social data mining and analysis.
Journal of Mobile Multimedia, Vol. 15 1&2, 1–28.
doi: 10.13052/jmm1550-4646.15121
© 2019 River Publishers
1http://maps.google.com
2http://www.mtrip.com
3http://connect.garmin.com
4http://www.pokemongo.com
5http://www.peaklens.com
6http://peakar.salzburgresearch.at
7https://developer.android.com/guide/topics/media/camera.html [accessed 10 April 2019]
8https://developers.google.com/android/reference/com/google/android/gms/location/LocationServices [accessed 10 April 2019]
9https://developers.android.com/guide/topics/sensors/sensors overview.html [accessed 10 April 2019]
10The GUI comprises a More peaks button (bottom in Figure 2) to show the peaks that could not fit in the screen.
11The erroneous omission of a peak may result by, e.g, the wrong computation of peaks occluded by the terrain configuration.
12https://aws.amazon.com/device-farm/ [accessed 10 April 2019]