Identity – Attribute Inference in Online Social Network(s) Using Bio-Inspired Algorithms and Machine Learning Approaches
Nisha P. Shetty1, Balachandra Muniyal1,*, Daita Ravi Teja1, Leander Melroy Maben2 and Tummala Srinag Vinil1
1Department of Information and Communication Technology, Manipal Institute of Technology, Manipal Academy of Higher Education, Manipal-567104, India
2Department of Computer Science and Engineering, Manipal Institute of Technology, Manipal Academy of Higher Education, Manipal-567104, India
E-mail: bala.chandra@manipal.edu
*Corresponding Author
Received 08 July 2022; Accepted 18 August 2022; Publication 15 February 2023
Abstract
Twitter is one of the most popular social networking sites today, and it has become a critical tool for gathering data from numerous individuals throughout the world. The platform hosts a variety of debates spanning from current events and news to entertainment, advertising, and technology. In contrast to earlier approaches, the proposed work employs the concept of both direct (via tweets) and indirect stance detection (via homophily elements) to infer sensitive attributes. Along with attribute-based inference, the proposed work also matches user profiles across cross platforms via user-generated posts. Unlike prior efforts, usernames are not included in the feature set here since they are a bit of a giveaway. Bio-inspired algorithms are used along with ensemble methods to extract the best set of features.
Keywords: Identity inference, bio-inspired algorithms, ensemble, homophily, attribute inference.
1 Introduction
SOCIAL networks have become an essential aspect of today’s age for the sharing of information and opinions. Twitter, with over 1.45 billion registered users and 330 million monthly active users, sends almost 500 million tweets every day [1]. In nations such as the United States, Japan, and India, Twitter is the most widely used microblogging site. Because of its popularity, researchers have begun to investigate its contents to discover hidden patterns.
A person’s virtual avatar is represented by data from online social networks (OSN). It integrates relationships, views, opinions, personally identifiable information, and so on, and its profiles and communities reflect these. OSN data may be represented mathematically as G= (V, E), where V denotes actors (individuals, teams, etc.), and E denotes linkages or connections between the nodes [2]. Figure 1 depicts social networks graphically.
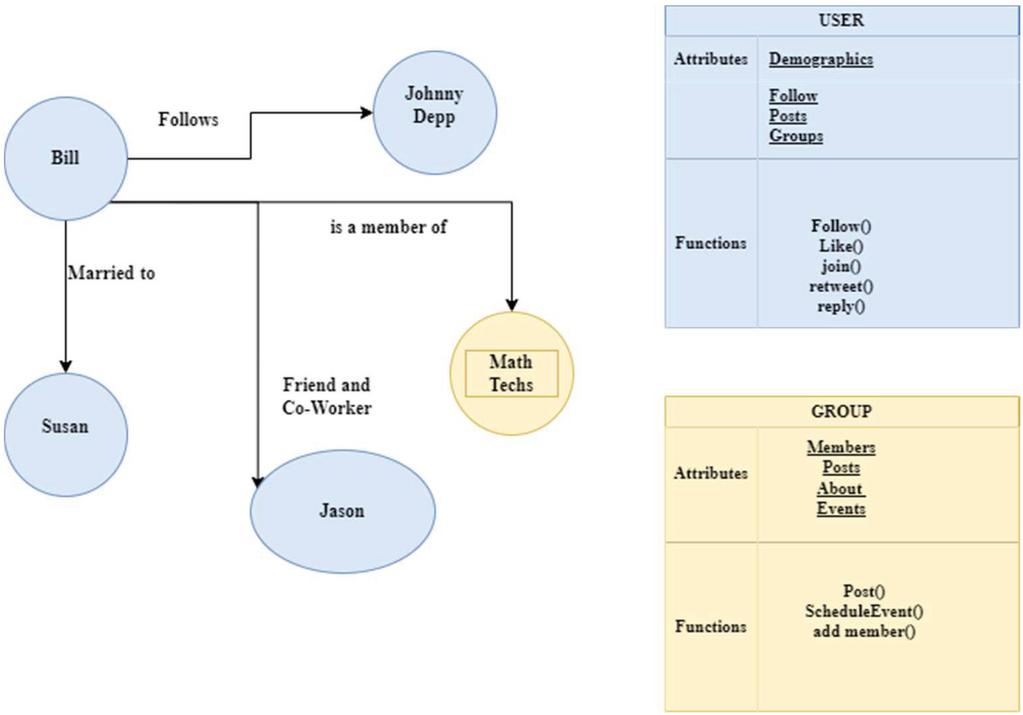
Figure 1 Graphical Representation of OSN [2].
1.1 Classification of Privacy Breach [3]
1. Identity disclosure: Using data from a real-life person’s social network to correctly identify him. It exposes the person and the types of relationships he has with his friends and acquaintances.
2. Sensitive link disclosure: This exposes the relationship between users, which they preferably like to keep hidden. Sometimes an affiliation link disclosure also occurs in social networks, wherein users of a community or a particular group are revealed. This type of disclosure can be used to infer the likes, preferences, etc., of the individual.
3. Sensitive Attribute disclosure: Attributes generally fall into three categories.
’ Identifying attributes— unique attributes, such as Social Security Number.
’ Quasi-identifying attributes—a set of attributes that identifies a person. For example, name and date of birth.
’ Sensitive attributes—attributes that people prefer to keep hidden, such as sexual orientation.
Twitter has grown in popularity as a political campaigning tool and is a means of contact between politicians and citizens in recent years. A considerable number of Twitter users share their thoughts and actively participate in debates, political or otherwise, and many notable political figures have also been actively engaging with people via Twitter. These elements have made Twitter a reliable tool for determining a person’s emotional state and political ideologies.
Homophily and social media influence are the two most frequent psychological qualities seen in social media. Homophily is the inclination of users to engage with persons who share similar interests. Social media influence emphasizes the notion that people’s attitudes are influenced by their peers in their social circle [4].
In this era of the Internet, users subscribe to more than one social network, dispensing their data in various ways. Instagram, for example, is popular for photo sharing, Twitter and Facebook are popular for posting and connecting with friends, LinkedIn is popular for sharing job and skillset-related information, and e-commerce giants like Amazon, Pinterest, and others are popular buying platforms. User profiles on a single platform are often incomplete, but when they are successfully amalgamated, they aid in enhancing online services like recommendation systems, community detection systems, etc. For identity resolution, feature extraction has a huge influence on the accuracy of the classifiers Currently, most of the work focuses on profile-centric features like bio, education, occupation, photos, friend circle, etc. However, this information often remains inaccessible owing to privacy concerns and can be easily duplicated by sybils. But user-generated content like posts, URLs, tweets, etc., are often unadulterated and can serve as the best corpus to infer user interests, thereby resolving the user’s identity. The motivation for the work is to identify spam users who duplicate profiles with publicly available information. They intend to extort money from unsuspecting friends or gain some crucial information. Such users, however, will not be able to duplicate implicit content and can be identified easily.
The remainder of the paper is arranged in this manner. In the constituent sections of this study, Section 2 discusses the most significant and recent studies. Section 3 contains a detailed overview of the suggested technique. The acquired results are discussed in Section 4 together with appropriate error analysis. In Section 5, the study concludes with a discussion of some potential future work.
2 Related Works
The projected study can be divided into two primary domains, each of which has produced several remarkable results. The following is a list of some of the recently referenced works.
2.1 Attribute Inference
Budiharto and Meiliana [5] (2018) used sentiment analysis to forecast Indonesians’ favorite political leaders. The polarity of the tweets was determined by totaling the amount of positive and negative phrases for each leader. This was bolstered with likes and retweets in favor of a leader. The suggested work contains additional user signals in comparison to acquire more information on the target user’s inclination.
Alaoui et al. [6] (2018) investigated the semantic meaning of tweets and created a tagged corpus using important hashtags used by each party. Different priority scores were assigned to elongated words. The impact of a tweet was emphasized by including retweets and likes (more retweets/likes indicated a stronger liking for that party). The suggested approach outperformed Google Cloud Prediction API and Nave Bayes. However, as stated by the authors, expanding their sample size can significantly enhance their results.
Mirko Lai et al. [7] (2019) assessed users’ perspectives on the modifications made to the Italian Constitution by examining tweets and network elements including retweets, mentions, reply-to, and follower/follower interactions. Their finding that followers/following, mentions, and retweets can all display homophily is supported by the inference drawn from our experiments. They established that disagreements might be stated via reply-to, which will be used in our future analyses. The authors want to explore the impact of a notable person/bot on the discernment of his peers in the future.
In their data collection, created by Sailunaz and Alhajj [8] (2019), tweets and replies were examined for the feelings and emotions conveyed by them. The number of followers, retweets, likes, etc. were also used to calculate the user’s impact. The authors’ method allowed them to produce a personalized recommendation system. However, their tests were limited to basic texts that were tailored to their technique. It must be upgraded to deal with the random abbreviations, emoticons, hashtags, and so on that are common in an open platform.
Likes, engagements (mention, retweet, and responses), connections (follow), and linguistic content were analyzed by Aldayel and Magdy [9] (2019). The stances were examined using the linear SVM, which yielded encouraging results. This system had several serious flaws, one of which was that it believed retweets, responses, and mentions were always supportive. Due to a skewed and restricted dataset, the postulated classifier frequently incorrectly categorized the “none” stance into any of the classifications.
Sharma and Ghose [10] (2020) examined Twitter data in the context of India’s general elections. Data collection and preprocessing for their investigation employed R tools. R and Rapid Miner’s Alyien were used to evaluate the tweet’s sentiment (for or against), polarity, and subjectivity. Since the study’s scope was strictly confined to studying tweets, it may be expanded to include multimedia, hashtags, etc. A notable issue discovered was that when collecting tweets, the location was not generalized, resulting in a bias in the study.
Mohd. Zeeshan Ansari et al. [11] (2020) used twitter analysis to examine the political situation in India. Even though the majority of the classifiers (LSTM, Decision Tree, Random Forest, SVM, and Logistic Regression) utilized in their research are similar to those in ours, labeling using human annotators did not provide them with a suitable corpus. Future work in this sector would entail employing semi-supervised classifiers to integrate better resources (with more jargon and slang) to improve classifier training and analysis.
To categorize the users’ viewpoints, Darwish et al. [12] (2020) demonstrated an unsupervised learning system. Before clustering with DBSCAN and mean shift, preprocessed tweets were dimensionally reduced to limit the influence of outliers. In comparison to supervised learning methods, the labeling time for the stances was drastically decreased. Their solution, however, was confined to tweets and may be extended to include all additional metadata/multimedia.
2.2 Identity Inference in Cross Platforms
To find colluders in requests sent, Kamhoua et al. (2017) [13] computed the similarity in profile attributes and friend lists across platforms. The proposed research did not test its efficacy using a real-world data set.
Ahamad and Ali (2019) [14] put forth a user identity inference scheme that incorporated token-based and character-based distance algorithms to find similar profiles across OSNs. Several leading phrases in user accounts such as’ follow me on’ were analyzed in their method to get the target network names. Although their method was effective, it relied heavily on self-disclosed information in user-generated posts to perform the matching.
Authors Liu et al. (2019) [15] modeled user behavior patterns in 3 major OSNs to map similar profiles. They monitored user behaviors in various groups of different OSNs and thus, tried to infer user identities. Their study was based on the correlation between user and group behavior. However, their method was not a state-of-the-art technique, as the activity patterns across various platforms vary owing to their heterogeneity.
In their work, authors Halimi and Ayday (2020) [16] used publicly shared information such as user names, interests, etc., which offered varying ranges of disclosure to map similar profiles. Their feature-set comprised usernames, profile photos, locations, genders, activity patterns, interests, networks, etc. The contribution of each of these attributes was evaluated using machine learning algorithms, and the Hungarian algorithm was employed to assess similarity amongst the profiles. The authors plan to improve their graph matching algorithms and identify more correlations in their feature set to supplement their baseline work.
So, to summarize, most of the earlier works accounting for attribute inference either analyzed the tweets alone or the groups/ followers of the people. The proposed work enriches the same by adding more signals for analysis and incorporating the ensemble technique as opposed to simple machine learning classifiers. A new voting mechanism is put forth wherein similar users (grouped based on homophily) guess the hidden attribute of the target. The application of sentiment analysis, sarcasm detection, and emoji analysis further enhanced our work by providing richer insights into the tweets. Also, earlier to infer identities in OSNs, researchers relied on self-disclosed information on such sites. However, often this information is private and is prone to be duplicated easily. Thus, our study analyses the tweets and interests of the users to match profiles across many sites.
3 Methodology
The proposed approach (shown in Figure 2) is a two-step procedure. In the first section, a deep learning classifier and an ensemble are used to examine a user’s tweets in order to forecast their political party. This is enhanced by the analysis of tweets and sarcastic content, if available. Similar users are grouped using different interaction factors (retweets, mentions, following/followers, hashtags, etc.), and similar people help determine the target’s opinion when it is not clearly indicated. The second section focuses on implicit extractions of frequent subjects, phrases, emoticons, and other elements used in tweets and posts to appropriately match cross-platform profiles. The accuracy of various ensembles is evaluated, and the feature set is optimized through the use of different bio-inspired algorithms.
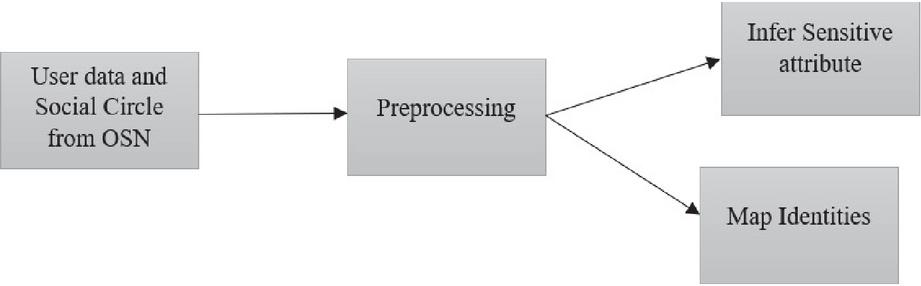
Figure 2 Overall inference.
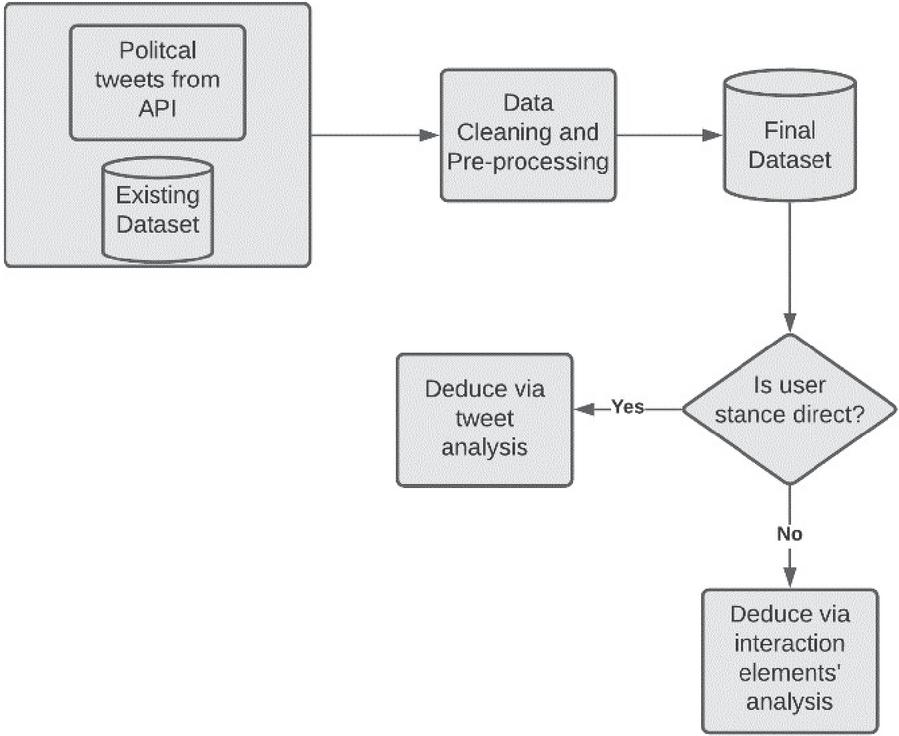
Figure 3 Attribute inference – overall methodology.
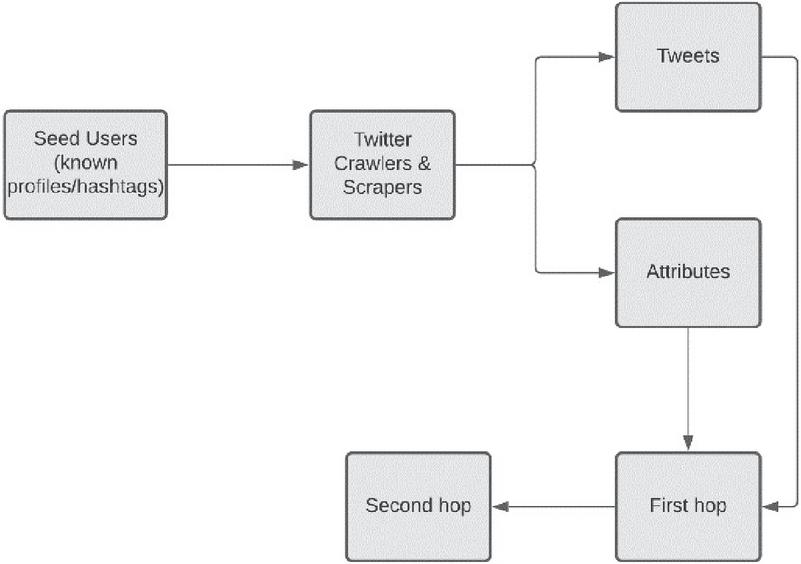
Figure 4 Data collection.
3.1 Attribute Inference
The following subsections explain the steps in Figure 3 in more detail.
1. Data Collection: A comprehensive list of significant party handles, active party leaders’ Twitter handle names, election campaign handles, popular hashtags, and party search keywords were compiled. The location was assigned to the United States using Geo Tagging. To augment our data collection, the Kaggle data set [17] was employed as an alternative source. Popular terms and handles included ‘Democrats,’ ‘Republicans,’ ‘Donald Trump,’ ‘Hillary Clinton,’ ‘@realDonaldTrump,’ ‘@HillaryClinton.’ Furthermore, as demonstrated in Figure 4 [4] secondary user profiles were obtained from their network employing certain seed users.
2. Proposed Ensemble
Algorithms 1 and 2 [18] brief the processes carried out in the construction of ensemble and subsequent political party inference.
Algorithm 1 Ensemble
Tweets
Output: political party score
foreach Tweet i do
pos – democrat- 0
pos – republic- 0
neg – democrat- 0
neg – republic- 0
/* initialization */
foreach base classifier c do
if c predicts positive sentiment for a party p then
pos – p - pos – p + 1
else
neg – p - neg – p + 1
/* where p can be democrat /
republic */
end if
probability(pos – democrat)
pos – democrat (pos – democrat neg – democrat)
probability(pos – republic)
pos – republic (pos – republic+neg – republic)
probability(neg – democrat)
neg – democrat (pos – democratneg – democrat)
probability(neg – republic)
neg – republic (pos – republicneg – republic)
totalprobability(democrat) probability (pos – democrat) probability (neg – republic)
totalprobability(republic) probability (pos – republic) + probability (neg – democrat)
end foreach
foreach base classifier c do
weightc accuracy of c/Summation of accuracy of all classifiers
end foreach
foreach tweet i do
democrat – score - 0 republic – score- 0
/* initialization */
foreach base classifier c do
if c predicts Democrat then then
democat – score
weightc *totalprobability(democrat)
else
republic – score
weightc* totalprobability(republic)
end if
end foreachreturn republic – score; democrat – score
end foreach
end foreach
Algorithm 2 Choice of party preferred
Tweet, rs, ds,user
political party
if rs ds then
politicalparty = “REPUBLICAN”
else
politicalparty = “DEMOCRAT”
end if
/* where rs and ds are democrat, and republic score returned in Algorithm 1 */
foreach user j get all the political related tweets using the cosine distance formula do
if trstds, then
politicalparty = “REPUBLICAN”
else
politicalparty = “DEMOCRAT”
/* where trs and tds are the sum of total democrat and republic scores of a user computed via Algorithm 1
*/
/* cos(t1, t2) = (t1 . t2)/(||t1||. ||t2||); output 1 means
high similarity */
end if
end foreach
3. Sarcasm Analysis: Sarcasm is typically employed to look humorous, exhibit distress, and refrain from providing a direct response. Our approach interprets caustic tweets against “Democratic” as a preference for “Republican,” and vice versa.
4. Homophily detection: In contrast to direct tweets, the contacts and communication features of the users were studied in this study to determine the preferred political party from comparable users. The links examined in our research are detailed below [19].
’ Following/Follower: People are presumptively interested in the profiles of personalities they find appealing or with whom they have certain commonalities. The goal here is to amass a certain user’s follower/following group in order to deduce his political beliefs from them. We determined a user’s preferred political party based on whether a majority of his or her friends are Democrats or Republicans.
’ Mention: The mention similarity evaluated how frequently a certain party’s handle or a famous leader’s profile is cited in a favorable meaning by a specific user using ‘@’. It also examines how frequently a certain person’s handle appears in the user’s tweets to gauge their friendship (Further inference of the user’s political choices is made using information from these friends).
’ Retweet: Users who retweet a certain individual’s tweet demonstrate their interest in that person, which may be used to discover commonalities.
’ Hashtag Similarity: The usage of popular hashtags that were trending about a specific party was examined in order to deduce the attitudes of a specific user towards them.
The factors listed above were used to calculate a user’s resemblance to notable political personalities from each political party (namely Donald Trump from the Republican Party and Hillary Clinton from the Democrat Party). The classifiers are provided user similarity signals for both target politicians and all of the parameters. As shown in Algorithm 3, the final conclusion is based on which political party is predicted by the majority of classifiers.
Algorithm 3 Majority voting of classifiers
Signals, user
political party
ds -0 rs- 0
foreach base classifier c do
if c predicts democrat then
ds-ds + 1
else
rs-rs + 1
end if
end foreach
if rsds then
political-party - “REPUBLICAN”
else
political-party - “DEMOCRAT”
return political-party
end if
5. Attribute inference from friends:
Algorithm 4 [20] shows how an attribute can be inferred from the social circle of a user.
Algorithm 4 Vote distribution attack
a. Overview
For this attack, we model the social network as follows:
• It contains a set of user nodes Vs.
• A user can follow any other user.
• A user can have attributes associated with them.
In this scenario, the only possible attributes are ‘Republican’ and ‘Democrat’. A user may be associated with at most one of these attributes.
We refer to the users on whom the inference is to be performed as ‘target users’ and other users as ‘non-target users’.
The attribute information is hidden for our target users and we attempt to infer it. The algorithm iteratively selects a target user and gives a certain amount of voting capacity to each user. Based on whether non-target democrats or republicans end up having a higher cumulative voting capacity, we classify the selected target user into the party with higher voting capacity.
In each iteration, the target initially has a voting capacity of |V|. The target then distributes the capacity according to the algorithm mentioned below, after which we infer the party of the currently selected user based on the final voting capacities of all non-target users. The last two steps of vote distribution and party inference should be repeated for all the targets.
b. Social Connection Matrix
S stores following and follower connections with weights as described below.
A pair of users where only one user follows the other gets a social connection weight of 1. A pair of users where both users follow each other get a social connection weight of 2. d is a column vector containing the sum of weights of all social connections for each user.
Attribute-Based Second-Hop Connection Matrix
A pair of users are said to be connected by an ‘attribute-based second-hop connection if both the users share a common attribute (The only attributes considered for our case are Democrat and Republican i.e. political preference).
Attribute-Based Second-Hop Connection Matrix A stores attribute-based second-hop connections. party[user] indicates the party the user is associated with.
Divider Matrix
Divider Matrix M stores the weights by which each node distributes voting capacity to its neighbors.
M[i, j] indicates how much voting capacity is distributed from user i to user j.
d contains the number of people in each party (belonging to each attribute).
w, w, w denotes the weight given to social connections, the weight given to attribute-based second hop connections, and the total weight respectively.
Voting capacity distribution is based on the following rules:
‘ If user i have social connections, it distributes w /w fraction of its voting capacity to users with which it has social connections. If user i have attribute-based second-hop connections, it distributes w /w fraction of voting capacity to users with which it has attribute-based second-hop connections. w for user i is computed as the sum of the weights assigned to the types of connections that the user i has. Note that w does not include weights assigned to connection types that the user i does not have. For example, if user i do not have social connections, w w and would not include w.
‘ If users j and i have a social connection, user j gets voting capacity from user i proportional to the weight of the social connection between users j and i.
‘ If users j and i are connected through an attribute, user j gets voting capacity from i inversely proportional to the number of people belonging to the party (or having that attribute).
This is based on the idea that vote is distributed in 2 steps
‘ from user i to the attribute
‘ from the attribute to user j.
In the first step, since a user can have at most one attribute, user i gives its entire vote capacity dedicated to attribute-based connections, to the attribute.
In the second step, the attribute must divide this vote capacity among all the users connected to it, so the voting capacity is divided by the number of users connected to that attribute and then given to user j.
Computing Voting Capacity
Inferring Party
Parameters: is set to the default value of 0.1 (according to the default value in the paper).
Social connections and attribute-based second-hop connections are given equal weights.
w 50, w 50, epochs 50.
Note: When selecting targets for inference, we ensure that we only select users who have at least one social connection. This ensures that w is never 0 in our dataset, all non-target users will have at least one attribute-based second-hop neighbor and all targets will have at least one social connection (because of the selection method).
3.2 Identity Mapping in Cross-Platform Profiles
Algorithm 5 illustrates the steps followed while implementing our methodology. This section aims to infer the profile of person X on Facebook by training our classifiers with the data available in his Twitter profile. Unlike earlier methods, wherein direct indications such as pictures, friend lists, profile data, or usernames, the proposed work only performs inference based on tweets [21, 22]. We have considered actively labeled celebrity profiles for our work. In this direction, after refining the tweets, performing parts of speech tagging, clustering frequently occurring distinguishable words, and inspecting the URLs, emojis, topics of interest, etc., both from profiles of source and target platforms, the most apparent profiles were matched. Bio-Inspired algorithms can be used to achieve dimensionality reduction and maintain the highest contributing features of the feature set, as indicated in [23]. The Bio-Inspired algorithms chosen for performing feature optimization are Particle Swarm Optimization, FireFly Algorithm, Ant Colony Algorithm, and Artificial Bee Colony Algorithm. In conjunction with machine learning algorithms, these algorithms are used to derive optimal feature sets that provide the best accuracy. The illustration of the entire process is demonstrated in Figure 5.
Algorithm 5 Algorithm to match cross-platform profiles
Twitter profile with tweets
Facebook profile with posts
1. Collect the tweets of the user.
2. Preprocess them. (As shown in Algorithm 1)
3. Create a repository of content attributes for each Twitter profile from tweets, hashtags, URLs, emojis, etc.
4. Perform Vectorization and collect high-frequency words and topics tweeted.
5. Infer possible interests from tweets. Perform sentiment analysis to obtain the user’s orientation towards the top 10 tweeted topics.
6. Create a content repository for target Facebook profiles to extract the high-frequency words, interests, emojis, hashtags, etc. (Repeat the above four steps.)
7. Map the most possible target profile to the source profile and verify its veracity.
8. Create random subsets of the feature set of both Twitter and Facebook Data
9. Initialize the Bio-Inspired algorithm’s parameters.
10. Evaluate fitness by using the accuracy of an ensemble classifier (Naive Bayes, Random Forest, and Support Vector Machine) (As shown in Algorithms 3 and 4) with feature subset as the measure of evaluation of fitness.
11. Repeat until the subset with the best fitness is achieved.
12. Perform training and testing on the ensemble with this fitness and compare the accuracy of an ensemble of classifiers against the Bi-directional LSTM.
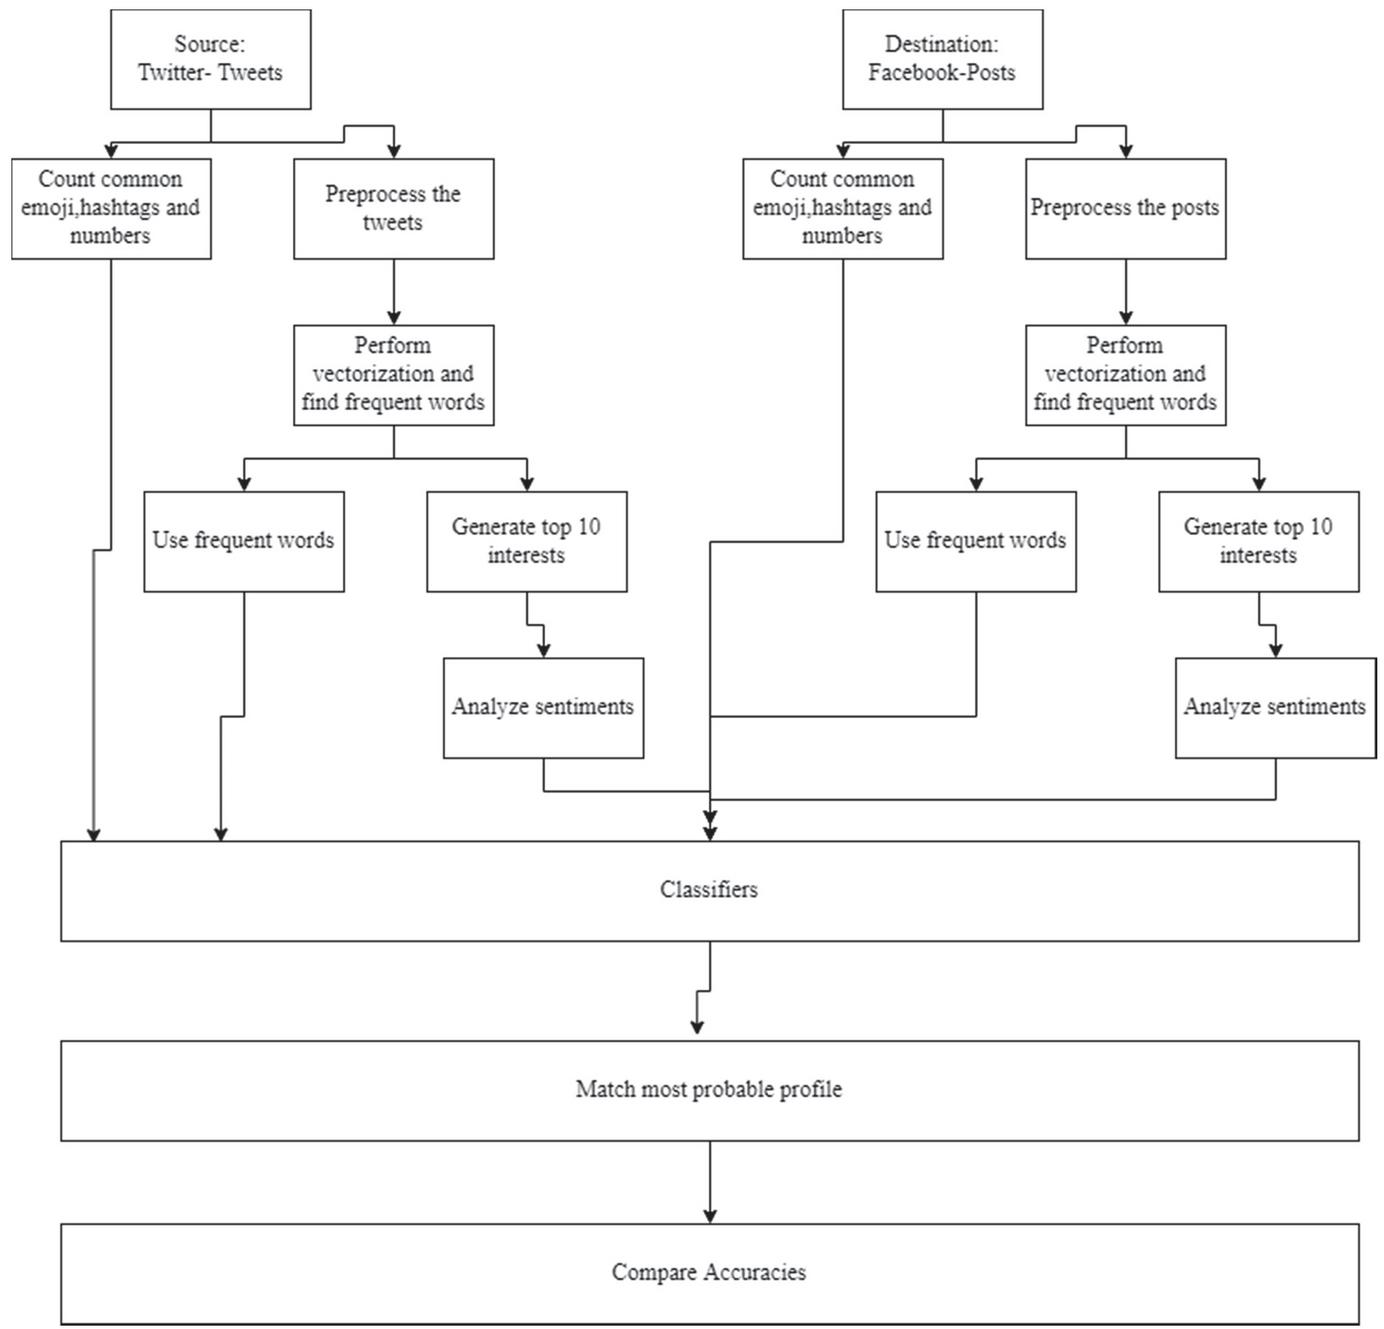
Figure 5 Identity mapping in cross-platform profiles.
4 Result Analysis and Discussion
4.1 Attribute Inference – Analysis of Tweets
Tables 1 – 2 & Figure 6 list the various metric values for the developed classifier when compared against traditional classifiers.
CNN was chosen over RNN to detect sarcasm for the following reasons:
• CNN is quicker than RNN.
• CNN is more adept in detecting emotional languages such as rage, abuse, and so on, which is critical for detecting sarcasm.
Sarcasm analysis reduces the model’s accuracy. This might be due to the following reasons:
• The sarcasm detection algorithm was trained on non-political tweets. The reason for this is that there was no dataset available in which political tweets were categorized as sarcastic or non-sarcastic. As a result, there is a good chance that the model met a huge number of terms for the first time while attempting to forecast political tweets, and so did not perform as well as it should have.
• The accuracy of the sarcasm detection model (independently) was only 80%. With the restrictions of the current dataset and the subjective nature of sarcasm, increasing this accuracy is extremely challenging.
1. Tweet Similarity for Political Party Inference.
| (1) |
where t1 and t2 are the token sets of tweet1 and tweet2 respectively.
On computing the average Jaccard similarity (Equation 1) between “Democrat” and “Republican” tweets, the following results were observed:
• The average similarity between democrat tweets is 0.027.
• The average similarity between republican tweets is 0.017.
| (2) |
On computing the average Sørensen-Dice indices (Equation 2), the similarity values observed are listed below:
• The average similarity (Sorensen-dice) between Republican tweets is 0.033.
• The average similarity (Sorensen-dice) between Democrat tweets is 0.052.
Table 1 Evaluation metrics for various models – direct evaluation tweet data (in percent)
| Bidierctional | Multinomial | Random | Ensemble | |||
| Metric | Ensemble | LSTM | Naïve Bayes | Forest | SVM | Sarcasm |
| Accuracy | 88.61 | 87.50 | 79.75 | 84.32 | 85.47 | 85.8 |
| Sensitivity/Recall | 86.35 | 86.63 | 74.54 | 82.99 | 84.24 | 84.13 |
| Specificity | 89.76 | 87.93 | 81.55 | 85.38 | 86.23 | 86.66 |
| Precision | 81.40 | 78.12 | 59.27 | 82.44 | 81.52 | 75.83 |
| F1 Score | 83.80 | 82.15 | 66.04 | 82.72 | 82.86 | 79.77 |
Table 2 Secondary evaluation metrics for best performing classifiers- Direct Evaluation tweet data (in percent)
| Metric | Ensemble Sarcasm | Bidirectional LSTM | Ensemble |
| Mean Absolute Error | 14.13 | 13.74 | 13.49 |
| Root mean squared error | 37.60 | 37.07 | 36.72 |
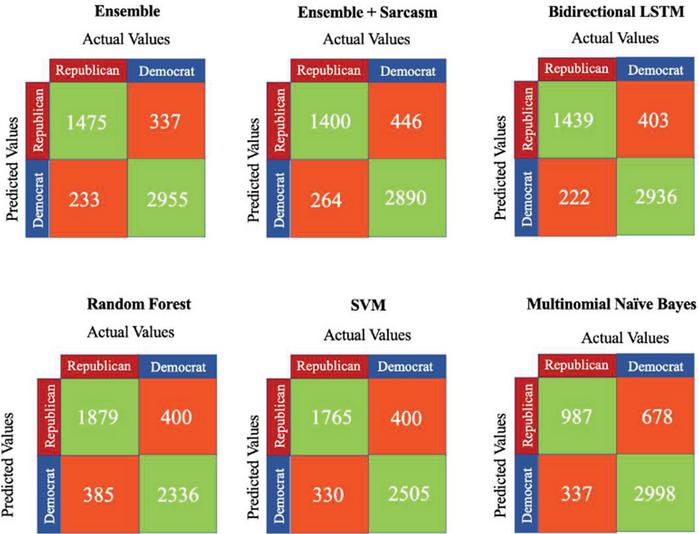
Figure 6 Confusion matrices – tweet data (direct evaluation).
The values indicate that although there is a very marginal similarity between tweets in each group (democrat and republic), there is a significantly higher similarity between Democrat tweets as compared to Republican tweets. This could mean two things:
• The Democrats tend to tweet the same things more than once, hence increasing the average similarity amongst all tweets.
• Republicans tend to tweet more randomly, hence making their tweets more unique. Donald Trump is an example of this- his tweets are highly irregular and extremely unpredictable whereas most democratic tweets tend to follow a certain pattern.
Note: Here a token-based text similarity approach is implemented, meaning every sentence is split into individual words before the similarity is calculated. This token-based approach is particularly helpful when the strings are long. Using a sequence-based algorithm would provide slightly more insight but is not apt for our work owing to the time complexity observed.
4.2 Attribute Inference-Analysis of Metadata
1. Follow/Following –
| (3) |
where n is the total number of user’s followers, and k is the total number of users user is following
2. Mention –
| (4) |
where,
‘ tthreadmen is a function that returns the number of u tweets in the communication thread n with uthat mention the account u (can be a friend or a political party/its leader’s handle).
‘ acctotthread is the total number of accounts in the tweets in thread n.
‘ tthreadtot is a function that returns the total number of tweets in the communication thread n.
‘ q is the total number of communication threads mentioning both u and u
3. Retweets –
| (5) |
The function noofTwtsreTweetd returns the total number of u’s (can be a friend or a political party/its leader’s handle) tweets that u retweeted.
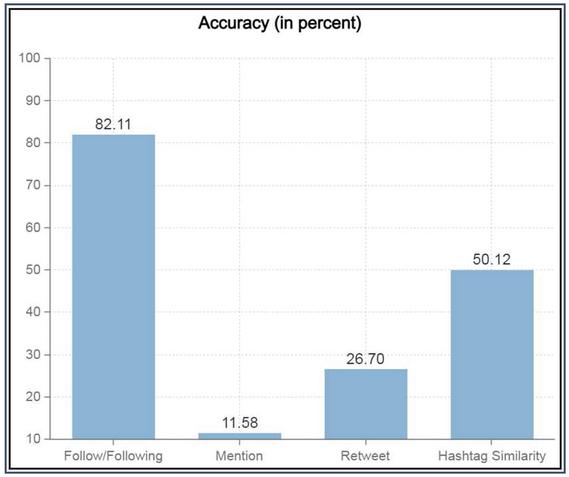
Figure 7 Individual signal accuracy.
4. Hashtags –
| (6) | ||
| (7) |
where
’ function P takes user-id and hashtag as input and returns total positive tweets tweeted on the hashtag by the user.
’ function N takes user-id and hashtag as input and returns total negative tweets tweeted on the hashtag by the user.
’ function NU takes user-id and hashtag as input and returns total neutral tweets tweeted on the hashtag by the user.
’ q is the total number of hashtags tweeted by both u and u
Table 3 Evaluation metrics for various models – Indirect Evaluation data (in percent)
| Majority | Logistic | SVM | Naïve | Random | Decision | ||
| Metric | Vote | Regression | SVM | Linear Kernel | Bayes | Forest | Tree |
| Accuracy | 94.16 | 94.16 | 91.67 | 95 | 83.33 | 95 | 95.8 |
| Sensitivity/ | 98.21 | 98.21 | 96.42 | 98.21 | 69.64 | 98.21 | 98.21 |
| Recall | |||||||
| Specificity | 90.62 | 90.62 | 87.5 | 92.18 | 95.31 | 92.18 | 93.75 |
| F1 Score | 94.01 | 94.01 | 91.53 | 94.82 | 79.59 | 94.82 | 95.65 |
| Precision | 90.16 | 90.16 | 87.09 | 91.66 | 91.85 | 91.66 | 93.22 |
Individual signal accuracies as plotted in Figure 7 convey that the follower/following relation is the most contributing factor and must be prioritized when deciding on the weights that each signal will carry during the signal combination step. Comparison metrics for the same are listed with values in Tables 3 – 4 & Figure 8.
Table 4 Comparison of majority voting with vote distribution attack – indirect evaluation data (in percent)
| Metric | Majority Vote | Vote Distribution Attack |
| Accuracy | 94.166 | 99 |
| Sensitivity/Recall | 98.21 | 98.18 |
| Specificity | 90.62 | 100 |
| F1 Score | 94.01 | 99.08 |
| Precision | 90.16 | 100 |
Using Figure 7 as a reference, Algorithm 6 is used to test if the grouping of comparable users is accurate.

Figure 8 Confusion matrices-indirect evaluation.
Algorithm 6 validation
1. Jaccard Coefficient Following
J denotes Jaccard coefficient between users based on the following (outgoing edges)
Initialize J as a 2D vector (matrix) of zeros with dimensions |users| |users|
for i - 1 to |users|:
F - set of users followed by user i
for j -1 to |users|:
F - set of users followed by user j
J[i,j] |FnF|/ |FF|
end for
end for
2. Jaccard Coefficient Follower
J denotes Jaccard coefficient between users based on followers (incoming edges)
Initialize J as a 2D vector (matrix) of zeros with dimensions |users|x |users|
for i -1 to |users|:
F - set of followers of user i
for j -1 to |users|:
F - set of followers of user j
J [i,j] |FnF|/ |FF|
end for
end for
3. Jaccard Coefficient Combined
J denotes combined Jaccard coefficient between users.
for i - 1 to |users|:
for j -1 to |users|:
J[i,j] = J[i,j] + J [i,j]
end for
end for
4. Computing mean of Jaccard Coefficient for users in same party and users in different party
different_coefficient - 0
same_coefficient - 0
/* Subtracting |users|because we do not consider diagonal elements of the J matrix as they correspond to the Jaccard coefficient between a user and themself.*/
total_entries - |users|* |users| – |users|
for i - 1 to |users|:
for j -1 to |users|:
if i = j:
skip to next iteration
end if
if users i and j belong to same party:
same_coefficient - same_coefficient + J[i,j] / total_entries
else
different_coefficient - different_coefficient + J[i,j] / total_entries
end if
end for
end for
It is observed that the Jaccard coefficient for people in the same party is much higher (approx 2.24 times) than the Jaccard coefficient for people from different parties.
• Same Party : 0.046
• Different Party: 0.019
The obtained results corroborate the base assumption that users tend to share similar interests with their followers and the people they follow.
Table 5 Evaluation metrics for various models – identity mapping in cross-platform profiles (in percent)
| Ensemble | Ensemble | |||||
| Training | Training | Ant | ||||
| Algorithm | & Testing) | & FB Testing) | Firefly | PSO | Colony | ABC |
| Sensitivity/Recall | 75.28 | 73.80 | 75.29 | 79.51 | 72.97 | 78.40 |
| Specificity | 88.52 | 87.87 | 84.61 | 82.08 | 76.31 | 80.64 |
| Accuracy | 80.53 | 79.93 | 79.04 | 80.07 | 74.12 | 79.93 |
| Precision | 90.54 | 88.57 | 86.48 | 84.61 | 75 | 85.18 |
| F1 Score | 82.20 | 80.51 | 80.50 | 81.98 | 73.97 | 81.65 |
| Mean Absolute Error | 37.47 | 33.57 | 35.71 | 32.89 | 46.99 | 33.72 |
| Root mean squared error | 95.16 | 84.17 | 88.002 | 82.46 | 99.03 | 84.48 |
4.3 Identity Mapping in Cross-platform Profiles
Table 5 & Figure 9 lists the performance evaluation metrics of various bio-inspired algorithms when annexed with the base ensemble.
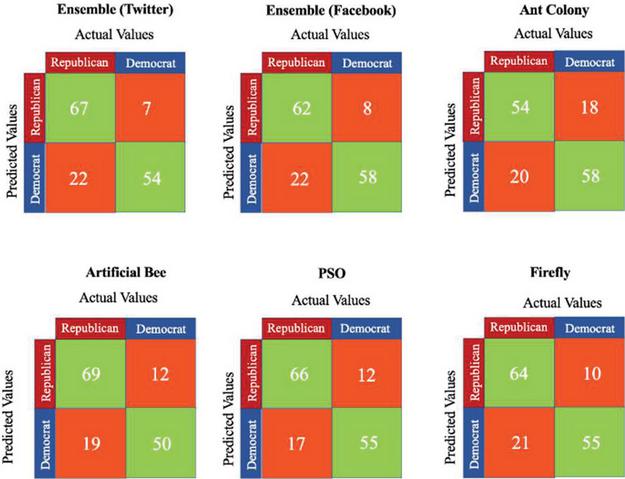
Figure 9 Confusion matrices – identity mapping in cross-platform profiles.
1. Tweet Similarity for Cross-Platform Mapping The training data is from a user’s Twitter feed, the testing data is from the user’s Facebook feed. Users such as Actors and Influencers have a higher cross-profile similarity, as they use every platform in a similar structure to engage with their fans.
Computation is done using the cosine similarity formula (as shown in Equation 8) and the results for some of the sample profiles are listed in Table 6.
| (8) |
where F and T are Twitter and Facebook profiles respectively.
Table 6 Cosine similarity results
| Class | The Similarity Between Train and Test |
| 0 | 0.53 |
| 1 | 0.60 |
| 2 | 0.96 |
| 3 | 0.90 |
| 4 | 0.84 |
4.4 Comparison with State of Art Approaches
Tables 7 and 8 compare the proposed approach with some of the similar existing techniques highlighting the feature set and experimental results obtained.
Table 7 Existing research on political stance inference
| Authors | Feature Set | Results |
| Asif Khan, Huaping Zhang, Jianyun Shang, Nada Boudjellal, Arshad Ahmad, Asmat Ali, and Lin Dai [24] | User data, texts, retweets, replies, mentions, links, hashtags, locations, friends, followers, statuses along with semantic analysis | SVM offered the highest accuracy with 79.8 % |
| Parnian Kassraie, Alireza Modirshanechi, and Hamid K. Aghajan [25] | Tweets with Google trends data | SentimentR package offered better accuracy of 84%. Gaussian process regression had lesser prediction error when compared to SVM. |
| Josemar A. Caetano, Hélder S. Lima, Mateus F. Santos and Humberto T. Marques-Neto [4] | Tweet, retweet, follow, mention | The homophily of these attributes was analysed. |
| Mirko Lai, Marcella Tambuscio, Viviana Patti, Giancarlo Ruffo, Paolo Rosso [7] | User data, texts, retweets, replies, mentions, links, hashtags | Metadata like followers, retweets, and mentions showed agreement with the users. Mostly contradictions were expressed through a reply to. SVM model achieved a precision of 0.96 and 0.94 for against and favor respectively. In the case of none highest recall was 0.89. |
| Proposed Research | Tweets, Follow/ Following, Mentions, Hashtags, Retweets, guess of people whom user follow/ his followers | The proposed Ensemble gave the best accuracy of 88.61% indirect evaluation. Vote distribution attack (based on followers and following) gave almost perfect accuracy of 99 percent. Follow/Following was proved to be the most accurate signal with an accuracy of 82.11% |
Table 8 Existing research on cross-platform profile matching
| Authors | Feature Set | Scores Obtained and Inferences |
| Deepesh Kumar Srivastava, Basav Roychoudhury [21] | Tweets, retweets, posts, URLs | Neural networks offered the highest accuracy 91.2% |
| LiYongjun, PengYou, ZhangZhen, WuMingjie, XuQuanqing, YinHongzhi [26] | Display User names | Random Forest performed the best with an AUC of 0.97. SVM and Maxent offered 0.90 and 0.95 AUCs s respectively. |
| Hussein Hazimeh, Elena Mugellini, Omar Abou Khaled, Philippe Cudré-Mauroux- [27] | Screen names, biographies, and profile data (named entities) [Life event-based linking and Description based linking] | The precision of state of art HYDRA approach was observed to be 0.8 |
| Wenxin Liang, Bo Meng, Xiaosong He, and Xianchao Zhang [28] | Profile attributes and user connection information | JLA had the highest precision of 1.0. While core GCM had a precision of 0.93, its other versions had a precision of 0.8 approximately. |
| Nacéra Bennacer, Coriane Nana Jipmo, Antonio Penta, and Gianluca Quercini [29] | User network and profile data | Proposed algorithm gave a precision of 94%. |
| Anisa Halimi and Erman Ayday [16] | Username, Location. Gender Photo, Bio, Activity, Interest Sentiments, Graph connection | They found weak and strong identifiers for profile matching. Logistic Regression when used for classification in their approach gave an average precision of 0.8 for various test cases. |
| Proposed Research | Tweets, hashtags, URLs, emoji, interests | PSO with the proposed ensemble gave the highest accuracy of 80%. |
5 Conclusion and Future Works
Using words, support (retweets, likes, and mentions), multimedia, emoji, and groups, users of Twitter, a common podium today, express their moments and opinions on a range of topics, from current events to problems like mental health, etc. Inferring identities or sensitive attributes in the absence of direct evidence was the goal of the suggested research, which attempted to close this research gap. Some possible future works in this direction are listed below. Detecting the intensity of user connections (unidirectional/bidirectional) and time period-length of contacts in a certain environment (for example, political) to enhance homophily identification would be a significant future endeavor. Acquiring appropriate datasets helps improve sarcasm and emoticon analysis (containing more suitable Twitter dialects). A potential extension of this work in the area of identity resolution is the dynamic linkage of social network profiles [30]. E-commerce, marketing analysis, locating online trolls, profile integration, etc. are notable areas where this study may be expanded. Profile integration assists in delivering better friendship suggestion services when users switch across networks. While improving these strategies, it is critical to ensure that the user’s privacy is not violated.
References
[1] Y. Lin, “10 twitter statistics every marketer should know in 2020 [infographic],” Jul 2020. [Online]. Available: https://www.oberlo.in/blog/twitter-statistics
[2] E. Raad and R. Chbeir, “Privacy in online social networks,” in Security and Privacy Preserving in Social Networks, 2013.
[3] Y. Abid, A. Imine, A. Napoli, C. Raïssi, and M. Rusinowitch, “Online link disclosure strategies for social networks,” in Risks and Security of Internet and Systems, F. Cuppens, N. Cuppens, J.-L. Lanet, and A. Legay, Eds. Cham: Springer International Publishing, 2017, pp. 153–168.
[4] J. A. Caetano, H. S. Lima, M. F. Santos, and H. T. Marques-Neto, “Using sentiment analysis to define twitter political users’ classes and their homophily during the 2016 American presidential election,” Journal of Internet Services and Applications, vol. 9, no. 1, 2018.
[5] W. Budiharto and M. Meiliana, “Prediction and analysis of Indonesia presidential election from twitter using sentiment analysis,” Journal of Big Data, vol. 5, no. 1, 2018.
[6] I. E. Alaoui, Y. Gahi, R. Messoussi, Y. Chaabi, A. Todoskoff, and A. Kobi, “A novel adaptable approach for sentiment analysis on big social data,” Journal of Big Data, vol. 5, no. 1, 2018.
[7] M. Lai, M. Tambuscio, V. Patti, G. Ruffo, and P. Rosso, “Stance polarity in political debates: A diachronic perspective of network homophily and conversations on twitter,” Data Knowledge Engineering, vol. 124, p. 101738, 2019. [Online]. Available: http://www.sciencedirect.com/science/article/pii/S0169023X19300187
[8] K. Sailunaz and R. Alhajj, “Emotion and sentiment analysis from twitter text,” Journal of Computational Science, vol. 36, p. 101003, 2019. [Online]. Available: http://www.sciencedirect.com/science/article/pii/S1877750318311037
[9] A. Aldayel and W. Magdy, “Your stance is exposed! analysing possible factors for stance detection on social media,” Proceedings of the ACM on Human-Computer Interaction, vol. 3, pp. 1–20, 2019.
[10] A. Sharma and U. Ghose, “Sentimental analysis of twitter data with respect to general elections in India,” Procedia Computer Science, vol. 173, pp. 325–334, 2020, international Conference on Smart Sustainable Intelligent Computing and Applications under ICITETM2020. [Online]. Available: http://www.sciencedirect.com/science/article/pii/S1877050920315428
[11] M. Z. Ansari, M. Aziz, M. Siddiqui, H. Mehra, and K. Singh, “Analysis of political sentiment orientations on twitter,” Procedia Computer Science, vol. 167, pp. 1821–1828, 2020, international Conference on Computational Intelligence and Data Science. [Online]. Available: http://www.sciencedirect.com/science/article/pii/S1877050920306669
[12] K. Darwish, P. Stefanov, M. J. Aupetit, and P. Nakov, “Unsupervised user stance detection on twitter,” in ICWSM, 2020.
[13] G. A. Kamhoua, N. Pissinou, S. S. Iyengar, J. Beltran, C. Kamhoua, B. L. Hernandez, L. Njilla, and A. P. Makki, “Preventing colluding identity clone attacks in online social networks,” in 2017 IEEE 37th International Conference on Distributed Computing Systems Workshops (ICDCSW), 2017, pp. 187–192.
[14] W. Ahmad and R. Ali, “Social account matching in online social media using cross-linked posts,” Procedia Computer Science, vol. 152, pp. 222–229, 2019, international Conference on Pervasive Computing Advances and Applications – PerCAA 2019. [Online]. Available: https://www.sciencedirect.com/science/article/pii/S1877050919306982
[15] J. Liu, W. Chung, Y. Huang, and C. Toraman, “Crosssimon: A novel probabilistic approach to cross-platform online social network simulation,” in 2019 IEEE International Conference on Intelligence and Security Informatics (ISI), 2019, pp. 7–12.
[16] Halimi, Anisa and Erman Ayday. “Profile Matching Across Online Social Networks.” ArXiv abs/2008.09608, 2020.
[17] K. Pastor, “Democrat vs. republican tweets,” May 2018. [Online]. Available: https://www.kaggle.com/kapastor/democratvsrepublicantweets
[18] Ankit and N. Saleena, “An ensemble classification system for twitter sentiment analysis,” Procedia Computer Science, vol. 132, pp. 937–946, 2018, international Conference on Computational Intelligence and Data Science. [Online]. Available: https://www.sciencedirect.com/science/article/pii/S187705091830841X
[19] H. AlMahmoud and S. Al-Khalifa, “Tsim: a system for discovering similar users on twitter,” Journal of Big Data, vol. 5, pp. 1–20, 2018.
[20] Gong, N. and B. Liu. “You Are Who You Know and How You Behave: Attribute Inference Attacks via Users’ Social Friends and Behaviors.” USENIX Security Symposium, 2016.
[21] D. K. Srivastava and B. Roychoudhury, “Words are important: A textual content-based identity resolution scheme across multiple online social networks,” Knowl. Based Syst., vol. 195, p. 105624, 2020.
[22] Mónica Aresta, Luís Pedro, Carlos Santos, António Moreira,” Social Networks And The Construction Of Identity In Digital Environments”, Journal Of Mobile Multimedia, Vol. 10, Issue 3–4, 2014.
[23] B. Chakraborty, “Bio-inspired algorithms for optimal feature subset selection,” 2012 5th International Conference on Computers and Devices for Communication (CODEC), 2012, pp. 1–7, doi: 10.1109/CODEC.2012.6509209.
[24] Asif Khan, Huaping Zhang, Jianyun Shang, Nada Boudjellal, Arshad Ahmad, Asmat Ali, Lin Dai, “Predicting Politician’s Supporters’ Network on Twitter Using Social Network Analysis and Semantic Analysis”, Scientific Programming, vol. 2020, Article ID 9353120, 17 pages, 2020. https://doi.org/10.1155/2020/9353120.
[25] Kassraie, Parnian, Alireza Modirshanechi and Hamid K. Aghajan. “Election Vote Share Prediction using a Sentiment-based Fusion of Twitter Data with Google Trends and Online Polls.” DATA (2017).
[26] Yongjun Li, You Peng, Zhen Zhang, Mingjie Wu, Quanqing Xu, Hongzhi Yin,“A deep dive into user display names across social networks”, Information Sciences, Volume 447, 2018, Pages 186–204, ISSN 0020-0255, https://doi.org/10.1016/j.ins.2018.02.072.
[27] Hazimeh, Hussein, Elena Mugellini, Omar Abou Khaled and Philippe Cudré-Mauroux. “SocialMatching++: A Novel Approach for Interlinking User Profiles on Social Networks.” PROFILES@ISWC (2017).
[28] Liang, Wenxin, Bo Meng, Xiaosong He and Xianchao Zhang. “GCM: A Greedy-Based Cross-Matching Algorithm for Identifying Users Across Multiple Online Social Networks.” PAISI (2015).
[29] Bennacer N., Nana Jipmo C., Penta A., Quercini G. (2014) Matching User Profiles Across Social Networks. In: Jarke M. et al. (eds) Advanced Information Systems Engineering. CAiSE 2014. Lecture Notes in Computer Science, vol 8484. Springer, Cham. https://doi.org/10.1007/978-3-319-07881-6\_29.
[30] Maytham Safar, Hisham Farahat, Khaled Mahdi,” Robustness Of Dynamic Social Networks”, Journal Of Mobile Multimedia, Vol. 6, Issue 3, 2010.
Biographies

Nisha P. Shetty has acquired her bachelor’s and master’s degree from Visvesvaraya Technological University. She is currently pursuing her doctorate at Manipal Institute of Technology, Manipal. She is working in the area of social network security.

Balachandra Muniyal’s research area includes Network Security, Algorithms, and Operating systems. He has more than 30 publications in national and international conferences/journals. Currently, he is working as a Professor in the Dept. of Information & Communication Technology, Manipal Institute of Technology, Manipal. He has around 25 years of teaching experience in various Institutes.

Daita Ravi Teja has pursued his bachelor’s degree in Computer and Communication Engineering branch from Manipal Institute of Technology, Manipal. His areas of interest include Data Science and Machine Learning. He is currently pursuing his Master’s in Data Science from King’s College London.

Leander Melroy Maben has pursued his bachelor’s degree in Computer Science and Engineering branch from Manipal Institute of Technology, Manipal. His areas of interest are Data Science and Optimization Techniques.

Tummala Srinag Vinil has pursued his bachelor’s degree in Computer and Communication Engineering branch from Manipal Institute of Technology, Manipal. His areas of interest are Data Science and Data Analysis. He is currently a graduate Student at the University of Southern California.
Journal of Mobile Multimedia, Vol. 19_3, 645–678.
doi: 10.13052/jmm1550-4646.1932
© 2023 River Publishers