Multi-Class Classification Method with Feature Engineering for Predicting Hypertension with Diabetes
Mongkhon Sinsirimongkhon1, 2, Sujitra Arwatchananukul2 and Punnarumol Temdee1, 2,*
1Computer and Communication Engineering for Capacity Building Research Center
2School of Information Technology, Mae Fah Luang University, Chiang Rai, Thailand
E-mail: 6451501503@lamduan.mfu.ac.th; sujitra.arw@mfu.ac.th; punnarumol@mfu.ac.th
*Corresponding Author
Received 27 March 2022; Accepted 03 October 2022; Publication 15 February 2023
Abstract
Machine learning–based methods are widely applied for the prediction of noncommunicable diseases (NCDs), such as hypertension, diabetes, and cardiovascular disease. However, few models have been developed for predicting hypertension with diabetes, even though these diseases generally co-occur and can cause devastating harm to patients. This paper proposes a multi-class classification method that will be able to predict hypertension with diabetes. The proposed method consists of data preprocessing, model construction and validation, and model comparison. For data preprocessing, feature engineering of corresponding data types is conducted. For model construction, several machine learning methods are applied, including Random Forest (RF), Gradient Boosting (GB), Extra Tree (ET), Decision Tree (DCT), and Support Vector Machine (SVM). The dataset used in this study consists of 17,077 records and 28 features, obtained from Phaya Mengrai Hospital, Chiang Rai, Thailand. The predictive performance of each model with and without feature engineering is compared in terms of accuracy and average area under the Receiver Operating Characteristic curve (AUC-ROC). From the comparison results, SVM with feature engineering outperformed other models based on accuracy and average AUC-ROC achieving a value of 88.39% and 93.32%, respectively. For all ensemble learning–based methods, RF performed the best in terms of both accuracy and average AUC-ROC for both with and without feature engineering. Overall, all the models performed better when feature engineering was applied.
Keywords: Hypertension, diabetes, hypertension with diabetes, machine learning, disease prediction.
1 Introduction
Noncommunicable diseases (NCDs) or chronic diseases constitute a group of conditions that occur not due to infection but a combination of genetic, physiological, environmental, and behavioral factors. These conditions result in lasting health consequences and often require long-term treatment and care. NCDs are believed to cause approximately 41 million deaths each year, equivalent to 74% of all deaths globally [1]. They are most frequently associated with older age groups. However, evidence suggests that over 15 million of all deaths attributed to NCDs occur in people between the ages of 30 and 69 years [1]. Early detection, screening, and treatment are key components of the response to NCDs.
Hypertension and diabetes are NCDs that are major public health concerns. Because they share a number of common causes and risk factors, a person who has one condition is at an increased risk of developing the other. In addition, these are two of the major risk factors for cardiovascular diseases (CVDs) [2]. Generally, patients with type 2 diabetes have a greater chance of having high blood pressure. In the US, it is estimated that 73.6% of individuals with diabetes who are aged 18 years or more tend to have hypertension [3]. Further, 50%–80% of patients with hypertension tend to have type 2 diabetes [4]. In Hong Kong, 58% of diabetic patients have high blood pressure and 44% of hypertensive people also have diabetes [2]. The same trend is observed in Thailand, where the number of patients with both hypertension and diabetes is increasing [5]. According to the twelfth five-year National Health Development Plan (2017–2021), both these diseases are among those categorized as national priority diseases [6].
Hypertension is a disease that occurs when the heart contracts to pump blood through the arteries to the entire body. The pressure increases when the cardiac muscles contract and decreases when they relax. However, if the muscles are relaxed but the pressure in the blood vessels does not drop below the specified threshold value of systolic blood pressure (SBP), which is 140 mm Hg, and that of diastolic blood pressure (DBP), which is 90 mm Hg. [7], the patient is considered to have hypertension. This disease could lead to complications in important organs, including the heart, which is forced to work harder. This cause the cardiac muscles and the myocardium wall to simultaneously become thicker and weaker, eventually leading to heart failure [8]. The World Health Organization (WHO) reported that 46% of adults with hypertension are unaware of their condition [9].
Hypertension patients are typically diagnosed based on their blood pressure values. The primary examination is performed by a medical professional. If the blood pressure is greater than 140/90 mm Hg [7], they must be examined again to verify whether they have primary or secondary hypertension. While primary hypertension occurs naturally, secondary hypertension is either caused by other diseases or occurs as a side effect due to certain medications [8]. In addition, the patients are examined for damage to their internal organs caused by hypertension. Then, the medical professional provides the appropriate methodology for stabilizing the blood pressure through lifestyle modifications, such as maintaining an appropriate Body Mass Index (BMI) and weight, refraining from smoking, and exercising regularly. Finally, the appropriate treatment is provided according to the requirements of each individual patient.
Diabetes is a condition in which the body has high blood sugar levels caused when starch and sugar are consumed but cannot be absorbed by the body for use. The main reason for this is inadequate production of the hormone insulin in the pancreas [10]. Thus, the body cannot transmit sugar in the form of glucose in the bloodstream to other tissue systems to burn and convert into energy for the body to use. Another reason that this occurs is the resistance of tissues or organs to insulin. As a result, the amount of sugar in the body remains in the bloodstream in large quantities. If the patients are unaware that they are diabetic and do not adjust their behavior accordingly, it might lead to various complications in the future [11–13]. The WHO reported that diabetes was the direct cause of 1.5 million deaths in 2019 alone [15].
Diabetic patients are diagnosed based on their blood sugar levels [10]. In general, the glucose level of people who do not have diabetes ranges between 70–99 mg/dL before the first meal of the day or breakfast and does not exceed 140 mg/dL within 2 hours of eating. Depending on their blood sugar levels, patients can be divided into varying levels of the disease [14]. A blood sugar level above 200 mg/dL is considered diabetic regardless of whether the person has eaten or fasted before testing. If the blood sugar level before breakfast falls between 100 mg/dL to 125 mg/dL, it is assessed as abnormal or at risk. As a result, the patient must be examined and followed up every year. If the value exceeds 126 mg/dL before breakfast, it is diagnosed as diabetes. However, if the level is less than 126 mg/dL, the patient is tested by drawing blood before and 2 hours after drinking a glucose solution.
With advancements in technology related to healthcare applications, medical data has been used for many purposes, such as disease diagnosis [16–23], symptom tracking [24], lifestyle behavior adjustment [25], and disease prediction [26, 27]. Advanced research methods have been widely developed for disease prediction. Recently, the subject of hypertension associated with diabetes has been gaining much interest because the two diseases often co-occur [28]. Many studies have adopted machine learning algorithms to create a classification model to predict only diabetes [29–31] and only hypertension [32–35]. However, models aimed at diagnosing hypertension with diabetes are rare. Therefore, this study aims to address this gap.
2 Literature Review
In general, machine learning–based methods are effective classifiers for disease prediction models, especially for hypertension and diabetes. Nasir et al. [32] predicted blood pressure-related disorders and cardiovascular diseases based on a blood pressure dataset obtained from Kaggle. This dataset included personal data as well as clinical data, including blood pressure abnormalities, gender, BMI, and age. Using four types of machine learning algorithms, including Random Forest (RF), CatBoost, Support Vector Machine (SVM), and K-nearest neighbor (KNN), the authors observed that CatBoost and RF outperformed the other algorithms. AlKaabi et al. [33] constructed and compared models for identifying patients with a high risk of hypertension, with RF outperforming other algorithms. The model included various features associated with personal and behavioral data, such as age, gender, education level, employment, tobacco use, physical activity, consumption of fruits and vegetables, abdominal obesity, history of diabetes, history of high cholesterol, and mother’s history of high blood pressure. Jain et al. [34] focused on predicting the likelihood of abnormality in blood pressure. Fifteen features representing personal data, clinical data, and behavioral data were taken into consideration, including kidney disease, adrenal and thyroid disorder, level of hemoglobin, genetic pedigree coefficient, age, BMI, sex, pregnancy, smoking, physical activity, input salt content in diet, alcohol consumption per day, input level of stress, and blood pressure abnormality. The authors applied various classifiers, such as Naïve Bayes, SVM, RF, Gradient Boosting (GB), and Logistic Regression (LR). GB and RF showed the best results in comparison with other algorithms.
Similarly, several studies have attempted to predict diabetes as well. Lama et al. [29] employed RF relatively successfully to identify people with increased type 2 diabetes or pre-diabetes risk without the known abnormal glucose regulation. The features included personal and clinical data, such as BMI, waist-hip ratio, age, systolic and diastolic blood pressure, and diabetes heredity. Mirzajani and Salimi [30] developed a model to diagnose diabetes by using several machine learning methods, including Artificial Neural Network (ANN), Basin Network, DCT (C5.0), and SVM. According to their study, DCT (C5.0) performed the best among the algorithms used. Sonar and Jayamalini [31] proposed a model to predict diabetic risk levels, with DCT identified as the best classifier as compared to ANN, Naïve Bayes, and SVM.
Recently, a limited number of studies have attempted to predict both hypertension and diabetes. For instance, Fitriyani et al. [35] proposed a model for the early prediction of type 2 diabetes and hypertension by using ensemble machine learning–based methods. However, two separate models were developed for predicting hypertension and diabetes separately. In contrast, our study proposes a single disease prediction model for both hypertension and diabetes. More specifically, a multiclass classification model is developed to predict the diabetes group, hypertension group, and hypertension with diabetes group. The literature review reveals that several types of machine learning methods are widely accepted for disease prediction models, especially ensemble machine learning–based methods. Thus, this study mainly focuses on constructing the multi-class classification model using several potential machine learning methods, including RF, GB, ET, SVM, and DCT, together with their associated feature engineering. This study employs the data set from Phaya Mengrai Hospital, Chiang Rai, Thailand, which includes personal data, clinical data, and behavioral data. The comparison of prediction results of each model, with and without feature engineering, was conducted to evaluate the prediction performance.
3 Methodology
The methodology used in this study consists of four major processes, including data collection, data preprocessing, model construction and validation, and model comparison, as shown in Figure 1. The details of each process are discussed in this section.
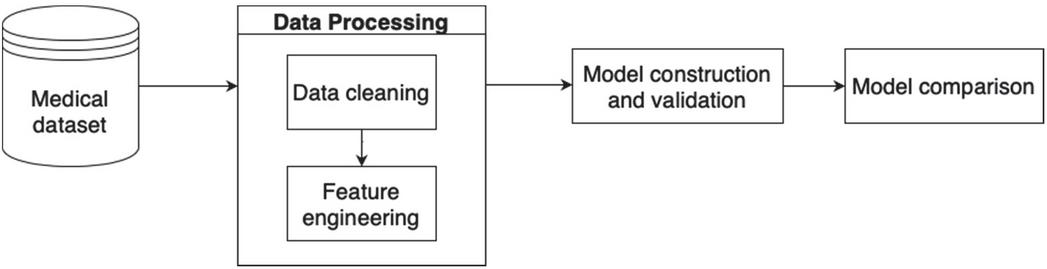
Figure 1 Research methodology.
3.1 Data Collection
This study has received ethical approval from the university. For this study, historical data for patients aged between 27–102 years from 2016 until 2021 were obtained from a local hospital, Phaya Mengrai Hospital, Chiang Rai, Thailand. The dataset contained 17,707 samples and all samples represented a unique patient. Among these, there were 12,210 samples of hypertension (69%), 4,267 samples of diabetes (24%), and 1,230 samples of both hypertension and diabetes (7%). For this study, type 2 diabetes was considered. There were 28 features across three categories of data, namely, personal, clinical, and behavioral data. The detail and descriptions of the dataset are provided in Table 1 in the appendix. Personal data included gender, age, and body weight. The clinical data included blood pressure systolic, blood pressure diastolic, and fasting blood sugar. Finally, behavioral data included smoking behavior and drinking behavior. The sample data for some of these features for ten patients are presented in Table 2.
Table 2 Sample records from the dataset
| Body | Fasting | ||||||
| Blood | Pressure | Pressure | Blood | Total | |||
| Gender | Age | Weight | Diastolic | Systolic | Sugar | Cholesterol | Triglyceride |
| Female | 48 | 52 | 80 | 129 | 147 | 164 | 75 |
| Female | 65 | 61 | 76 | 140 | 228 | 203 | 101 |
| Male | 74 | 67 | 61 | 126 | 98 | 175 | 200 |
| Female | 46 | 53 | 84 | 139 | 121 | 213 | 160 |
| Male | 73 | 70 | 70 | 140 | 124 | 200 | 314 |
| Female | 61 | 48 | 71 | 131 | 107 | 240 | 310 |
| Female | 58 | 59 | 71 | 122 | 130 | 173 | 161 |
| Male | 70 | 63 | 68 | 126 | 125 | 175 | 204 |
| Female | 51 | 53 | 60 | 110 | 88 | 280 | 135 |
| Male | 56 | 66 | 79 | 109 | 116 | 135 | 108 |
3.2 Data Preprocessing
Data preprocessing is a crucial procedure used for manipulating data, inputting missing values, and encoding data for use in machine learning techniques. In this study, the data preprocessing process consisted of 2 main steps, data cleaning, and feature engineering, as shown in Figure 2. These steps are explained in detail in this section.
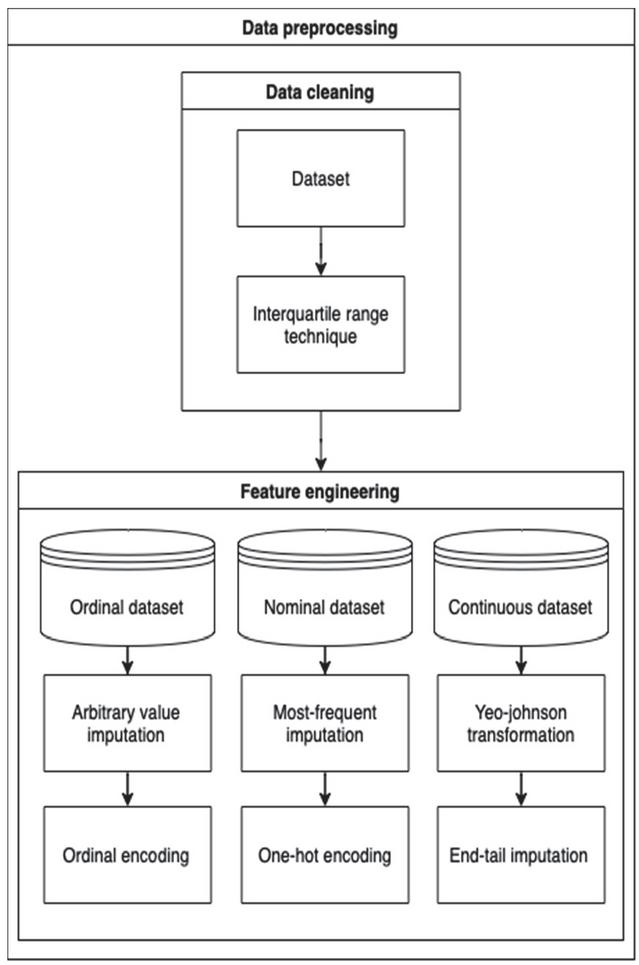
Figure 2 Data processing process.
3.2.1 Data cleaning
Data cleaning is a procedure that is used to detect outliers in a dataset. Outliers are data points located far from other data points and can distort the outcome of the machine learning model. In this study, the interquartile range technique (IQR) [36] was used. IQR is the result of subtraction between the third () and first quartile () of a distribution, as shown in Equation (1). The upper bound value and the lower bound value are obtained from Equations (2) and (3), respectively. An outlier can be detected if the value of the data point is higher than the upper bound or less than the lower bound. Points that have values falling within the upper bound and lower bound are included in the dataset.
| (1) | |
| (2) | |
| (3) |
3.2.2 Feature engineering
Feature engineering [38] is a procedure for manipulating and transforming raw data into a usable format for machine learning. The dataset used in this study had missing values and various data types, such as ordinal data, nominal data, and continuous data. The methods used for handling missing values differ depending on the data type. Table 3 shows feature engineering processes used for different data types.
Table 3 Feature engineering for different feature types
| Data Type | Method | Applied Feature |
| Ordinal |
– Arbitrary Value Imputation – Ordinal Encoding |
– Smoking behavior – Drinking behavior |
| Nominal |
– Most-Frequent imputation – One-hot encoding |
– Gender – Family History – Urine Albumin |
| Continuous |
– Yeo-Johnson transformation – End-tail imputation |
– Age – Body Weight – Height – Body Mass Index – Waist – Respiratory Rate – Blood Pressure Systolic – Blood Pressure Diastolic – Village – Sub-district – District – Province – Fasting Blood Sugar – Total Cholesterol – Triglyceride – High-Density Lipoprotein – Low-Density Lipoprotein – Creatine – Glomerular Filtration Rate – Uric Acid – Potassium – Blood Urea Nitrogen – Blood–Brain Barrier |
As shown in Table 3, three different types of data were used in this study and were manipulated using different feature engineering processes. These are explained in detail below.
3.2.3 Ordinal data
Ordinal data is a categorical data type with a set of orders representing relationships in the data. Some examples from this study are smoking status and drinking status. For this data type, arbitrary value imputation [38] was used for filling those values that were missing from the dataset due to a specific reason. In this study, the word “missing” was used to indicate such values that were not missing accidentally. Then, ordinal encoding [38] was applied to assign a numerical value to a qualitative data type so that it could be used by a machine learning model. In this study, five levels of smoking behavior were defined, including never smoking, occasionally smoking, rarely smoking, frequently smoking, and no information. Each level was represented by the numbers 1,2,3,4, and 5, respectively.
3.2.4 Nominal data
A nominal dataset is a categorical data type with no order. There is no relationship between each variable. In the dataset used for this study, there were some missing values that could not be replaced with a number. Therefore, the most frequent imputation [38], which uses the mode value, was used to fill in missing values instead. Then, one hot encoding [38] was applied to create new features by using existing features. For instance, the gender feature had two values, namely, male and female. After encoding, males were assigned a value of 1 and females were assigned a value of 0.
3.2.5 Continuous data
Continuous data is a quantitative data type and represents a scale of measurement. It can consist of whole numbers, decimals, and fractions. In this study, the Yeo-Johnson transformation [37, 38] was used for transforming a continuous feature to obtain variables with a normal distribution, which could handle both negative and positive values. Then, the end-tail imputation [38] was used to assign missing values automatically based on constant values established on the tail end of the distribution of the feature. The Yeo-Johnson transformation is shown in Equation (4).
| (4) |
where is the observed feature that can either be 0 or have a negative value and represents the real number used as a parameter to tune the distribution, with transforming right-skewed data toward symmetry, and transforming left-skewed data toward symmetry.
3.3 Model Construction and Validation
After preparing the data, models are constructed using different machine learning methods. In this study, five models were developed; the model construction flow is shown in Figure 3.
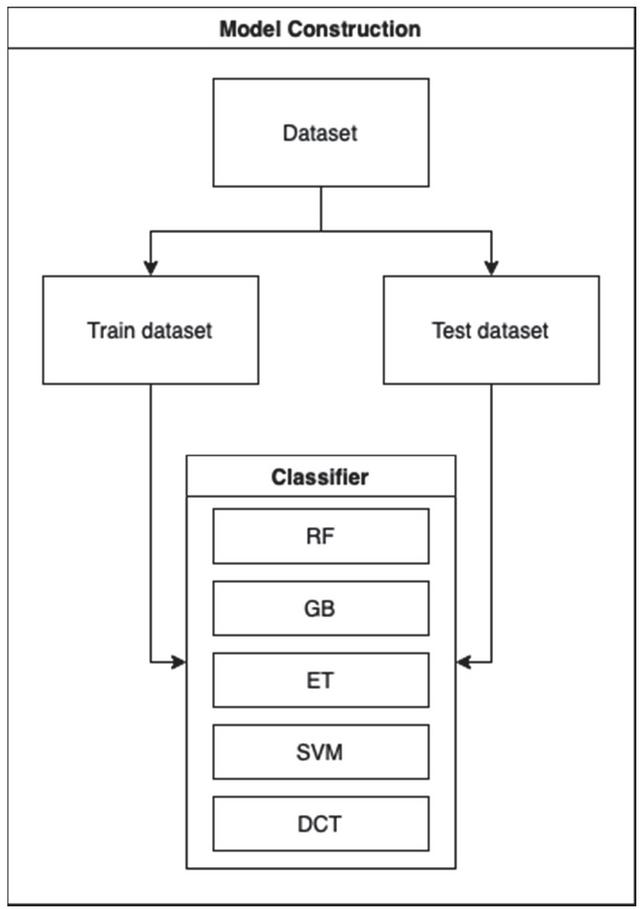
Figure 3 Model construction flow.
The dataset was split into two parts, namely, the training dataset and the test dataset. While the training set was used to train the model, the test data was treated as previously unseen data that would be used to validate model performance.
In this study, multi-class prediction was performed. Five classifiers were used, including RF, GB, ET, SVM, and DCT. The study mainly focused on classifiers used for ensemble learning, that is, RF, GB, and ET, because they are widely applied in disease prediction problems. RF generates decision trees based on randomly selected data samples; after obtaining multiple outputs from these trees, the best choice is selected. GB builds models sequentially and each iteration reduces the errors of the previous model. ET generates multiple decision trees and votes for the best prediction after combining the outputs from all the trees. In this study, the constructed models were also compared with more traditional methods, such as SVM and DCT, which are still widely applied for disease prediction. SVM creates a plane or decision boundary, which is used to segregate the classes. A plane that can maximize the distance between data points of different classes can be used for accurate classification. Lastly, the DCT is a tree-structured classifier. The nodes represent the features, the branches represent the decision rules and each leaf represents a prediction. Sequential tests are conducted to determine the best attribute for splitting the data and thus arrive at an accurate decision.
Each model was provided with the same training and testing sets. Three classes were considered including the hypertension group, diabetes group, and hypertension with diabetes group. Every constructed model was validated with five-fold cross validation. The hyperparameters were fine-tuned to obtain the best model for comparison. The details of hyperparameter tuning of each model are shown in Table 4 in the appendix. The flow of the process is shown in Figure 4.
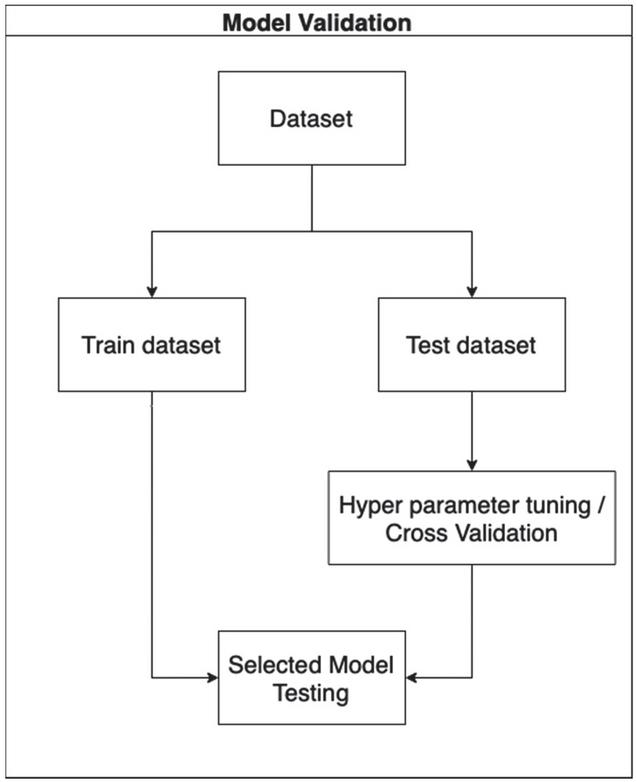
Figure 4 Model validation flow.
3.4 Model Comparison
In general, the model predictions have four different outcomes: true positive (TP), true negative (TN), false positive (FP), and false negative (FN). TP and TN indicate correct predictions. FP refers to data points that are classified as positive when they are actually negative, and FN refers to points that are classified as negative when they are actually positive. Various evaluation metrics were used in this study, including accuracy, receiver operating characteristic curve (ROC), and the average area under the curve of the ROC (average AUC-ROC). These metrics are discussed in detail below.
3.4.1 Accuracy
Accuracy is a metric that represents how successfully the model can make predictions. It is defined as shown in Equation (5).
| (5) |
3.4.2 ROC curve
The ROC curve is a graph that shows how well the model can separate the classes at all possible thresholds. This curve plots two parameters, namely, the true positive rate and false positive rate, as shown in Equations (6) and (7).
| (6) | ||
| (7) |
3.4.3 Area under the ROC
For general binary classification, the AUC represents the ability of a classifier to distinguish between two classes. Its value ranges from 0 to 1. In the case of 100% wrong predictions, the AUC is 0 and in the case of perfectly correct predictions, the AUC is 1. The One-vs-Rest (OvR) method is used to make binary classification algorithms suitable for multiclass classification. This is done by splitting the multiclass dataset into multiple binary classifications. A binary classifier is then trained on each binary classification problem. The predictions are made using the model with the highest confidence. In this study, three classes were used, including Class 1, which represented Hypertension, Class 2, which represented Diabetes, and Class 3, which represented Hypertension with Diabetes. These three groups of binary classifications are shown in Table 5. The average values of the AUC-ROC of the classes were used to represent prediction performance.
Table 5 Multi-class classification
| Classification Group | Positive Class | Negative Class |
| Binary Classification 1 | Hypertension (Class 1) |
– Diabetes (Class 2) – Hypertension with Diabetes (Class 3) |
| Binary Classification 2 | Diabetes (Class 2) |
– Hypertension (Class1) – Hypertension with Diabetes (Class 3) |
| Binary Classification 3 | Hypertension with Diabetes (Class 3) |
– Hypertension (Class 1) – Diabetes (Class 2) |
4 Results and Discussion
This section presents the evaluation metrics and comparison of the results, which are also discussed in detail.
4.1 Prediction Performance
Table 6 shows the prediction performance of each model in terms of accuracy and average AUC score.
Table 6 Comparison of prediction performance
| Accuracy | Average AUC-ROC | |||
| Without | With | Without | With | |
| Feature | Feature | Feature | Feature | |
| Classifiers | Engineering | Engineering | Engineering | Engineering |
| RF | 85.19% | 88.07% | 90.12% | 93.02% |
| GB | 84.99% | 87.27% | 89.36% | 92.26% |
| ET | 80.74% | 85.14% | 90.03% | 92.03% |
| SVM | 85.02% | 88.39% | 88.17% | 93.32% |
| DCT | 83.25% | 85.93% | 85.43% | 89.55% |
Table 6 shows that SVM with feature engineering outperformed other models based on accuracy and average AUC-ROC achieving a value of 88.39% and 93.32%, respectively. Among the ensemble learning methods with feature engineering, RF obtained the maximum average AUC-ROC score (93.02%) while ET obtained the minimum average AUC-ROC score (92.03%). RF obtained the maximum accuracy (88.07%), while ET obtained the minimum accuracy (85.14%). For all ensemble learning–based methods, it can be observed that RF performed the best in terms of both accuracy and average AUC-ROC for both with and without feature engineering. Conversely, DCT performed the worst in terms of average AUC-ROC among those with and without feature engineering. Overall, all the models performed better when feature engineering was applied.
4.2 Comparison of ROC
Figure 5 shows the ROC of all classifiers for the classification of Binary Classification 1, Binary Classification 2, and Binary Classification 3, respectively. From the figures, it is evident that all the models performed well for all groups of binary classifications, with DCT performing the worst. Specifically, SVM and the ensemble learning methods outperformed DCT for all groups in the case of binary classifications 1 and 2. However, for binary classification 3, which represents the hypertension with diabetes group, all classifiers performed worse than for binary classifications 1 and 2.
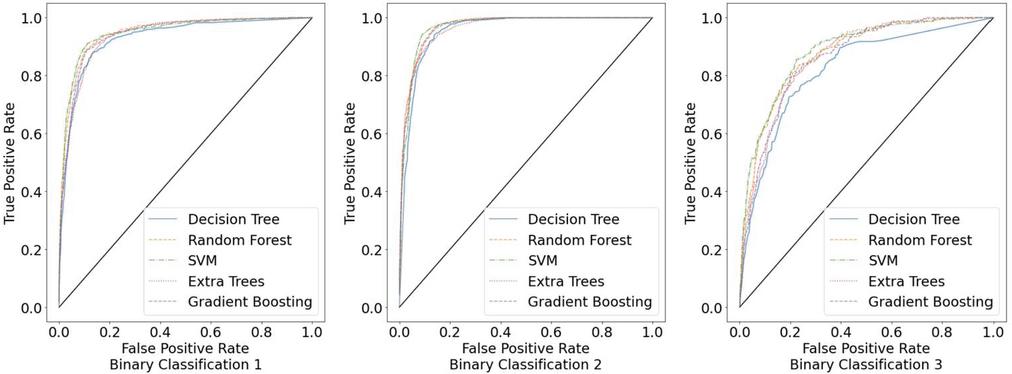
Figure 5 ROCs for three groups of binary classifications.
Based on these results, it can be concluded that SVM and the ensemble learning methods are reasonably effective models for the multi-class prediction of hypertension with diabetes. In addition, it can be observed that the unbalanced dataset affected the prediction accuracy of all models in the case of binary classification 3. Therefore, a larger number of data points for the hypertension with diabetes dataset is required for future studies. Further, future studies should consider modifying the model to handle unbalanced data and achieve better prediction performance. In addition, the model modification is expected to be more general for applying to other NCDs.
5 Conclusion
This paper proposes the multi-class classification method for the prediction of hypertension with diabetes. The data collected from Phaya Mengrai Hospital, Chiang Rai, Thailand was used in this study, which consisted of 17,077 records and 28 features. Based on the type of data, feature engineering was performed to ensure that the data was suitable for use by machine learning classifiers. The models were constructed and validated with five-fold validation. The algorithms RF, GB, ET, SVM, and DCT were used for constructing the models. Then, the prediction performance of each model with and without feature engineering was compared. Overall, all models with feature engineering achieved higher accuracy and average AUC-ROC than those without feature engineering. More specifically, SVM with feature engineering outperformed other models based on accuracy and average AUC-ROC achieving a value of 88.39% and 93.32%, respectively. For all ensemble learning–based methods, RF performed the best in terms of both accuracy and average AUC-ROC for both with and without feature engineering. In future studies, the model should be tested with a larger dataset. In addition, modifying the method for dealing with unbalanced data is suggested for improving prediction performance.
Appendix
Table 1 Features and descriptions
| Type | Feature Name | Abbreviation | Description |
| Personal Data | Gender | sex | Gender |
| Age | age | Age | |
| Body Weight | bw | Body Weight | |
| Height | height | Height | |
| Body Mass Index | bmi | Body Mass Index | |
| Waist | waist | Waist | |
| Family History | fh | Family history | |
| Village | moopart | Village | |
| Sub district | tmbpart | Sub district | |
| District | amppart | District | |
| Province | chwpart | Province | |
| Clinical Data | Respiratory Rate | rr | Respiratory Rate |
| Blood Pressure Diastolic | bpd | Blood Pressure Diastolic | |
| Blood Pressure Systolic | bps | Blood Pressure Systolic | |
| Fasting Blood Sugar | FBS | Fasting Blood Sugar | |
| Total Cholesterol | TC | Total Cholesterol | |
| Triglyceride | TG | Triglyceride | |
| High Density Lipoprotein | HDL | High Density Lipoprotien | |
| Low Density Lipoprotein | LDL | Low Density Lipoprotein | |
| Creatine | CR | Creatine | |
| Glomerular Filtration Rate | GFR | Glomerular Filtration Rate | |
| Uric Acid | Uric a | Uric Acid | |
| Potassium | k | Potassium | |
| Urine Albumin | uA Albu | Urine Albumin | |
| Blood Urea Nitrogen | bun | Blood Urea Nitrogen | |
| Blood Brain Barrier | bbb | Blood Brain Barrier | |
| Behavioral Data | Smoking behavior | smoking_type_name | Smoking behavior |
| Drinking behavior | drinking_type_name | Drinking behavior |
Table 4 Hyperparameters for each model
| Hyperparameters | ||
| Classifiers | With Feature Engineering | Without Feature Engineering |
| RF |
– bootstrap false – maximum depth 11 – maximum features log2 – minimum sample leaf 2 – minimum sample split 12 – number of estimators 390 – out-of-bags score false |
– bootstrap false – maximum depth 11 – maximum features log2 – minimum sample leaf 2 – minimum sample split 12 – number of estimators 390 – out-of-bags score false |
| GB |
– maximum depth 14 – maximum features 4 – minimum samples leaf 35 – minimum samples split 43 – number of estimators 462 |
– maximum depth 14 – maximum features 4 – minimum samples leaf 35 – minimum samples split 43 – number of estimators 462 |
| ET |
– bootstrap true – maximum depth 15 – maximum features ‘sqrt’ – minimum samples leaf 2 – minimum samples split 28 – number of estimators 170 – out-of-bags score false |
– bootstrap true – maximum depth 15 – maximum features ‘sqrt’ – minimum samples leaf 2 – minimum samples split 28 – number of estimators 170 – out-of-bags score false |
| SVM |
– kernel ‘rbf’ – gamma 0.1 – c 1 |
– kernel ‘linear’ – gamma 1 – c 0.1 |
| DCT |
– criterion ‘entropy’ – maximum depth 8 – maximum features 15 – minimum samples split 25 |
– criterion ‘gini’ – maximum depth 12 – maximum features 15 – minimum samples split 42 |
Acknowledgments
This study is a part of the research project entitled “Proactive Self-Management Mobile Application for Chronic Patients: A Case Study of Hypertensive Diabetic Patients in Chiang Rai” under the Basic Research Fund 2022, Mae Fah Luang University, which has received funding support from the National Science, Research, and Innovation Fund (NSRF).
References
[1] World Health Organization, ‘Non communicable diseases’, https://www.who.int/news-room/fact-sheets/detail/noncommunicable-diseases, Sep. 2022, Accessed: 2022-07-30.
[2] B.M. Cheung, ‘The hypertension–diabetes continuum’, Journal of Cardiovascular Pharmacology, 55(4), pp. 333–339, 2010.
[3] S. Naha, M. Gardner, D. Khangura, L. Kurukulasuriya and J. Sowers, ‘Hypertension in Diabetes’, https://www.ncbi.nlm.nih.gov/books/NBK279027, 2021, Accessed: 2022-09-18.
[4] L. Landsberg and M. Molitch, ‘Diabetes and hypertension: pathogenesis, prevention and treatment’, Clinical and Experimental Hypertension, 26(7–8), pp. 621–628, 2004.
[5] N. Rachata and P. Temdee, ‘Mobile-based self-monitoring for preventing patients with type 2 diabetes mellitus and hypertension from cardiovascular complication’, Wireless Personal Communications, 117(1), pp. 151–175, 2021.
[6] N. Rajatanavin, W. Witthayapipopsakul, V. Vongmongkol, N. Saengruang, Y. Wanwong, A. I. Marshall, W. Patcharanarumol and V. Tangcharoensathien, ‘Thailand effective coverage of diabetes and hypertension: challenges and solutions’, medRxiv, 2021.
[7] M. L. Hewett, ‘Q: What is hypertension?’, Journal of the American Academy of PAs, 23(7), pp. 45–46, 2010.
[8] T. Strasser, ‘The menace of high blood pressure’, World Health 1992; Jan–Feb: 12–13, 1992.
[9] World Health Organization, ‘Hypertension’, https://www.who.int/news-room/fact-sheets/detail/hypertension, August 2021, Accessed: 2022-07-30.
[10] C. Viedma, ‘What is diabetes?’, World Health Organization, https://link.gale.com/apps/doc/A11083636/PPNU?u=thmfu\&sid=bookmark-PPNU\&xid=b8902bb3, May–Jun. 1991, Accessed: 2022-0918.
[11] A. D. Deshpande, M. Harris-Hayes, and M. Schootman, ‘Epidemiology of diabetes and diabetes-related complications’, Physical Therapy, 88(11), pp. 1254–1264, 2008.
[12] I. H. de Boer, and DCCT/EDIC research group, ‘Kidney disease and related findings in the diabetes control and complications trial/epidemiology of diabetes interventions and complications study’, Diabetes Care, 37(1), pp. 24–30, 2014.
[13] O. Kurkela, J. Nevalainen, M. Arffman, J. Lahtela, and L. Forma, ‘Foot-related diabetes complications: care pathways, patient profiles and costs’, BMC Health Services Research, 22(1), pp. 1–11, 2022.
[14] Mayo Clinic, ‘Diabetes - Diagnosis and treatment’, https://www.mayoclinic.org/diseases-conditions/diabetes/diagnosis-treatment/drc-20371451, Oct. 2020, Accessed: 2022-07-30.
[15] World Health Organization, ‘Diabetes’, https://www.who.int/news-room/fact-sheets/detail/diabetes, Nov. 2021, Accessed: 2022-07-30.
[16] M. Chen, Y. Hao, K. Hwang, L. Wang and L. Wang, ‘Disease prediction by machine learning over big data from healthcare communities’, IEEE Access, 5, pp. 8869–8879, 2017.
[17] N. Barakat, A. P. Bradley and M. N. H. Barakat, ‘Intelligible support vector machines for diagnosis of diabetes mellitus’, IEEE Transactions on Information Technology in Biomedicine, 14(4), pp. 1114–1120, 2010.
[18] S. Mohan, C. Thirumalai and G. Srivastava, ‘Effective heart disease prediction using hybrid machine learning techniques’, IEEE Access, 7, pp. 81542–81554, 2019.
[19] S. Tabik, et al., ‘COVIDGR dataset and COVID-SDNet methodology for predicting COVID-19 based on chest X-ray images’, IEEE Journal of Biomedical and Health Informatics, 24(12), pp. 3595–3605, 2020.
[20] H. C. Shin, et al., ‘Deep convolutional neural networks for computer-aided detection: CNN architectures, dataset characteristics and transfer learning, In IEEE Transactions on Medical Imaging, 35(5), pp. 1285–1298, 2016.
[21] V. Vinodhini, A. Vishalakshi, G. N. Chandrika, S. Sankar and S. Ramasubbareddy, ‘Predicting vasovagal syncope for paraplegia patients using average weighted ensemble technique’, Journal of Mobile Multimedia, pp. 135–162, 2022.
[22] S. Sankar, A. Potti, G. N. Chandrika and S. Ramasubbareddy, ‘Thyroid Disease Prediction Using XGBoost Algorithms’, Journal of Mobile Multimedia, 18(3), pp. 1–18, 2022.
[23] J. V. D. Prasad, A. R. Pratap, and B. Sallagundla, ‘Machine learning based clinical diagnosis of liver patients with instance replacement’, Journal of Mobile Multimedia, 18(2), pp. 293–306, 2021.
[24] S. Das, B. Amoedo, F. De la Torre and J. Hodgins, ‘Detecting Parkinsons’ symptoms in uncontrolled home environments: a multiple instance learning approach’, In 2012 Annual International Conference of the IEEE Engineering in Medicine and Biology Society, pp. 3688–3691, San Diego, 2012.
[25] S. Alian, J. Li and V. Pandey, ‘A personalized recommendation system to support diabetes self-management for American Indians’, IEEE Access, 6, pp. 73041–73051, 2018.
[26] A. Khan, J. A. Doucette, R. Cohen and D. J. Lizotte, ‘Integrating machine learning into a medical decision support system to address the problem of missing patient data’, In 2012 11th International Conference on Machine Learning and Applications, 1, pp. 454–457, Boca Raton, 2012.
[27] S. Pitoglou, Y. Koumpouros and A. Anastasiou, ‘Using electronic health records and machine learning to make medical-related predictions from non-medical data’, In 2018 International Conference on Machine Learning and Data Engineering (iCMLDE), pp. 56–60, Sydney, 2018.
[28] MedlinePlus, ‘High Blood Pressure’, https://medlineplus.gov/highbloodpressure.html, Accessed: 2022-07-30.
[29] L. Lama, et al., ‘Machine learning for prediction of diabetes risk in middle-aged Swedish people’, Heliyon, 7(7), p. e07419, 2021.
[30] S. S. Mirzajani, ‘Prediction and diagnosis of diabetes by using data mining techniques’, Avicenna Journal of Medical Biochemistry, 6(1), pp. 3–7, 2018.
[31] P. Sonar and K. Jayamalini, ‘Diabetes prediction using different machine learning approaches’, In 2019 3rd International Conference on Computing Methodologies and Communication (ICCMC), pp. 367–371, Erode, 2019.
[32] N. Nasir, et al., ‘Hypertension classification using machine learning part II’, In 2021 14th International Conference on Developments in eSystems Engineering (DeSE), pp. 459–463, Sharjah, 2021.
[33] L. A. AlKaabi, L. S. Ahmed, M. F. Al Attiyah and M. E. Abdel-Rahman, ‘Predicting hypertension using machine learning: Findings from Qatar Biobank Study’, Plos One, 15(10), p. e0240370, 2020.
[34] K. Jain, J. Jha and Y. Jha, ‘Comparative analysis of machine learning algorithms for blood pressure prediction’, In 2021 Third International Conference on Inventive Research in Computing Applications (ICIRCA), pp. 636–642, Coimbatore, 2021.
[35] N. L. Fitriyani, M. Syafrudin, G. Alfian and J. Rhee, ‘Development of disease prediction model based on ensemble learning approach for diabetes and hypertension’, IEEE Access, 7, pp. 144777–144789, 2019.
[36] P. Nair, and I. Kashyap, ‘Hybrid pre-processing technique for handling imbalanced data and detecting outliers for KNN classifier,’ In 2019 International Conference on Machine Learning, Big Data, Cloud and Parallel Computing (COMITCon), pp. 460–464, Faridabad, 2019.
[37] J. Raymaekers and P. J. Rousseeuw, ‘Transforming variables to central normality’, Machine Learning, pp. 1–23, 2021.
[38] S. Ozedemir, ‘Feature Engineering Bookcamp’, Manning Publications, New York, USA, 2022.
Biographies

Mongkhon Sinsirimongkhon received the bachelor’s degree in software engineering from Mae Fah Luang University, Thailand in 2021. Currently working in Accenture as an Application development associate and studying for the master’s degree in computer engineering at Mae Fah Luang University, Thailand. His research interests include Artificial Intelligence, Machine Learning, and Feature Engineering.

Sujitra Arwatchananukul received the B.S. and M.S. degrees in Computer Science from Chiang Mai University, Thailand, in 2004 and 2008 respectively and Ph.D. degree in Computer Engineering from Yunnan University, China.
In 2016, she joined the School of Information Technology, Mae Fah Luang University, as a lecturer. Her current research interests include Data Science, Machine Learning, Data Analysis, Image Processing, Software engineering, Algorithms and Database Management system.

Punnarumol Temdee received B.Eng. in Electronic and Telecommunication Engineering, M. Eng in Electrical Engineering, and Ph.D. in Electrical and Computer Engineering from King Mongkut’s University of Technology Thonburi. She is currently a lecturer at School of Information Technology, Mae Fah Luang University, Chiang Rai, Thailand. Her research interests are social network analysis, artificial intelligence, software agent, context-aware computing, and ubiquitous computing.
Journal of Mobile Multimedia, Vol. 19_3, 799–822.
doi: 10.13052/jmm1550-4646.1937
© 2023 River Publishers