Social Media Insights About COVID-19 in Portugal: A Text Mining Approach
Carolina Ferraz Marreiros2, João Bone2, 4, Joao C. Ferreira1, 2,* and Ricardo Ribeiro3, 5
1Inov Inesc Inovação—Instituto de Novas Tecnologias, 1000-029 Lisbon, Portugal
2Instituto Universitário de Lisboa (ISCTE-IUL), ISTAR, 1649-026 Lisboa, Portugal
3INESC-ID: INESC-ID Lisboa, Portugal
4Select Data, Anaheim, CA, USA
5Iscte – Instituto Universitário de Lisboa, Portugal
E-mail: Joao.Carlos.Ferreira@iscte-iul.pt
*Corresponding Author
Received 30 April 2022; Accepted 31 May 2022; Publication 20 September 2022
Abstract
The rapid spread of COVID-19 around the world had a significant impact on daily life. As in other countries, measures were taken in Portugal to combat the exponential increase of cases, such as curfews and the use of masks. Thus, in parallel with the direct consequences on health and the healthcare sector, the pandemic also caused changes in human behavior from a sociological viewpoint.
The objective of this dissertation is to attain a perception of the reality concerning COVID-19. For this purpose, real-time data was extracted from three sources, two of them being social media platforms – Twitter and Reddit – and the other one being Público, a Portuguese online newspaper. The adopted approach, based on topic modelling and sentiment analysis, was validated within the Portugal context, concerning data over a period of one year, but it can equally be employed in similar situations and other countries and provide decision-making support.
After the data extracting, it was prepared for application of natural language processing (NLP) tools specific to the Portuguese language, which can represent a challenge due to the lexical richness. With the gathered information, a dashboard was built, with the purpose of gaining insights on the COVID-19 pandemic in Portugal. It was concluded that the topics discussed on social media reflect the events related to the pandemic. In a final stage, these dashboards were evaluated by public health experts, who highlighted the potential of the results obtained. The data and dashboards will be made available to the scientific community upon request.
Keywords: Social media, COVID-19, natural language processing, sentiment analysis, topic modeling, public opinion.
1 Introduction
The first known cases of COVID-19 were reported in late December in Wuhan City, China, with the first recorded death taking place in the second week of January 2020 [1]. Despite the decision to isolate the city as early as the end of January, the high contagion rate of the disease allowed cases and outbreaks to quickly be confirmed in other countries such as Japan, South Korea, and Thailand [1].
Approximately two months later, in March 2020, the first case was recorded in Portugal. Consequently, 16 days later, contingency measures were implemented, such as mandatory confinement along with other public health measures [2]. Despite these efforts, by the end of February 2021, about 7.82% of all Portuguese population were infected, out of those about 2.2% died from it [3].
Since the first lockdown in Portugal, several contingency measures were applied, and three waves of COVID-19 were identified [4]. Until February 2021, Portugal has been in a state of emergency twice, and consequently in mandatory quarantine twice. In the meantime many business areas were heavily impacted, for example, restaurant access conditions restrictions on access and use of restaurants were imposed and cultural venues were closed [4].
All the measures applied are reflected in public opinion, both because they require adaptability, and also for the reason that they are closely related to the number of cases in Portugal. Inevitably, the whole epidemiological evolution has had a direct impact on the population’s daily life, not only in terms of health – which is directly related to the virus – but also in economic, social, and psychological terms [5].
Alongside the pandemic context experienced worldwide, there was an increase in the usage of the Internet, when compared to the pre-pandemic era. Internet and social media usage has reached unparalleled heights [6]. It is possible to verify this increase in the use of social media, especially during the confinement. In July 2020 there was a 43% increase in the time spent on social media along with a 36% increase in the time spent on mobile applications [7]. One of these social media platforms is Twitter, a micro-blogging service, which can be used to as a tool to identify sentiments and information regarding public health issues, as has already been proved in the past [8]. Along with it, Reddit, the social news aggregation website, has also proven to be a significant platform for opinion-related analysis [9]. On this platform, users can post, comment on and vote for published content, which is grouped by themed sub-forums also known as subreddits.
In this work, we extracted data (from two social media and a news website), treated the data using NLP tools, modeled the data (to get topics and associated sentiment) and generated visualizations of the data, in a dashboard (written in English), to gain insights related to the pandemic. To the prototype built here, adapted to the Portuguese case, was given the name CovidSocialSensing Platform. Also, the data collected corresponds to more than one year of the pandemic and may be relevant to the scientific community, as it contributes with a methodology for the application of NLP tools to extract topics and its associated sentiment from different types of data, corresponding to a countrywide health-related event, as well as it may have a societal impact as it may be useful for public health decision makers.
2 Background
2.1 Social Media
In recent years, social networking sites have been growing and evolving, and have therefore become important platforms for analyzing public opinion on various topics [10]. Today, public access to information is inseparable from the Internet, because social media allow easy and free communication, interaction and access to information [11].
Within the concept of social media it is possible to include various applications with different uses, such as Twitter and Reddit. The first is a micro blogging application that allows the sharing of short texts [12]. On this platform, it is common to share reactions and opinions in real time, on any topic [13]. The Reddit platform, on the other hand, allows its users to post content such as text, images or videos, and this content can be commented and rated by other users [8]. This social media is known for having its contents organized by “subreddits”, which can be interpreted as sub topics.
Today, in Portugal, the most used social networking platforms are YouTube and Facebook [7]. Although Twitter is the 8 platform with more registered users, it represents 39.4% of Internet users [7]. Reddit is in the 12 place, with a representation of 17.2%.
Due not only to the recurrent sharing of information on social networks, but also to their diversity, social networks have proven to be a useful tool for knowledge extraction [14]. In the literature search conducted, the collection of information from Twitter, related to COVID-19, revealed to have a direct relationship with the chronological events concerning the pandemic [15]. Additionally, the literature under analysis stresses the importance of analyzing the variation of the hashtags used on Twitter. Reddit has also proven to be a useful source to gauge public opinion, both in the context of community engagement [16] and in the context of elections [9] or infectious diseases [9].
2.2 Knowledge Extraction, Through Text Mining Tools, Regarding COVID-19
The whole epidemiological context has been revealing a direct impact on society. In August 2020, a study exploring the psychological impact of the pandemic in Portugal was published [17]. In the online survey performed, it was shown that relatively low levels of anxiety, depression and stress were registered, but around 50% of the participants revealed a moderate to severe psychological impact. It was also concluded that the most fragile fraction of the Portuguese population are unemployed people, women, people with little education and living in rural areas.
According to a study [18] conducted in March 2020 in the United States, the posts on the subject of the Coronavirus grew a lot at the end of February, and it was concluded that this increase was due to the fact that shortly before, the first case of COVID-19, of unknown origin, had been identified. So, this study concludes that social media analysis can contribute to the perception of the population’s sentiments regarding the evolution of the pandemic. Another research study [19] performed a textual analysis in order to analyse public sentiment, focusing on the evolution of fear, a sentiment associated with the rapid spread of the virus. They also identified the main keywords and trends related to COVID-19, and highlighted the use of descriptive textual analytics and data visualization.
Some papers [20], while also focusing on knowledge extraction from social media on COIVD-19, do not adapt their analysis to a particular country. Another aspect in which this work stands out, is that it treats more than a year of data. For example, [21] only gathers data corresponding to the first three months of the pandemic. Also the fact that it has been assessed and valued by experts in the field, does not happen in all articles that address this topic [22].
In spite of being a place where conclusions can be drawn regarding public opinion, social media are also a focus of misinformation [23]. A recent study aimed to identify the impact of misinformation on Twitter. So, to reach this goal line a spatial and temporal analysis of the pandemic and its correlation with the published tweets was performed, along with sentiment analysis and identification of the most talked about topics [24].
Closely related to our work are the studies presented in Table 1. All of them have as objective the extraction of knowledge regarding this topic.
Table 1 Features of publications about knowledge extraction regarding public health
| Geography | Disease | Data Source | Objective |
| United Kingdom | COVID-19 | Interviewees | Explores public views on the possibility of using a COVID-19 contact-tracing app public health intervention [25] |
| United States | Oncology-related diseases | Tweets written in English, from the United States | Building an automatic process for knowledge extraction about oncology-related content from social networks [26]. |
| United States | COVID-19 | Tweets written in English, from United States | Identify topics from the public COVID-19-related discussion on Twitter to further provide insight into public’s opinion [27]. |
| China | COVID-19 | Major Chinese social media platforms, such as WeChat, Weibo, and TikTok | Providing new insights into the characteristics of the COVID-19 infodemic [28] |
The first row of Table 1 is about a study conducted in the United Kingdom [25], in August 2020, which uses interviews to understand public opinion about the possibility of using a contagion tracking app developed by the British government. The interviews were conducted during the month of April, with 35 different people. The second article [26] in Table 1 was conducted in the United States in early 2020 and focuses on oncological diseases. The data was extracted from Twitter, written in English and coming from the United States. In addition to grouping into classes and labelling the data received, this study seeks to extract extracting oncology-related knowledge from social media. Another study [27], the third in Table 1, also conducted in the United States in 2020, seeks to identify the top topics discussed on social media related to COVID-19. For this, a large-scale COVID 19 Twitter data set was used. The insights obtained are related to the concerns of the population about COVID-19. The fourth study [28] in Table 1 was conducted in China, in 2020. The data used were posts related to COVID-19 published on major Chinese social media. The goal in this paper is to explore the quantity, sources, and theme characteristics of the COVID-19 infodemic over time, in order to gain insights into the topic.
These four studies, mentioned in the previous paragraphs and present in Table 1, seek to extract knowledge about the population’s opinion on public health issues. The work developed here has some common characteristics with these studies, such as the use of Twitter as a data source and the disease under analysis being COVID-19. However, the main differentiating factors are the following: automatic information extraction from social networks (Twitter and Reddit) and a news platform (Público) – since January 1, 2020, to March 16, 2021 – and from this information we extract sentiments and topics towards a support decision system. Also, for this analysis, it was considered the correlation between the chronological events linked to COVID-19 and the data obtained, only from one country, Portugal in this case.
2.3 New Contribution
To our knowledge, this is the first work to bring together over a year of data collected during the pandemic (from social media and a news platform). Besides the platform developed here – CovidSocialSensing – being adaptable to any country, it was applied to the Portuguese case and afterwards evaluated by public health experts. We have also taken into account all the epidemic stages the country has been through, in order to carry out the analysis accordingly. So, both the identification of topics and the associated sentiment, were carried out bearing in mind the periods identified.
Of the works identified in the previous section, none of them meets all these characteristics, which is in line with the importance given to the developed platform by all the experts. It was also concluded that this study can contribute to decision-making within the COVID-19, or similar events.
3 Methodology
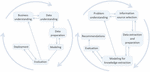
The stages of the work developed follow the Cross-Industry Standard Process of Data Mining (CRISP-DM) [29], consisting of six stages (illustrated in Figure 1): Business Understanding, Data Understanding, Data Preparation, Modeling, Evaluation, and, finally, Deployment.
This model was chosen not only because it has the ability to adapt to any business context – in this case, the pandemic context – but also because it is suitable for data mining projects. Since this methodology is a flexible process, an adaptation was made (model represented on the right side of Figure 1) so that each step of the model may reflect a stage of the needs of the work developed here. This adaptation allows the use of data in textual format extracted from social networks, instead of dealing with numerical data. In this sense, the adaptation of CRISP-DM methodology served as a guide for the development of the prototype of the CovidSocialSensing Platform:
1. In the Problem understanding phase the whole pandemic context in Portugal was analyzed. To this end, the events that had, in some way, a national impact and are related to COVID-19 were identified chronologically;
2. Before proceeding to data collection and processing, we identified the potential sources of information in order to identify which sources to use. This step was one of the changes made to the original structure of the CRISP-DM model;
3. In the next phase, Data extraction and preparation, as the name implies, the extraction and preparation of data from three different information sources was performed. An automatic form of extraction was generated, limiting the results to data containing the key words indicated and between the intended dates. Also in this phase, the data are treated and cleaned so that the final results obtained are of higher quality. The final goal of this phase is that after pre-processing, the information can be well interpreted by the tools used;
4. In Modeling for knowledge extraction phase, text mining tools were applied, both for topic detection and sentiment analysis;
5. In the Evaluation phase, the results obtained were analyzed to ensure that the model adequately meets the objectives. The evaluation was carried out by three specialists in the field who highlighted the importance of the work developed here. In this sense, the data visualization component plays a key role in this step;
6. Finally, in this last phase, the the piece of advice mentioned by the evaluators has dutifully been considered for further implementation in future work.
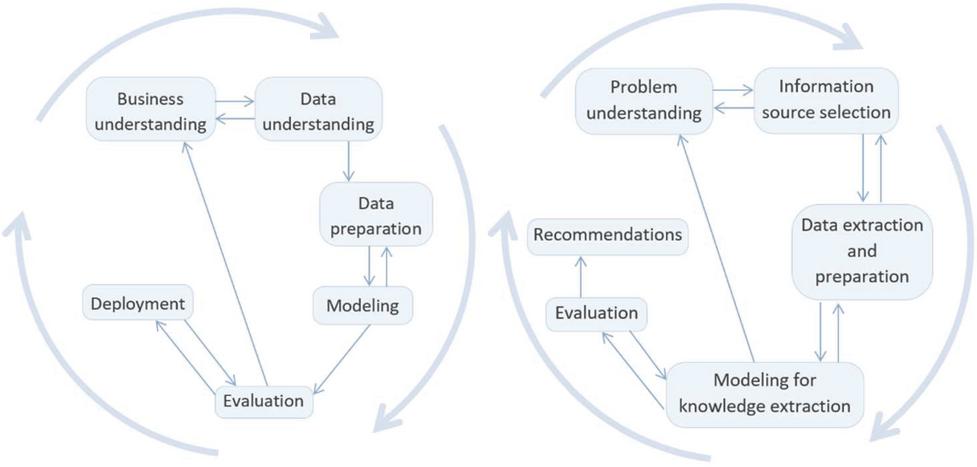
Figure 1 CRISP-DM (left side) and proposed methodology (right side).
The evaluation process of the dashboards was based on the criteria proposed by [30]. There is a hierarchy of criteria included in this methodology, and the ones used in this work are: efficacy (from goal dimension), consistency with organization (from environment dimension), clarity (from structure dimension), style (from structure dimension) and learning capability (from evolution dimension).
After the selection of the criteria to be used, the objectives associated to each criterion, with two iterations of the CRISP-DM, were defined. Each of these objectives will be evaluated, and therefore an evaluation scale is required. To this end, ISO 15504’s four-point NLPF scale [31] was chosen, which contains four levels: Not Achieved (NA), Partially Achieved (PA), Largely Achieved (LA) and Totally Achieved (TA).
4 Prototype of CovidSocialSensing Platform
This research work reflects the Portuguese case, but all the steps elaborated can be carried out in the context of any other country.
4.1 Pandemic Context in Portugal
The world’s first case of COVID-19 appeared in China, in January, 2020 [1]. Later that month, the first cases were also identified in Europe, in France. However, it was only in March that the virus officially reached Portugal [3]. Although the first national case was reported on March 2, 2020 [4], 8 days earlier the first infected Portuguese (not resident in Portugal) was identified [32]. This situation made the pandemic increasingly seen as a reality in Portugal, since the first case identified in the world dates back to the end of December, 2019 [1].
Along with the decisions taken in most of the countries with a growing number of cases, in Portugal, on March 12, 2000, schools were closed, discos shut down, and the capacity of restaurants and shopping centers was limited [4]. On March 16, the first death was recorded in Portugal, and, two days later, mandatory lockdowns and restrictions on circulation on public roads were implemented. These measures led to the generalization of telework, as well as the shutdown of public service establishments [4]. In the same month, the first news of infection outbreaks in nursing homes appeared.
As far as the education sector is concerned, distance learning was maintained and tele-school began on April 20, 2020. Ten days later, the government started the planning process for the transition from the state of emergency, decreed on March 18, to the state of calamity, which began on May 3 [4]. This new circumstance allowed the opening of cultural services and made it mandatory to wear masks in closed places. The main difference from the state of emergency was that the lockdown ceased to be compulsory [4].
On May 18, four months after the state of emergency was declared, restaurants and day care centers opened, and distance learning classes for 11th and 12th grades were discontinued, and were then in person. At the end of May, the deconfinement plan was approved, but special measures were applied in the Lisbon area (until June 15), due to the increase in the number of cases. Only at the beginning of July did the football calendar reopen, but the games were played behind closed doors [4]. On the first day of the following month, Portugal goes on alert, except for some areas in Lisbon, which, due to the high number of infections, remained in a state of calamity (until the end of the month). With the end of the state of calamity in Lisbon, nightclubs were then allowed to operate, provided they met the same requirements as restaurants. Since the appearance of the first cases, Portugal faced a gradual increase in the number of cases, but August 3 was the first day without any fatalities [4].
In the middle of September, a state of contingency was declared until the end of the month. As a result, in-presence classes for all school years were resumed. The state of contingency was expected to apply until September 30, but due to the increase in cases, this state lasted until October 14, and from that day on, a state of calamity was announced. In addition to this measure, gatherings of more than five people were prohibited, as well as family events and academic celebrations [4]. It was also at this time that a parliamentary proposal requiring the mandatory use of the “stayawayCovid” application was presented, which ended up being rejected because it caused some controversy in public opinion [4].
From October 22 on, the days when records were broken in regards to the number of cases registered in Portugal became more and more frequent. On the 28th of the same month, it became mandatory to wear masks in public spaces and it was forbidden to move between municipalities, except on weekdays [4]. Two weeks later, a curfew was decreed between 11 pm and 5 am on weekdays, and from 1 pm on weekends.
In December, 22 million vaccines were purchased and the vaccination plan was presented (which began on December 27). On the 5th, the measures to be applied for Christmas and New Year’s Eve were announced: circulation between municipalities was allowed during the festive season, with a ban on circulation after 2 am. In addition to these measures, the government declared a state of emergency [4].
At the beginning of the second half of January, despite the state of emergency, Portugal was the country with the highest number of new cases, of infection in the world per million inhabitants. Given this scenario, the government closed the schools for two weeks [4]. On January 15, a new compulsory quarantine was implemented (planned until March 16), but on the 24th the presidential elections took place. A few days later, the first news of alleged irregularities with the vaccines surfaced, because they were given to people who did not belong in priority groups.
4.2 Information Source Selection
After gathering information on what has happened in Portugal since COVID-19 was identified by the authorities, this phase of the methodology aims to identify the sources of public information that can be used.
To perform the analysis proposed in this study, it is necessary that the data reflects the public opinion of the Portuguese population regarding the pandemic and that the amount of data collected is large enough to apply text mining techniques. In this sense, it is intended to identify the sources of information, not only with the largest volume of data, but also with the greatest amount of diversified and relevant content for the analysis.
Social media were the main focus, due to the fact that they are platforms for interaction with the users – and consequently where they share their opinions, concerns or interests – but other sources were also used, such as news sites. This allows to compare different kinds of sources, improving the understanding of how public perception is viewed across information sources.
The following sources were selected:
• Twitter – It is a micro blogging application, that is, a blog that allows users to make short updates of images and text. This application allows users to share short texts, called “tweets”, and make comments on them [12]. One of the characteristics of this platform is the use of hashtags, used most frequently to identify the theme of the tweet.
• Reddit – This platform, which has been growing in the last few years, wants its users to submit, commit and rate posts. People who want to join the Reddit community classify themselves as “redditors”, a combination of “reddit” and “editors”. To publish a post on this platform, it is first necessary to choose the topic, “subreddit”, with which you want the post to be associated. This method allows posts to be organized by theme [30].
• Público – This last source is a news site that, despite being Portuguese, gathers both national and global information. On this platform the news articles are organized by topic and can be commented on by its readers.
4.3 Data Extraction and Preparation
Based on the pandemic context in Portugal, a set of terms was developed for search on the identified sources. Subsequently, the terms that were characterized by a high number of results, and that were generic enough to obtain the desired data, were chosen. The chosen criteria focused on the words which were most associated with the theme, along with the most used hashtags, in Portugal. These were: pandemia, epidemia, sars-cov2, covid, teletrabalho, stayhome, FiqueEmCasa, covax, confinamento and quarentena.
As mentioned, the analysis was carried out in eight different time periods. Table 2 allows to better understand the amount of data associated to each temporal period. It is observed that, as far as Público is concerned, the amount of data does not oscillate much between time periods. The same does not happen with Twitter, which presents an oscillation in the amount of data between time periods.
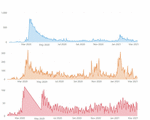
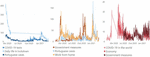
The amount of data extracted from Twitter stands out when compared to the number of data extracted from Reddit and Público. In Figure 2, it is possible to find the data extracted over time, on Twitter (blue line), Reddit (yellow line) and Público (red line). A total of 46 850 tweets, 27 105 posts on Reddit and 11 587 news items were extracted. In all three sources there is a peak around the second week of March, probably related to the beginning of the first state of emergency.
In what concerns data preparation, the aim is to clean the information in order to provide the data in the most uniform way possible to the text mining and natural language processing tools. Cross-sectional transformations were applied to the data from the three sources analysed, however, for Twitter it was necessary to carry out a deeper treatment.
Table 2 Number of data extracted from each source and for each time period
| Period | Público | ||
| January 1, 2020 – First Portuguese infected | 416 | 229 | 226 |
| First Portuguese infected – Beginning of state of emergency | 7 401 | 2 2019 | 865 |
| Beginning of state of emergency – End of state of emergency | 16 260 | 5 5 141 | – |
| Beginning of state of calamity – End of state of calamity | 5 841 | 3 3 605 | 2 571 |
| Beginning of state of alert – End of state of alert | 4 002 | 3 137 | 1 937 |
| End of state of alert – Beginning of state of emergency | 3 459 | 4 046 | 1 399 |
| Beginning of state of emergency – Beginning of second lockdown | 4 512 | 4 579 | 2 138 |
| Beginning of second lockdown – End of second lockdown | 4 986 | 4 335 | 2 451 |
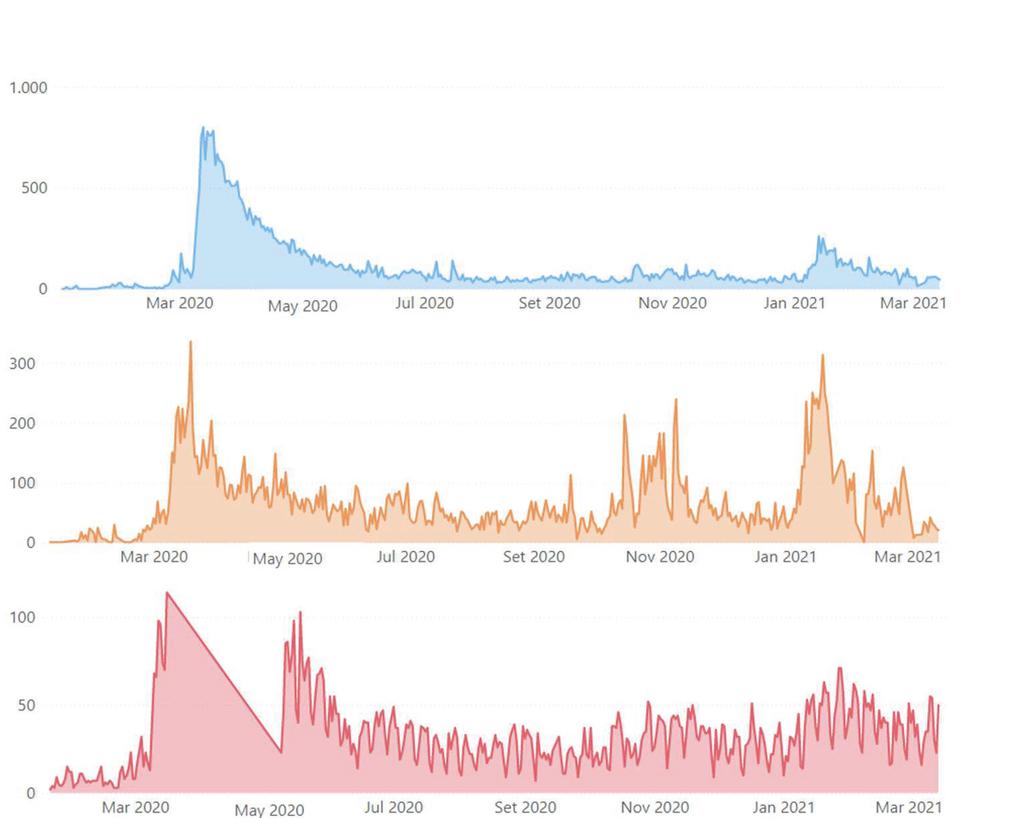
Figure 2 Data extracted over time from Twitter, Reddit and Público, respectively.
After all these steps of data cleaning and standardization, in order to obtain better results in the subsequent analysis, we performed the tokenization of the text fields. This process converts a text to a sequence of tokens, usually words. This is an essential step before data can be modelled. In this sense, the following tasks were carried out:
• Format standardisation – This transformation was applied essentially in the field with the date information, because not all three sources present the date in the same way. So, in addition to having excluded the information relative to the time, the date format was transformed to the dd/mm/yyyy format.
• Lower case unification – In order for the data to have the same representativity, it was transformed so that all the characters of all the words could be in lower case.
• Elimination of duplicate records – This step was taken in order to avoid considering repeated data in the analysis that might bias the future analysis. To this end, the text field of each source was used.
• Elimination of records with insufficient information – It is essential that text fields have sufficient word richness for analysis to be successful. For this reason, records with less than two words were removed, and therefore blank records were also deleted. In addition, words with a total of less than three characters were removed.
• Stopwords removal – For data normalization, Portuguese stopwords were removed from the text fields under analysis. To do so, the Natural Language Toolkit (NLTK) [33] for Python was used.
• Delete numbers – Although numbers can be representative of relevant information for analysis, text mining tools focus on textual analysis, and therefore perform better if they do not receive data in numerical format. For this reason, the numbers of the text fields were eliminated.
• Punctuation removal – Finally, punctuation was eliminated, also with the aim of increasing the quality of the subsequent analysis.
• {Link removal (only on Twitter data)} As for information regarding links, it was necessary to consider that a tweet can contain several types of web links like http links or bitly links. Thus, and as the desired was to eliminate only the link text, it required the use of regular expressions.
• Elimination of retweet and user information (only on Twitter data) – In Twitter data, a retweet is indicated by the use of the characters “RT” at the beginning of the tweet. Although it is a way to identify the retweet, these characters can add noise to the analysis. It was also in this sense that we chose to remove the identification of a username, which appears after the “@” character.
• Removal of audio and video information (only on Twitter data) – Finally, the information relating to videos and audios has been defined, which is preceded by the characters “VIDEO” and “AUDIO”.
4.4 Modeling for Knowledge Extraction
Knowledge extraction involved performing data two data treatments. The first – topic modeling – is with the aimed to identify the topics associated with each of the eight time periods. To this end, we used tools based on statistical models that, by identifying the words present in each post, group the data into clusters. With the groups meanwhile formed, the topics under analysis were soon identified and the second treatment was then applied – sentiment analysis – assigning a numerical value to each post in the topic to identify how negative or positive it is, based on the words it contains.
Topic Modeling To carry out topic modeling, the short text topic modeling (STTM) [34] approach was used. This method is based on Latent Dirichlet Allocation (LDA) [35], but it is more suitable for smaller texts, as it happens in social networks.
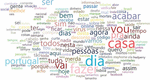
In applying this technique, it was necessary to specify the number of topics. In this sense, several experiments were performed in order to understand which was the adequate value. The data were analysed according to the periods mentioned in Table 3. As an example, in the case of the third period identified, corresponding to the period of the first state of emergency, the most frequently occurring words in Twitter are shown in Figure 3. At this stage, the stay-at-home order was introduced for the first time, so it stood out as/ became relevant analysis for the extraction of knowledge regarding the implemented measures.
In order to obtain a word cloud with the real representation of the most occurring words, the keywords used were removed. This collection of data gathers information from 15,895 tweets, with all pre-processing already done. It can be seen that the most common words in the tweets made between March 18 and May 2 are the following: “casa”/home, “dia”/day,”vou”/go, “acabar”/end, “fazer”/do and “Portugal”.
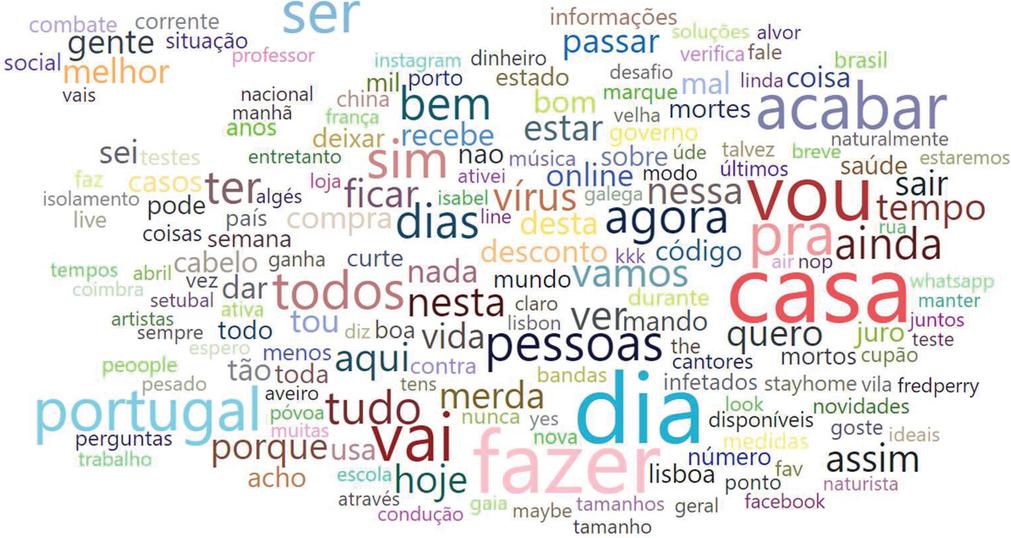
Figure 3 Most frequent words in the period of the first state of emergency in Portugal (“casa”/home, “dia”/day, “vou”/go, “fazer”/do, portugal, “fim”/end and “agora”/now).
Table 3 Words that occurred most often during emergency state, in Twitter, for each topic
| Topic Name | Top 6 Words |
| Daily life in lockdown | “casa”/home, “vou”/go, “dia”/day, “tudo”/all, “passar”/pass, “saudades”/miss |
| Portuguese cases | “portugal”, “pessoas”/people, “casos”/cases, ser/be, “todos”/all e “virus” |
| COVID-19 in Portugal | “saúde”/health, “vamos”/go, “isolamento”/isolation, “casa”/home, “obrigado”/thanks, “mais”/more |
| After lockdown | “fazer/do, “acabar”/end, “vou‘”/go, “casa”/home, “vai”/go, “dia”/day |
| Possibility of having COVID-19 | “vou”/go, “espero”/hope, “dia”/day, “provavelmente”/probably, “sei”/know, “teste”/test |
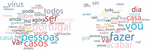
Having this group of data, the clustering in several topics was tested, and it was considered that the division in six sets was the most appropriate. Then, the themes associated with each of the groups were determined, based on the most frequent words in each of the five groups. Table 3 shows the six words that occurred most often in each of the identified topics. Figure 3 gathers the word clouds associated to two of the identified topics: “Portuguese cases” and “After lockdown”, respectively.
The subset associated to “Portuguese cases” gathers 866 tweets. And it was concluded that this would be the topic associated with this cluster due, not only to the fact that the words “portugal”, “pessoas”/people, “casos”/cases are the most predominant ones, but also because the remaining words are related to the theme.
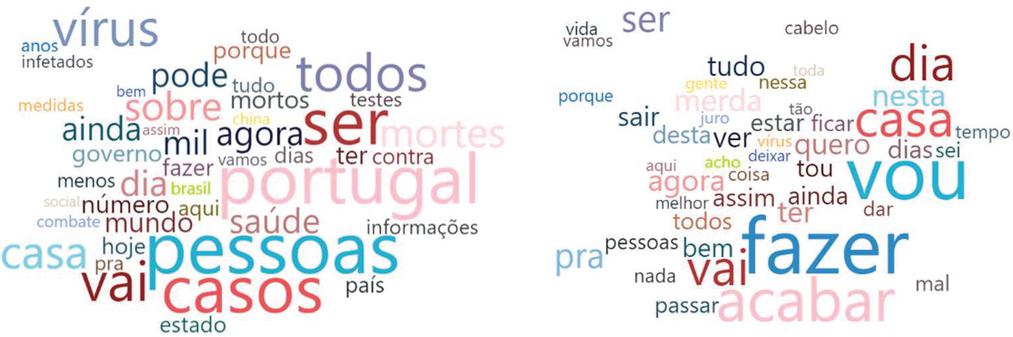
Figure 4 Most frequent words for the topic “Portuguese cases” (“portugal”, “pessoas”/people, “casos”/cases, ser/be, “todos”/all e “virus”) and “After lockdown” (do, go, end, home, day, better, time).
In the case of the “After Lockdown” theme, the most frequent words are verbs in the future, like “vou”/go or “vai”/go, and the words “fazer”/do and “acabar”/finish. Besides, words like “dia”/day, “passar”/pass and “quero”/want are also in the identified theme. This theme gathers 8,153 tweets, being the theme with more associated tweets (among the set of data collected in this time period).
Sentiment analysis Following the identification of the topics in each information source and in each of the eight time periods, the sentiment associated with each topic was determined. To obtain this information, the LeIA (Lexicon for Adapted Inference) [36] tool was used, which uses the VADER (Valence Aware Dictionary and sEntiment Reasoner) [37] lexicon as a basis. This tool was chosen due to the fact that it is adapted for texts in Portuguese and because it focuses on the sentiment analysis of texts expressed in social networks.
As a result of the application of this tool, four new fields are obtained with values between 1 and 1. A first field with the positive percentage of the text, another with the negative percentage of the text, another with the neutral percentage of the text and finally the value “compound” that refers to the overall normalized sentiment in the text. This last value is the one used to describe the predominant polarity in the text, according to the following logic: the sentiment is positive if the compound value is equal to or greater than 0.05, if the compound value is less than or equal to 0.05, a negative sentiment is assumed, finally, the neutral sentiment is assumed to be between 0.05 and 0.05.
Table 4 presents the sentiment values associated with some of the tweets during the period corresponding to the first state of emergency.
Table 4 Results of the LeIA tool on tweets during the first state of emergency
| Tweet | Neutral | Negative | Positive | Compound | Result |
| “A quarentena está a fazer mal a algumas pessoas, pelo que vejo…”/The quarantine is doing harm to some people, from what I can see… | 0.645 | 0.355 | 0.0 | 0.659 | Negative |
| “A força que nos faz mover, hoje foi dedicada aos que estão na linha da frente!”/The strength that makes us move, today was dedicated to those who are on the front line | 0.755 | 0.0 | 0.245 | 0.757 | Positive |
| “Nesta quarentena fiquei a saber todos os detalhes do meu quarto”/In this quarantine I learned all the details of my room | 1.0 | 0.0 | 0.0 | 0.0 | Neutral |
| “Não, não vou morrer de corona não , vou morrer de saudades…”/No, I’m not going to die of corona no , I’m going to die of nostalgia… | 0.294 | 0.706 | 0.0 | 0.925 | Negative |
| “O melhor desta quarentena? Comediantes”/The best of this quarantine? Comedians | 0.282 | 0.0 | 0.718 | 0.625 | Positive |
The estimation of the four values shown in the example in Table 4 Results of the LeIA tool on tweets during the first state of emergency is performed for all textual fields for each topic, and then the value present in “Compound” is used to calculate the average sentiment associated with the topic in question.
Despite the tweets considered as “Positive” in the final results column, the column corresponding to the negative value of the tweet is not 0, and the same happens with the tweets considered as “Negative”. However, the value present in the “Compound” column is representative of the sentiment of the tweet in question. In the case of the topics “Portuguese cases” and “After confinement”, whose word clouds are represented in Figure 4, the average sentiment is 0.08 (with a standard deviation of 0.37) and 0.05 (with a standard deviation of 0.35), respectively.
5 Results
Although the analysis was performed for eight periods of time, we consider relevant to carry out an analysis of the evolution of the main topics over time, in each of the sources used. This is present in Figure 5.
“Portuguese cases” and “Government measures” are the most cross-cutting topics, as they appear in 2 of the sources. On Twitter the topic “Daily life in lockdown” stands out in both lockdown periods. It is also worth mentioning that the topic “Portuguese cases” appears in all time periods under analysis on Reddit, therefore becoming a constant theme in this social media. In this topic it is observed that the two periods where the theme is more addressed (around May 2020 and January 2021), are the periods corresponding to the two states of emergency.
On Twitter, the topic “COVID-19 tests” significantly increases the number of posts around August, when the government announces investment to double testing capacity [38]. It is also noted that the topic “COVID-19 in the world”, present in Público, has much more visibility at the beginning of the pandemic.

Figure 5 Top three topic evolution on Twitter, Reddit and Público.
5.1 Period 1: Until the First Portuguese Infected
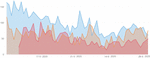
In this first period, the time frame between January 1, 2020, and February 22, 2020, was considered, despite the fact that the virus was only identified by the Chinese authorities on January 7. Although the World Health Organization (WHO) declared a state of world health emergency, only on later January did the COVID-19 issue began to be discussed much earlier in the three sources analyzed.
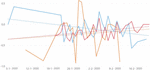
Twitter was the first source where the subject of the virus appeared. According to the data collected, on January 5, tweets on the subject were already beginning to appear. On Reddit, the first posts appeared around January 11, and on Público the first news articles appeared on January 11. A common topic across all sources is “COVID-19 in the world”, which registers a relative peak around January 31, the day the global health emergency was declared. Associated with these topics is a sentiment with a positive trend line in two of the sources – Reddit and Público – contrary to what happens on Twitter, as it can be seen in Figure 6.
There is also a negative peak on February 4, which occurs in all three sources used. On that day the first two suspected cases in Portugal [39] appeared, both Portuguese and aged between 40 and 45 years old. Given that there is a negative sentiment associated with this event, it is likely that the Portuguese felt fear or discomfort as the virus seemed to be getting closer and closer.
Another aspect that stands out is the type of topics identified in each of the three sources used. Topics on the social media Reddit are found to be more informative when compared to Twitter. This is because they gather information on topics such as: “Government measures” and “Information about the virus”, unlike Twitter, where the topics are, for example: “Futebol” and “Repatriated portuguese”. Although the topics “COVID-19 in the world” and “COVID-19 in Portugal” are transversal to Reddit and Público, the topics with more posts are more related to the information about the virus.
It is also possible to conclude that Reddit topics have on average a more negative sentiment, with the news site being the source with the least negative sentiment average. Note that, disregarding the topic “Football” – which arises because a player is named “Corona” –, the most positive topic is “Repatriated Portuguese”, on Twitter. In contrast, the topic with the most negative sentiment is “COVID-19 in Portugal”, possibly due to the fact that two suspected cases appeared in Portugal.
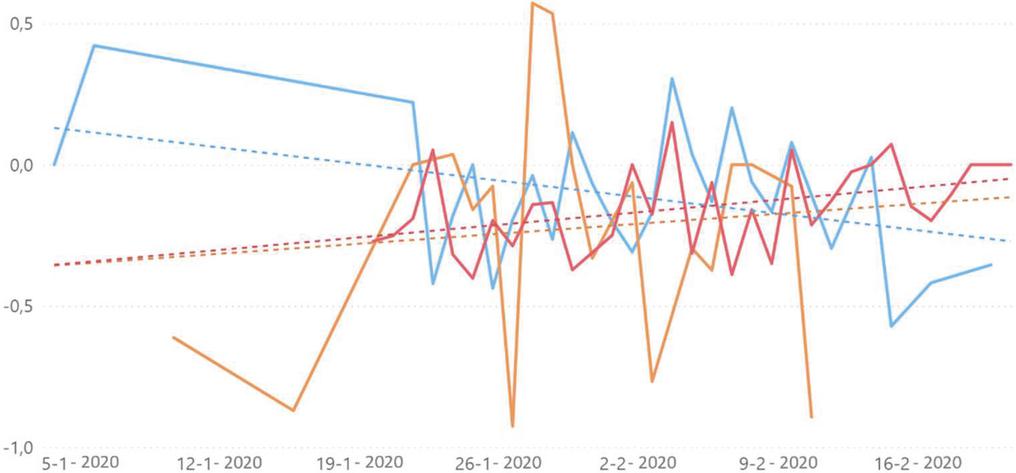
Figure 6 Sentiment trend line for the topic “COVID-19 in the world”’, on Twitter (blue), Reddit (orange) and Public (red).
5.2 Period 2: Since the First Portuguese Infected Until the First Emergency State
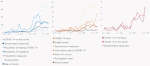
This period is delimited by the dates between the first infected Portuguese, February 22, and the beginning of the first state of emergency, March 18. It is in this period that the reality of the pandemic starts to get closer to Portugal, since it is the period after the first case of infection of a Portuguese.
Figure 7 illustrates the evolution of the number of posts associated to each topic, and for each of the three sources under analysis. From the outset it is clear that, due to the large amount of data, the topics discussed on Twitter and Reddit are grouped into more topics. In this period, topics related to the confinement issue and to the cancellation of events start to appear, and the only topic that cuts across all three sources is “Government measures”.
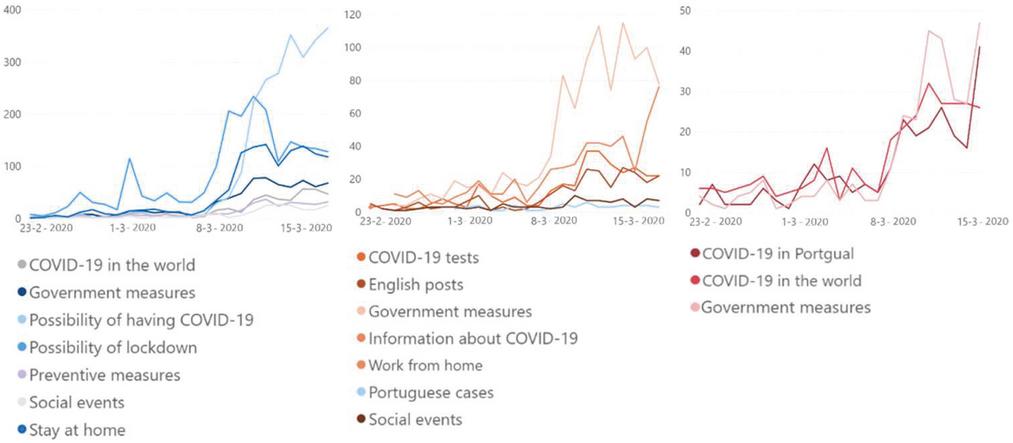
Figure 7 Evolution of the number of posts for each topic in each data source (Twitter, Reddit and Público, respectively).
In Figure 7 it is possible to see that most topics start to rise around March 8, possibly because it was on that day that countries like Italy and Spain adopted confinement measures. Later, on March 9, the Portuguese government simplifies the layoff procedures.
A relative peak can still be found around March 2, when the first infected person in Portugal appeared. However, this peak is small, once compared to the peak around March 12, possibly because the WHO had declared a world pandemic the day before.
It was also during this period that a thread related to work from home appeared for the first time, only on Reddit. Associated to this topic is a very positive sentiment trend (with a slope very close to 1), showing that the Portuguese population was probably open to this possibility. This topic reached its peak on March 14, one day after the government encouraged teleworking.
The fact that the first measures to prevent the spread of the virus have started to be taken is also reflected in the topics identified. It is the case of the cancellation of the first events, such as the environmental strike that was going to take place on March 15 (date where this topic reaches its peak, on Twitter). The topic with the highest expression in terms of the amount of associated posts is “Possibility of having COVID-19”, on Twitter. And the topic with the most negative sentiment associated is “Work from home”, on Reddit. In Figure 7 it is visible that, both on Reddit and Público, the topic that registers the most pronounced rise is related to the measures taken by the government.
5.3 Period 3: First Emergency State
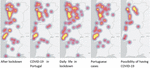
It was during this third period under analysis that the first state of emergency occurred in Portugal, and consequently the first curfew period, from March 18 to May 2. The rising number of posts related to the “COVID-19” issue at this time is clear. Among the eight time periods under analysis, this is by far the one with most data.
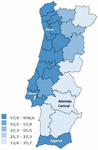
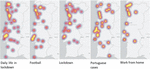
Figure 8 shows the geographical distribution of tweets published during quarantine, on each of the five most addressed topics on Twitter. It can be seen that the tweets are mostly concentrated in the big cities, Lisbon and Porto. Regarding the topic “Daily life in lockdown” – which gathers information about the activities performed at home, due to the fact that mandatory lockdown had been imposed – the geographical distribution throughout the country is more evident.
The topics with the most distributed tweets are related to lockdown. The tweets that fall under “After lockdown” talk about the future prospects and the plans that people share regarding what they intend to do when the pandemic is over. The topic “Daily life in the lockdown” reflects the daily activities performed at home, during the lockdown. Perhaps because this measure was countrywide, the tweets related to daily life in confinement and what would happen afterwards are more distributed.

Figure 8 Geographical distribution of the concentration of tweets per topic.

Figure 9 Population density (average number of individuals per square kilometre).
When comparing the maps in Figure 8 with the distribution of population density, in Figure 9, it can be seen, as expected, that there is more data in the areas where there is more population density. However, the first four topics show in Figure 8, show focuses near “Alentejo Central” area. This fact can be explained by the fact that “Alentejo Central” was one of the regions with fewer cases, since on March 25, 2021, Lisbon had 284 cases, and “Alentejo Central” only 8 [39]. In what concerns sentiment analysis, it can be seen that the average sentiment on Reddit is significantly more negative, on average, when compared to the average sentiment on Twitter. And a theme that continues to be present only on Reddit, having appeared in the second period under analysis, is “work from home”.
Once again it turns out that the topics discussed on Reddit are more informative than Twitter topics, although the most talked about topics in both social media are related to the lockdown, required at this stage of the pandemic in Portugal.
5.4 Period 4: State of Calamity
The period between May 2 and July 1 corresponds to the state of calamity, the next state after the state of emergency. So, it is at this point that the first deconfinement measures are taken. Figure 10 illustrates the evolution of the number of posts collected, related to the COVID-19 issue, in this time period, for the three sources under analysis. Once again it is clear that the Portuguese population resorts more to the social network Twitter to express their concerns, since the number of tweets collected is higher than the number of posts on Reddit.
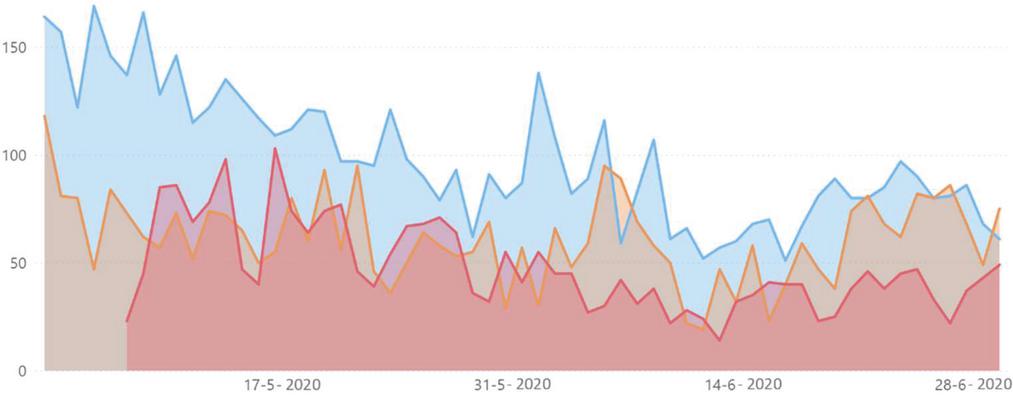
Figure 10 Evolution of the number of posts over time, on Twitter (blue), on Reddit (orange) and on Público (red).
On June 7 there is a relative spike in the number of tweets and posts on Reddit, probably because it was the day with the lowest number of deaths since March 22. The topic “Portuguese cases”, also present in the three sources, is the one with the most positive sentiment, draw attention to the number of cases was going down. The data collected from Público shows that the day with most news items is May 18, the day on which in-presence classes started for the 11th and 12th grades were resumed.
In what concerns the topic-related sentiment, at this stage, along with what has been recorded in previous periods, Reddit is the social network with the most positive average sentiment. The topic “Portuguese cases” registers an average sentiment close to 0, this is probably owing to the fact that during the confinement the regulations were followed, which caused a sharp drop in the number of recorded cases.
5.5 Period 5: State of Alert
After the contingency state followed the alert state, which began on July 1 and ended on September 14. In this state the measures applied in the state of calamity are relaxed.
In Figure 11, the topics identified in each of the sources are gathered together. In this period it is possible to identify new topics concerning the course of the pandemic in Portugal. This is the case, for instance, with the topic “Vaccine”, which appears in both Reddit and Público. The fact that this topic has come up at this time must be a consequence of the first vaccine being approved by Russia on August 11.
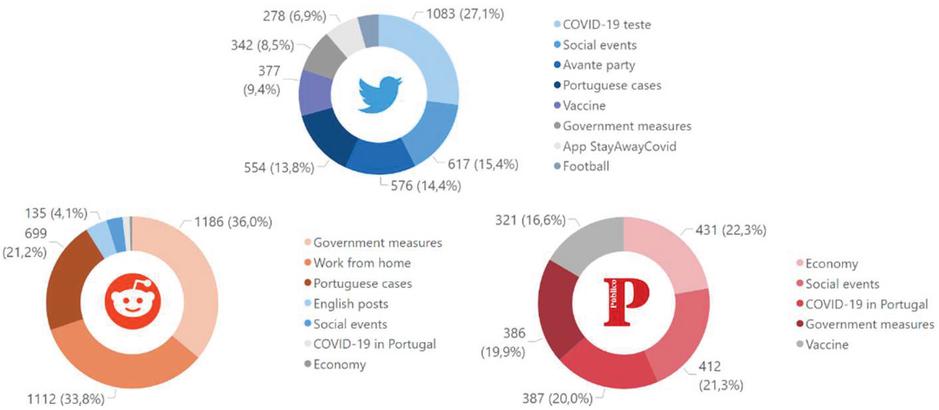
Figure 11 Topics identified in each of the three sources: Twitter, Reddit and Público, respectively.
Another topic that arises in this time period, but only on Twitter, is related with the StayAwayCovid app. This app was presented on August 5, but only on September 1 did the Twitter discussion reached its peak, probably due to the fact that it was only officially launched on that day. The topic “social events” is the most present on Twitter, representing almost 16 % of the collected tweets (it is also present on Público). It is in this period that kicks off the final phase of the champions league, on August 12 – date also related to the topic “Futebool”, on Twitter – and the “Avante festival” (annual meeting of the Portuguese Communist Party) that lasts from September 4 to September 6.
The topic related to the recorded number of cases of infection in Portugal, present in both Twitter and Reddit, is already recurrent and has been present in the periods analysed in the previous sections. However, it is in this period that the lowest average sentiment is registered in Twitter, with a positive trend. This may be related with the fact that August 3 was the first day, since the first death, without COVID-19 related fatalities in Portugal.
5.6 Period 6: Since the End of Alert State Until the Beginning of the Second State of Emergency
The period under analysis in this section corresponds to the dates between September 14 and November 8, and consequently to a state of contingency followed by a state of calamity, ending on the date on which a new state of emergency begins. In this period, the transition to states with more restrictive measures than those applied in the previous states begins, contrary to what had been happening until then.
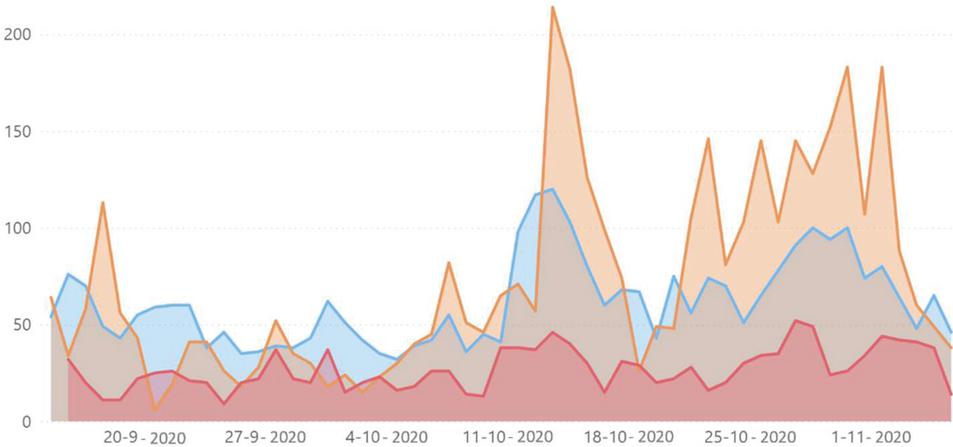
Figure 12 Number of posts in each of the three sources: Twitter (blue), Reddit (orange) and Público (red).
Figure 12 illustrates the amount of data collected over time from the three data sources. October 15 has a special impact on the number of posts collected, being the day in which the COVID-19 issue was most discussed in the sources under analysis. This was the day after the communication of the possible mandatory installation of the StayAwayCovid app. Around October 29 and 30, there is an increase in the number of posts, probably due to the fact that on the 28th of the same month it becomes compulsory to wear face masks in public spaces.
The topic with the most posts is related to the measures taken by the government and has one of the lowest average sentiment levels. Note that this topic is present in all of the three sources of information. As for the topic “Portuguese cases”, on Reddit, which has the most negative sentiment, there is a very negative sentiment trend, indicating that the sentiment towards the topic has been decreasing over the period. This may be related to the international Formula 1 event, which took place on October 25, in the Algarve, and the consequent increase in the number of cases.
5.7 Period 7: Since the State of Emergency Until the Second Lockdown
This period gathers the dates between November 8, when a new state of emergency begins, and the first day of the second lockdown. Along with what happened in the previous period, Portugal proceeds from a state of disaster to a state of emergency, a state that implies a more restricted set of measures (when compared with the measures applied in the state of disaster).
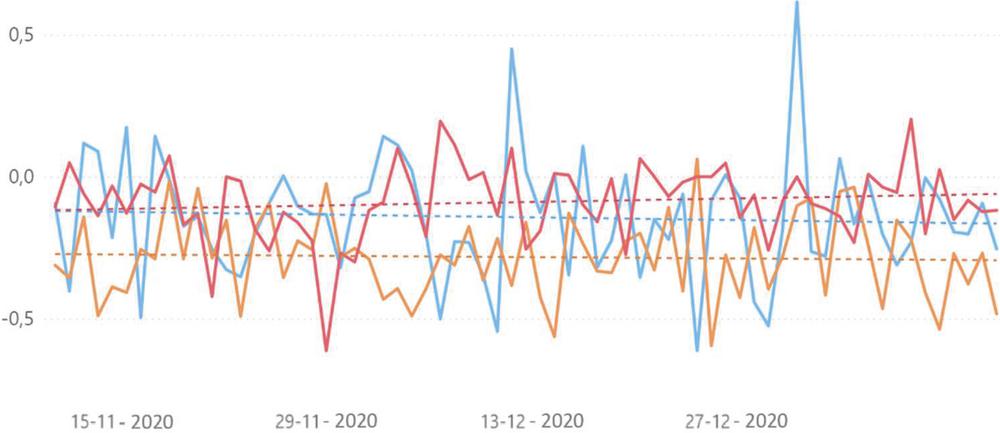
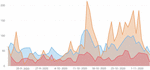
Figure 13 Sentiment evolution for the topic “Vaccine” in each of the tree sources: Twitter (blue), Reddit (orange) and Público (red).
Figure 13 shows the evolution of sentiment for the topic “Vaccine”, present in all sources. This topic reveals special importance at this stage – although it had already appeared in previous periods – given that on December 20 the first person in the world was vaccinated and on December 27 the first vaccine was administered in Portugal.
Although the sentiment trend is mostly below 0 over time, it is visible that it has a positive trend in Público. However, on Reddit and Twitter, the sentiment associated with this topic was decreasing, on average. The topic “Vaccine” stands out on Público for being the topic with most news articles linked to it and for being the second most negative topic in this information source (despite having a positive trend, as mentioned). It is also worth mentioning that on Reddit the most dominant topic continues to be related to working from home, however it presents a higher average sentiment score, when compared with the sentiment score registered in the previous time period.
5.8 Period 8: Second Lockdown
The last period under analysis deals with information between January 16 and March 16, the start and end dates, respectively, of the second compulsory confinement. In this period that Portugal reaches the highest number of infected people, and is even considered the country with the most cases per million inhabitants in Europe [40].
Similarly to what happened in the first cofinement, one of the topics that shows a greater geographical distribution throughout the country is “Portuguese cases”, as can be seen in Figure 14. However, the topic about working from home was more talked about in the big cities, such as Porto and Lisbon, probably due to the fact that it is in these places that the big companies are located.

Figure 14 Geographical distribution of the concentration of tweets per topic.
When it comes to the football topic, there is a very sharp peak on February 7, the day when a match between two major Portuguese clubs took place. The topic that registers the most negative average value with regard to the associated sentiment was “Government measures”. This topic reaches one of its relative peaks on February 27, probably due to the fact that one day later the state of emergency is renewed. These data may reflect a dissatisfaction of the Portuguese population regarding the prolongation of the confinement.
Also, on February 19 and 21 there are relative peaks in all the data sources used. On these days there were several government communications in order to update the new measures in force, such as the suspension of school activities. In Público, the topic with the most positive sentiment score average is related to the Portuguese vaccination plan. Probably because there were several news reports informing that Portugal was complying with the vaccination plan established at the end of 2020.
6 Evaluation
After the data was processed, it was organized in a dashboard in order to obtain a better visualization. The dashboards have five pages. The first one shows the evolution of the new cases of infected subjects with COVID-19 in Portugal, in parallel with the eight periods under analysis. The second presents the analysis by period, and by selecting one of the eight time periods it is possible to observe the topics, sentiments, and respective temporal evolution. Finally, the last three pages present a deeper insight for each of the three sources used: Twitter, Reddit and Público.
It was considered relevant that the organization in question was the medical community since it is is often consulted by decision-makers. The evaluations were performed by three experts: a researcher and specialist in communication and public health (Eval #1), a resident public health doctor and consultant in health communication and data visualization (Eval #2), and finally the vice president of the National Association of Public Health and coordinator of the combat against COVID-19 in the Azores (Eval #3). The results of the evaluation are presented in Table 1.
Table 5 Results of the evaluation (Not Achieved – NA, Partially Achieved – PA, Largely Achieved – LA and Totally Achieved – TA)
| Criteria | Objective | Eval #1 | Eval #2 | Eval #3 |
| Efficacy | Effectively inform about the topics and respective sentiments discussed on social media over time, regarding the pandemic situation in Portugal | LA | FA | TA |
| Consistency with organization/ Utility | Obtain insights about a precision of the reality that the Portuguese share in the social media, which may contribute to help decision making of the medical community in Portugal | PA | LA | TA |
| Clarity | Providing clear and easily understandable information from the dashboards created | TA | LA | LA |
| Style | Providing appealing dashboards, as the formatting of the visualisations makes them easier to interpret | LA | TA | TA |
| Learning capability | Automatically learning about COVID-19 Portuguese insights regarding the discussion of topics and their associated sentiments on social media, during the first year of pandemic | PA | TA | LA |
All experts were asked to evaluate each of the five objectives defined. The dashboards were very well received by the three experts, which also emphasized the possible impact and usefulness that the dashboards can provide to the medical community for decision support purposes. All experts considered the objectives achieved, although at different levels, probably due to the divergent backgrounds. For future work it was recommended to introduce a front page with instructions for use and with a brief introduction to the dashboards in order to make it easier to consult them.
Also it was advised that, for the next iteration, the sentiments associated with “fear” should be set apart. This is because the pandemic may generate some instability, causing the sentiment “fear” (which is negative) to negatively influence the average of the sentiments obtained. Furthermore, it was mentioned that it would be an added value if it were easier to perceive whether the sentiment is positive or negative, using a colour gradation, for example. Another feedback obtained, is related to the language that the dashboard is in. Once they are written in English, it was mentioned that it would be more useful if the dashboard was made in Portuguese, given the pandemic context in Portugal. Finally, it was also advised that, the evolution of the new cases could be presented, in all the pages, so that this information can be compared with the topics and sentiments obtained, and thus establish a possible correlation. It is intended that, for a second iteration of the methodology used, all these recommendations will be incorporated to improve the results obtained.
6.1 Discussion
Similarly to our work, [20] also focus on understanding the public opinion, by identifying emotions and its polarity, regarding COVID-19 using Twitter data. However, this work only deals only with tweets in English, not being limited to any specific country. A total of 574,903 tweets were collected, and from these, as in our work, an analysis was performed using natural language processes to identify topics and their respective sentiments. For data collection only two search words were used: “#socialdistancing” and “#stayathome”. And contrary to the Portuguese case, the sentiment polarity was mostly positive (associated with joy), although the second and third most present emotions were fear and surprise, respectively. Since the data collected in this study is between March 27 and April 10, only 10 topics have been identified, including some that were also identified in our study, such as: government measures, daily life in quarantine and economy. The authors suggest that the fact that the achieved sentiment scores obtained were mostly positive or neutral may be related to the fact that the analysis was conducted in the initial pandemic phase. Our work supports this same hypothesis, since the sentiment polarity obtained in the third period (during the first confinement) reveals a more positive average score than the one associated with the eighth period under analysis (during the second confinement period). This negative evolution of sentiment is present in the topics “Daily life in lockdown” and “Lockdown”.
As in our work, another study [21] another study uses social media to get insights from public opinion. Using the Chinese microblogging platform, Sina Weibo, data were collected between December 27, 2019 and May 31, 2020. In this time frame, 41 topics were identified, including: “Epidemic situation in Wuhan”, “Epidemic situation in Brazil” and “Viral vaccine”, also identified in this work.
In the same study it was also concluded that there was a positive correlation between the increasing number of registered COVID-19 cases and public attention. Similar to the work we developed, a sentiment analysis was performed, where a scale of 0 to 1 was applied, with 0 being the most negative value. It can be seen that, at the beginning of the analysis, the sentiment is very negative, but it gradually grows into and stabilizes as a positive sentiment.
[22] also focus on the analysis of topics and corresponding sentiment regarding the pandemic context, in their case in Poland. They conclude that the vast majority of the identified 11 topics have a negative sentiment associated with them, with the exception of topics related to the use of masks and vaccination. Unlike the work we have done, in this study the sentiment is only classified as negative, neutral or positive. The vast majority of the topics were associated with negative sentiment.
In this way, we conclude that by using social media, such as Twitter and Reddit, we can reflect a sense of reality with regard to the pandemic situation in Portugal. In this sense, this work differentiates itself by having a long period of analysis (over a year) that is divided and analyzed according to the main events related to a specific country, Portugal, through the COVID-19 pandemic. In addition, the dashboards were evaluated by members of the medical community who work on a daily basis with COVID-19 issues, and they all valued the work done here.
Having performed an analysis that covers more than one year of data, it is possible to conclude that the period where the average sentiment score (from all the information sources under analysis) was registered as more negative corresponds to the first alert state implemented in Portugal, since July 1 until September 14. Although this period was the first day without fatalities in Portugal since the pandemic outbreak, it was also during this time that the president of Brazil was infected and that the app StayAwayCovid was launched, which generated some controversy due to the possible mandatory installation. In parallel with these events, the Avante festival took place, one of the first political events open to the public during the pandemic.
As for the number of data collected in each of the eight periods, it is possible to conclude that it is influenced by the pandemic events in Portugal. In this sense, and as expected, the period where the amount of data analysis is higher corresponds to the period of the first compulsory confinement. Besides being an unprecedented situation in Portugal, at least in the recent past, the fact that it was mandatory to be at home may have influenced the sharing through social media.
7 Conclusion
This paper demonstrates some of the analyses that are achievable using the developed platform, CovidSocialSensing. Based on the findings, it is possible to identify trends and draw insights concerning public perception with respect to the pandemic caused by COVID-19, in the context of a specific country, in this case Portugal. For this reason, it is possible to consider that the proposed contribution has been achieved.
It should also be noted that the analysis performed here covers data from the first day of 2020, until the end of the second compulsory containment, March 16, 2021. In this sense, more than a year of data after the start of the pandemic were considered, both worldwide and in Portugal. Therefore, it is an added value to make the insights gained here available to the medical community, in the sense that the dashboards can contribute to support decision making.
Since during this year there were several events related to the pandemic context in Portugal, it was considered that for a better analysis, it would be advantageous to divide the data in terms of time. This division was only influenced by the various periods of the pandemic in Portugal, thus enabling a more detailed analysis of this perception of reality obtained from the topics and respective sentiments. This time division can easily be adapted to the pandemic context of other countries.
The work done here reflects a perception of the pandemic reality experienced in a specific country, nevertheless, it can be replicated to gain insights concerning other countries. To do so, the data collected on Reddit should be included in the country’s subreddit, and the data extracted from Twitter should be restricted to the country and language in question. Text mining tools must be adapted to the language in question.
Future work should include the exploration of new methods of topic modeling and sentiment identification that may reveal better results for small text. Furthermore, the fact that the pandemic situation has not yet been completely overcome in Portugal, allows for analyses similar to the ones demonstrated here, but in subsequent periods.
Acknowledgements
This work was supported by EEA Grants Blue Growth Programme (Call #5), Project PT-INNOVATION-0069 and Portuguese national funds through FCT, with reference UIDB/50021/2020 – Fish2Fork, INOV, ISTAR and INESC-ID.
References
[1] D. Taylor, The Coronavirus Pandemic: A Timeline – The New York Times, 2020.
[2] I. Kislaya, P. Gonçalves, M. Barreto, R. Sousa, A. Garcia, R. Matosa, R. Guiomar and A. Rodrigues, “Seroprevalence of SARS-CoV-2 Infection in Portugal in May-July 2020: Results of the First National Serological Survey (ISNCOVID-19),” Acta Médica Portuguesa, vol. 34, p. 87–94, 2 2021.
[3] WHO report, Coronavirus Disease (COVID-19) Situation Reports, 2021.
[4] Jornal de Notícias, Cronologia dos principais acontecimentos de um ano de covid em Portugal, 2021.
[5] R. Chandrasekaran, V. Mehta, T. Valkunde and E. Moustakas, “Topics, Trends, and Sentiments of Tweets About the COVID-19 Pandemic: Temporal Infoveillance Study,” Journal of Medical Internet Research, vol. 22, p. e22624, 2020.
[6] Y. Marzouki, F. S. Aldossari and G. A. Veltri, “Understanding the buffering effect of social media use on anxiety during the COVID-19 pandemic lockdown,” Humanities and Social Sciences Communications, vol. 8, 2021.
[7] S. Kemp, Digital in Portugal, 2021.
[8] H. Liang, I. C.-H. Fung, Z. T. H. Tse, J. Yin, C.-H. Chan, L. E. Pechta, B. J. Smith, R. D. Marquez-Lameda, M. I. Meltzer, K. M. Lubell and K.-W. Fu, “How did Ebola information spread on twitter: broadcasting or viral spreading?,” BMC Public Health, vol. 19, p. 438, 4 2019.
[9] M. Barthel, How the 2016 presidential campaign is being discussed on Reddit, 2017.
[10] T. Surya Gunawan, N. Aleah Jehan Abdullah, M. Kartiwi and E. Ihsanto, “Social Network Analysis using Python Data Mining,” in 2020 8th International Conference on Cyber and IT Service Management (CITSM), 2020.
[11] A. Whiting and D. Williams, ResearchGate, 2013.
[12] A. M. Kaplan and M. Haenlein, “Users of the world, unite! The challenges and opportunities of Social Media,” Business Horizons, vol. 53, p. 59–68, 1 2010.
[13] A. Agarwal, B. Xie, I. Vovsha, O. Rambow and R. Passonneau, “Sentiment analysis of Twitter data,” in Proceedings of the Workshop on Languages in Social Media, USA, 2011.
[14] J. Lee, A. Jatowt and K.-S. Kim, “Discovering underlying sensations of human emotions based on social media,” Journal of the Association for Information Science and Technology, vol. 72, p. 417–432, 2021.
[15] E. Chen, K. Lerman and E. Ferrara, “Tracking Social Media Discourse About the COVID-19 Pandemic: Development of a Public Coronavirus Twitter Data Set,” JMIR Public Health and Surveillance, vol. 6, 5 2020.
[16] C. Tan and L. Lee, “All Who Wander: On the Prevalence and Characteristics of Multi-community Engagement,” in Proceedings of the 24th International Conference on World Wide Web, Republic and Canton of Geneva, CHE, 2015.
[17] M. Paulino, R. Dumas-Diniz, S. Brissos, R. Brites, L. Alho, M. R. Simões and C. F. Silva, “COVID-19 in Portugal: exploring the immediate psychological impact on the general population,” Psychology, Health & Medicine, vol. 26, p. 44–55, 1 2021.
[18] R. Molla, How coronavirus took over social media, 2020.
[19] J. Samuel, G. G. M. N. Ali, M. M. Rahman, E. Esawi and Y. Samuel, “COVID-19 Public Sentiment Insights and Machine Learning for Tweets Classification,” Information, vol. 11, p. 314, 6 2020.
[20] S. N. Saleh, C. U. Lehmann, S. A. McDonald, M. A. Basit and R. J. Medford, “Understanding public perception of coronavirus disease 2019 (COVID-19) social distancing on Twitter,” Infection Control & Hospital Epidemiology, vol. 42, p. 131–138, 2 2021.
[21] C. Machado, Public attention about COVID-19 on social media: An investigation based on data mining and text analysis |Elsevier Enhanced Reader, 2021.
[22] E. Probierz, A. Galuszka and T. Dzida, “Twitter Text Data from #Covid-19: Analysis of Changes in Time Using Exploratory Sentiment Analysis,” Journal of Physics: Conference Series, vol. 1828, p. 012138, 2 2021.
[23] L. Singh, S. Bansal, L. Bode, C. Budak, G. Chi, K. Kawintiranon, C. Padden, R. Vanarsdall, E. Vraga and Y. Wang, “A first look at COVID-19 information and misinformation sharing on Twitter,” ArXiv, 3 2020.
[24] K. Sharma, S. Seo, C. Meng, S. Rambhatla and Y. Liu, “COVID-19 on Social Media: Analyzing Misinformation in Twitter Conversations,” arXiv:2003.12309 [cs], 10 2020.
[25] G. Samuel, S. L. Roberts, A. Fiske, F. Lucivero, S. McLennan, A. Phillips, S. Hayes and S. B. Johnson, “COVID-19 contact tracing apps: UK public perceptions,” Critical Public Health, vol. 0, p. 1–13, 4 2021.
[26] M. Hashemi and M. Hall, “Multi-label classification and knowledge extraction from oncology-related content on online social networks,” Artificial Intelligence Review, vol. 53, p. 5957–5994, 12 2020.
[27] J. C. Lyu and G. K. Luli, “Understanding the Public Discussion About the Centers for Disease Control and Prevention During the COVID-19 Pandemic Using Twitter Data: Text Mining Analysis Study,” Journal of Medical Internet Research, vol. 23, p. e25108, 2 2021.
[28] S. Zhang, W. Pian, F. Ma, Z. Ni and Y. Liu, “Characterizing the COVID-19 Infodemic on Chinese Social Media: Exploratory Study,” JMIR Public Health and Surveillance, vol. 7, p. e26090, 2 2021.
[29] R. Wirth and J. Hipp, “CRISP-DM: Towards a Standard Process Model for Data Mining,” ICECT 2011 – 2011 3rd International Conference on Electronics Computer Technology, p. 11, 2000.
[30] N. Prat, I. Comyn-Wattiau and J. Akoka, “Artifact Evaluation in Information Systems Design-Science Research – a Holistic View,” in PACIS, 2014.
[31] R. Al-Qutaish and K. Al-Sarayreh, “Software Process and Product ISO Standards: A Comprehensive Survey,” European Journal of Scientific Research, vol. 19, p. 289–303, 2 2008.
[32] A. Barata, Primeiro português infetado com covid-19 ficou sem sequelas, 2021.
[33] S. Bird, E. Loper and E. Klein, Natural Language Processing with Python, O’Reilly Media Inc, 2009.
[34] J. Qiang, Y. Li, Y. Yuan, W. Liu and X. Wu, “STTM: A Tool for Short Text Topic Modeling,” arXiv:1808.02215 [cs], 8 2018.
[35] D. M. Blei, “Latent Dirichlet Allocation,” Journal of Machine Learning Research 3, p. 30, 2003.
[36] R. J. d. A. Almeida, rafjaa/LeIA, 2021.
[37] C. J. Hutto and E. Gilbert, “VADER: A Parsimonious Rule-based Model for Sentiment Analysis of Social Media Text,” Proceedings of the 8th International Conference on Weblogs and Social Media, ICWSM 2014, p. 10, 2014.
[38] R. R. Nunes, Covid-19. Governo anuncia 8,4 milhões para duplicar capacidade de testagem do país, 2020.
[39] Diário de Notícias, Quantos casos de Covid-19 há em cada concelho de Portugal, 2020.
[40] A. Guimarães, Covid-19: Portugal é o país com mais casos por milhão de habitantes? Este é o outro lado da história |TVI24, 2021.
[41] D. Lai, D. Wang, J. Calvano, A. S. Raja and S. He, “Addressing immediate public coronavirus (COVID-19) concerns through social media: Utilizing Reddit’s AMA as a framework for Public Engagement with Science,” PLoS ONE, vol. 15, 2020.
Biographies

Carolina Ferraz Marreiros received her master’s degree from the Integrated Decision Support Systems Department, University Institute of Lisbon (ISCTE), Lisbon, Portugal. She is currently working in the area of data analytics and artificial intelligence. Her areas of interest include artificial intelligence, Neuro-Linguistic Programming and business intelligence.

João Boné is an NLP developer and researcher working for Select Data, a prominent company in the American Healthcare Industry. He received his master’s degree in Integrated Business Intelligence Systems from ISCTE-Instituto Universitário de Lisboa, and his interests include problem-driven solutions related to data analysis and machine learning applications, mostly connected to NLP. He is often drawn by industry and society-related challenges.

João C. Ferreira (PhD) is Assistant Professor with habilitation at ISCTE-IUL. His research interests are in: data science, Text Mining, IoT, AI, and AI application health, energy, transportation, Electric Vehicle, Intelligent Transportation Systems (ITS). He has authored more than 250 papers in computer science. He has executed more than 30 projects (6 as PI), more than 180 scientific paper reviews and more than 25 scientific project evaluation. IEEE CIS Chair 2016-2018 and current vice chair of IEEE Blockchain PT, CIS PT chapter and Bruxels AI and robotics. Main organizer of international conferences such as: OAIR 2013, INTSYS from 2018 to 2022. IEEE senior member since 2015. Guest Editor and topic editor of MDPI in the topics of energies, electronics and Sensors. President of the IEEE CIS in PT (2017–2018). Author of a patent in Edge Computer in a monitoring system for fishing vessels.

Ricardo Ribeiro (PhD) is an Associate Professor at Iscte – Instituto Universitário de Lisboa, where he is the coordinator of the Artificial Intelligence scientific area, and an integrated researcher at INESC-ID Lisboa, working on Human Language Technologies. His current research interests focus on high-level information extraction from unrestricted text, speech or music, and improving machine-learning techniques using domain-related information. He has participated in several European and Nationally-funded projects and was the Human Language Technologies INESC-ID team coordinator in RAGE (2015–2019) European-funded project and the principal investigator of a Ministry of National Defence funded project on information extraction from text. He has participated in several scientific events, either as organiser or as member of the program committee (IJCAI, ICASSP, LREC, Interspeech) and was the editor of a book on the computational processing of Portuguese.
Journal of Mobile Multimedia, Vol. 19_1, 325–362.
doi: 10.13052/jmm1550-4646.19117
© 2022 River Publishers