Real Time Asthma Disease Detection and Identification Technique from Speech Signals Using Hybrid Dense Convolutional Neural Network
Md. Asim Iqbal1,*, K. Devarajan1 and Syed Musthak Ahmed2
1Dept. of E.C.E, Annamalai University, Tamil Nadu, India
2Dept. of E.C.E, SR University, Warangal, Telangana, India
E-mail: mdasimiqbal605@gmail.com; asim_iqbal67@outlook.com
*Corresponding Author
Received 25 November 2022; Accepted 20 January 2023; Publication 13 October 2023
Abstract
Recently, asthma patients are severely suffering COVID-19 disease, thus the asthma has become one of the dangerous diseases in the world. Further, asthma is occurring in all age groups, which causing huge loss to patient’s health. The primary way to detect the asthma in humans is done by their speech signals, as the asthma severity is increases, which manipulates the properties of speech signal. The conventional methods are failed to extract the maximum features from the speech signals, which resulted in low classification performance. Thus, this article is focused on implementation of real time asthma disease detection and identification technique from speech signals using Multi-Feature Extraction, Selection with Hybrid Classifiers (MFESHC). Initially, speech signals are preprocessed by using Maximum likelihood estimation based spread spectrum analysis (MLE-SSA) method. Then, Improved prefix Beam Search (IPBS) based natural language processing (NLP) method is used to extract and select the best features from the preprocessed speech signals. Then, hybrid dense convolutional neural networks (HDCNN) are used to classify the type of asthma such as normal, stridor, wheezes and rattle classes. Further, Modified Crow Search (MCS) is used to optimize the losses generated in the HDCNN model. The simulation results shows that the proposed MFESHC method resulted in superior performance as compared to state of art approaches because the MCS effectively reduced the losses in the model.
Keywords: Asthma detection, improved beam search, MFESHC, modified crow search, deep neural network.
1 Introduction
The stethoscope has been considered as a significant symptomatic instrument since the time it was imagined in the mid-1800s. Auscultation is painless, ongoing, cheap, and exceptionally useful. Ongoing electronic stethoscopes have delivered lung sounds recordable, and it worked with the investigations of naturally breaking down lung sounds [1–3]. Strange lung sounds incorporate pops, wheezes, rhonchi, stridor, and pleural contact rubs. Pops, wheezes and rhonchi are the most generally found among them, and recognizing those sounds enormously helps the determination of pneumonic infections [4–6]. Pops, which are short, touchy, and non-melodic, are delivered by patients with parenchymal lung illnesses like pneumonia, interstitial aspiratory fibrosis, and aspiratory edema. Wheezes are melodic sharp sounds related with aviation route illnesses like asthma and constant obstructive pneumonic sickness [7–10]. Rhonchi are melodic low-pitched sounds like wheezes, typically demonstrating emissions in the aviation route, and are regularly cleared by rattleing. Helpless asthma control is the main source of things to come hazard of asthma intensifications in patients [11–13]. As indicated by the Centers for Disease Control and Prevention, 1 out of 13 individuals has asthma on the planet that has experienced at least one asthma episodes of helpless asthma control or asthma assaults in 2021. Helpless asthma control, over the long haul, is corresponded with asthma intensifications and diminished personal satisfaction [14–16]. Accordingly, introducing compelling intercessions is expected to keep up with ideal asthma control level in patients.
During breathing, acoustic signs are created in the lungs because of motions in the tempestuous stream at the bronchial dividers, and respiratory acoustic signs give significant data with respect to the state of the lungs [17, 18]. In particular, ordinary lungs create typical breath sounds, and obsessive issues or aviation route checks produce strange sounds. Asthmatic patients present a few aviation routes blocks that outcome in the creation of wheeze sounds. The current act of doctors includes utilizing a stethoscope to auscultate wheeze sounds, and this emotional cycle relies upon the experience and hearing ability of the doctor. To conquer these issues, specialists have begun to seriously investigate PC based strategies [19]. One of the constant sicknesses in our reality is Asthmatic disease. In 2016, 339 million patients of this constant illness have been recorded all around the world, the greater part of which are kids. World Health Organization (WHO) expresses that around 417,918 asthma patients have kicked the bucket universally per annum and 24.8 million inabilities are discernible to asthma in 2016. Breathed in substances and particles making sensitivity and disturbances the air section are the most crucial danger specialists. As indicated by WHO, passings brought about by asthma have arrived at the measurements of 1.07% of complete passings in India [20]. In 2018 India positioned 47 among the nations where asthma was the main source of mortality. Assuming tended to and informed ahead of time, these fatalities might be abbreviated to a negligible sum. The test emerges when there is a deficiency or nonavailability of improved and valid gear in emergency clinics and clinical organizations. The symptomatic technique is a blend of fluoroscopy imaging and lab analyze which isn’t accessible to many. Auscultation is presently the world-well known least expensive technique with upgraded and exact analysis’ capacity for lung infections [21].
Wise frameworks change the world, just as our medical services framework. We propose a profound learning-based rattle sound grouping model that can recognize youngsters with solid versus obsessive rattles like asthma, upper respiratory parcel disease, and lower respiratory lot contamination. To prepare a profound neural organization model, we gathered a new dataset of rattle sounds, named with clinician’s determination. The major contributions of this work are as follows.
• Initially, MLE-SSA preprocessing method was introduced to reduce the noises presented in the speech signals, which also eliminates phase mismatches, phase changes and improves the speech quality.
• Then, IPBS is a bio-optimization based NLP approach, which is used to convert the speech signals into textual format. Then, best features are extracted and selected from the textual data, which also identifies the relationship between various features.
• In addition, HDCNN model is used to train and test the network by using these optimal features. Usually, the deep learning models are suffering with the training and testing loss. So, MCS based bio-optimization approach is used to reduce these loss values and resulted in superior performance as compared to the state of art approaches.
The organization of this paper as follow: Section 2 elaborates the previous algorithm used on the asthma disease detection with their drawbacks. Section 3 analysis the proposed system with their implementation. Section 4 contains the result and discussion and Section 5 examines the conclusion with possible future enhancements.
2 Literature Survey
In [22] authors have proposed a precipitation sensor that responds to the output of the breath. To form the zinc in the gas sensor, the ratio of the zinc oxide and stannic oxide nano powder are used. The reaction of the atmospheric sensor to respiratory asthma is different from that of the normal respiratory reaction. The electrical conductivity, sensitivity, response time, and humidity sensor recovery time under the influence of uncomfortable breathing are calculated and compare with the normal response. As part of routine data collection, a spirometer is used to distinguish between a normal person and an asthma patient. The response of the rainfall sensor to normal and asthma subjects varies from regular to persistent. The nature of the precipitation sensor is designed for normal, infectious cases. Comparison of normal and asthma pellet sensor response to use as an adjunct to asthma diagnosis.
In [23] authors have proposed the evaluated the phenomenon of VDT transcription scales in humans, using the newly developed miscommunication system to identify common pattern or mechanism of various pathologies, whether fundamental or transient causal between specific human diseases. A proven method with osteoporosis showing one or two severe strokes, especially Chronic Obstructive Pulmonary Disease (COPD) asthma. The latter showed no effect of VTD on known molecular pathways. Based on conclusion, an assessment and meta-analysis of available data based on objective activity (compulsory expiration rate per second, FEV1%) did not reveal VDT’s important impact on the objective development of any subsequent situation.
In [24] authors recommended a planned cross-examination of 44 children aged 6–12 years; Asthma is diagnosed according to the Global Asthma Initiative (GINA) criteria. The children’s saliva immunoassay was performed at 37 cytokines and 785 nm by SERS (Surface Enhanced Raman Spectroscopy) analysis. We also found a large structure for bronchial cases between IL-8 (p 0.004), IL-10 (p 0.008) and sCD163 (p 0.003). The Raman range increases significantly in this region from 760 to 1750 cm. The Principal Component Analysis and Linear Discriminant Analysis (PCA-LDA) method was 85% sensitivity, 82% specificity, and 84% accuracy for asthma analysis. These results indicate the presence of a subclinical inflammatory condition, which may indicate lung regeneration in the population. To identify the bronchitis the SERS method is used and the endotype allowing for a more sensitive and accurate diagnosis.
In [25] authors have proposed a model of LPS air respiration has developed a model of metabolic changes similar to those of horses in a natural way. To determine the more pronounced metabolism of air respiration in horses affected by asthma and LPS compared to healthy horses, the metabolic pathway was analyzed by appropriate Fisher testing. The most well-known modes of metabolism are fatty acid biology, gelatos metabolism, and the citrate cycle. A bronchoscopy occasionally includes a technique called bronchoalveolar lavage (BAL). It is also known as cleaning the bronchoalveoli. BAL is performed to obtain a pulmonary specimen for analysis. These results propose that the airway induction pattern with LPS is a good case study model for cattle with asthma due to the similarity in profile of lung cells (especially neutrophils) and similar metabolites found in bronchoalveolar lavage fluid (BALF) during airway. Further studies will shed light on metabolic disorders and their importance in the pathogenesis of equine asthma.
In [26] authors have proposed the occurrence of asthma and allergic diseases revealed an escalating tendency over the space between the two studies, which was important for dry cough and pollen allergy. The number of indoor air pollution is extensively reduced. However, we found an association between PM2.5 level and asthma prevalence and a dose-effective relationship. The history of asthma and allergies, poor nutrition and non-Mediterranean diet are associated with an increased risk of these diseases.
In [27] authors have proposed the SPLA2-X is found in human asthma and human virus samples, which play an important role in regulating this type 2 inflammation, AHR, and eco sanide production. We discuss the regulation of eosinophils in leukocytes, the mechanism of action of SPLA2-X, the production of glycerophospholipids, and the mediation of receptors. This article or section needs sources or references that appear in credible, third-party publications.
In [28] authors have proposed the biggest improvement in asthma genetics over the past 13 years is the combination of asthma genetic variations with drug targets. Further research is needed to determine the functional significance of genetic variants associated with asthma in subgroups of patients and to describe the biological networks in which they operate. Finding genetically controlled asthma drug targets will lead to the reuse of existing asthma medications and the development of new therapies.
In [29] authors have proposed Metal Nodes with Zn (II) Ions Zn3 (OH) Secondary Structural Units (SSU) is a metal of biodegradable structure with a strong hexa carboxylic acid binder of 5,5,5,1 dm. A N, N-dimethylacetamide). Then, High sensitivity of Complex 1 is used as a fluorescent sensor, due to significant resistance to water and its ability to detect Fe3 ions in aqueous solution have been studied. In addition, the complex treatment of pediatric asthma was evaluated and its associated mechanism was investigated. First, it detects reverse transcription polymerase chain reaction by comparative performance of the BLC-2 gene and determines the apoptotic status of cells that detect cell apoptosis.
In [30] authors have proposed Analysis of spatial-temporal clusters of asthma and sociological factors related to asthma hospitalization rates, Asant, China, and Guangxi. Methods: Asthma Hospital and Socio-Environmental Data Collected In 2015, a space-time scan was used for 88 counties/municipalities in Guangxi, China to identify high-risk periods and asthma hospital locations. We used the geodector and the Sphereman correlation coefficient to study the socio-environmental factors associated with asthma hospital admission rates.
In [31] authors contain an existing original technique for ID of wheeze, pop, and standard sound using the genuine Optimized S-Transform (OST) and tremendous extra affiliations (ResNets). However, the noise of uncomfortable breathing determines the specific OST. The respiratory sound classes are seen, after the learning and the representation are satisfied by the ResNet. The projected OST have the features of wheeze, snap, respiratory sounds, and excessive control of research creates cautious properties for the best guarantee, and this particular strategy provides a reliable recognition of telemedicine and E-wellness analysis associated with respiratory infections. The classification is executed via preparing and analysis by the techniques for ANN, GMM, CNN, ensemble CNN and CNN.
In [32] authors have discussed that, nowadays, the Internet of Things (IoT) as well as portable medical services (m-healthcare) programs have been able to offer online services in many different dimensions. To track and diagnose critical disorders, we suggest a brand-new mobile health care term adaptive on the network as well as the internet of things.
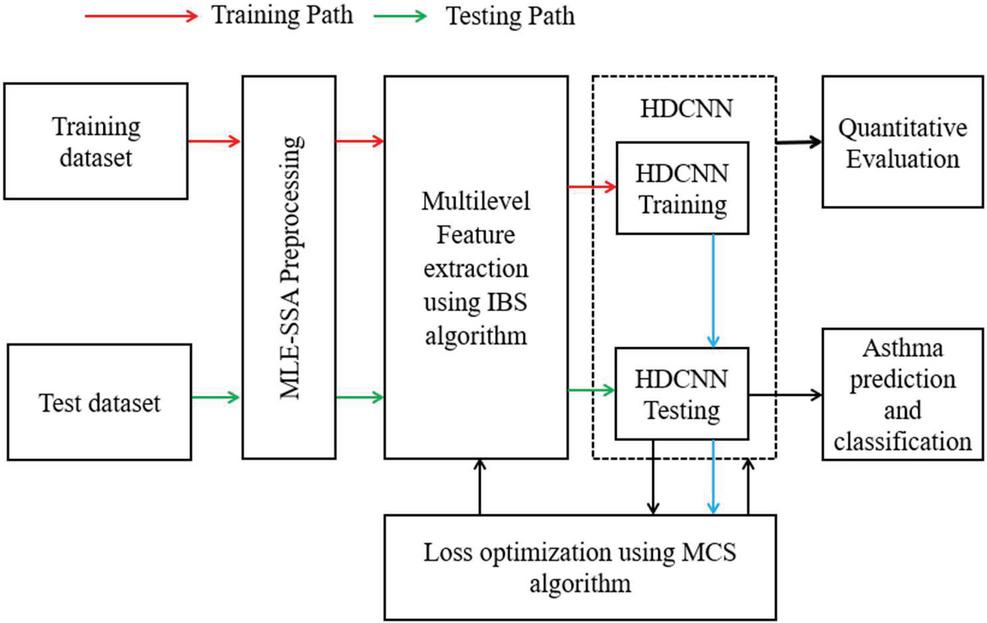
Figure 1 Proposed MFESHC technique for asthma classification.
3 Proposed System Model
This section gives the detailed analysis about the proposed methodology by using the various operational blocks. Figure 1 presents the block diagram of proposed approach with training and testing stages. Table 1 presents the proposed algorithm for detecting the asthma from speech-based sound signals. Sound signals, often known as acoustic features, are fluctuations in air density. These temperature changes can be thought of as waveforms, which is why they are frequently referred to as acoustic energy. Usually, the speech signals of different age groups contain with inter dependent features. But the speech signals are suffering with the high additive noises, random noises and jitter noises. A fundamental noise concept called additive white Gaussian noise (AWGN) is employed in cognitive science to simulate the effects of several stochastic events that happen in the natural world. High frequencies from every region of the frequency range make up random noises. Since random noise includes every spectral component in approximately equivalent amounts, similar to the colour white, it is repeatedly alluded to as white noise. Further, cough of the patient also creates the destructive noise, which corrupts the features of the speech signal. Retaining the underlying transmitter structure and properties, and removing signal noise in order to increase SNR. This study discusses a method for making communication front-ends resistant to noise signal by removing the interference from distorted speech signals. So, noise removal from speech signals is essential and MLE-SSA preprocessing method is introduced to achieve these noise removal properties. Additionally, MLE-SSA also enhances the speech properties based on echo levels, pitch intensities, frequencies and phase angles.
| Input: Training dataset and Test data | |
| Output: Asthma detection, Quantitative evaluation | |
| Start the training procedure | |
| Step 1: | Perform the speech preprocessing using MLE-SSA method to remove the different types of noises and enhances the speech signal. |
| Step 2: | Apply the NLP based IPBS bio-optimization algorithm for extracting the multi-level inter dependent and optimal features by converting the speech signals into textual feature format. |
| Step 3: | Apply these optimal features to the HDCNN for training purpose, which generates optimal training set. But, during the training higher loss values are generated. |
| Step 4: | Apply the MCS based bio-optimization algorithm on HDCNN with loss values as input, which effectively identifies the solution for loss minimization problems. |
| Step 5: | Retrain the system with loss optimized features using high redundancy HDCNN model. HDCNN system loss optimized with high speed of execution. |
| Start the Testing procedure | |
| Step 6: | Consider the test dataset and repeat the steps 1 to 5, which generates the optimal features with low loss values. |
| Step 7: | Apply, these optimal test dataset features to the HDCNN classifier for testing purpose, which predict and classify the asthma by comparing test features with train feature set. |
Previously, multiple speech processing approaches are used to extract the deep features such as wavelet transforms, IR2T methods. Individuals may quickly produce papers or switchboard by chatting because to technologies. Speech recognition enables the user to generate messages more rapidly since it typically does it at a rate that is far quicker than what a human can enter. Excavation of sound waves indictors from the speech waveform, prediction of the likelihood that the identified indicator sequence was brought about by a hypothesized idiomatic phrase section, as well as selection of the recognized utterance through an exploration between many hypothesized options available are the 3 phases involved in speech identification. But, the computational complexity of the existing methods is increasing as the number of features are increases. The multispectral information is developed to remove characteristics using this wavelet decomposition. The information or pixels matrix of a spectral images is divided into various sub bands using the wavelet decomposition, or the spectral characteristics are then utilized in various ways in subsequent analysis. Thus, this article introducing the novel bio-optimization approaches for extracting the features with low computational complexity and to overcome the state of art problems. Then, preprocessed speech samples are applied to the IPBS based multi-level feature extraction method, which extracts the inter dependent and detailed features from the preprocessed signal. In remote sensing images observation, a multi-level feature extraction technique for discontinuity target recognition is given. At several stages, characteristics from standard photos are collected beforehand. Further, IPBS is used to extract the features over each sample with pitch spectral properties. Classification methods are used to categorize the characteristics that are collected from the speech waveform. These characteristics are quite speaker-specific. Numerous spectral properties that can be employed for SR have been covered in the research. The purpose of this research is to investigate spectral properties that can considerably aid operator recognition methods in sensitive settings. Then, there existed millions of speech properties, so it is difficult to perform training and testing operations with the huge feature set. The drawback of using the identical training set as well as evaluation is that one may not detect generalization error if the product works well on the validation set. Finally, the optimal features are applied to the HDCNN based training operation, which trains the optimal feature based neural network using multiple convolutions based hidden layers. Modeling design, information structures, and training model parameters are the three key variables influencing how well Deep Neural Networks (DNNs) function for enhancing voice. It relies entirely on the intricacy of the issue that are attempting to address whether adding more hidden layers will increase efficiency or not. But all the deep learning models are suffering with the higher training loss as number of epochs are increased. The BMA achieves the optimal trade-off. The movement expense is decreased while still retaining a very high level of forecast accuracy owing to a block-based strategy. This reveals why this method is so well-liked and why video compression guidelines include it. The performance of the deep learning models also reducing as the loss levels are increased. The Error rate can be thought of as a way to assess whether effectively the system models given information. It is a linear formula of the deep learning application’s variables. The assumptions made by the system that constructed are highly related with the gradient descent. Ones models will yield decent results if the gradient descent parameter is minimal. So, this work presented another bio-optimization approach named as MCS to optimize the loss values. The process will be repeated only few times and losses generated in the deep learning model is effectively reduced. Repeated-measures refers to a patient who underwent and over one therapy or was given more than one environment. The research is also referred to as a mixed-model ANOVA if one of the components is repeated-measures & the another is independent (however, beware of the phrase mixed, that in analytics can mean a number of different interpretations). Finally, the performance was significantly improved as compared to the existing approaches.
3.1 MLE-SSA Based Pre-processing
Asthma-related speech signals are extremely sensitive to noise, lowering prediction accuracy. Filtering also lessens signal noise mistakes. The majority of programs employ a low-pass filtering. The ultrasonic waves are muted while the shorter wavelengths elements can pass through. Various systems are used to detect noise from speech signals in the past, but they only removed the basic noise present in pitch levels and were unable to remove frequency-based jitters and phase mismatches. Any variation or relocation of the information impulses in a high-frequency digitized stream is known as jitter. The discrepancy may be in the electromagnetic pulse’s length, component frequency, or intensity. In wavelet transform, filtering is primarily used to minimize noise, which enhances transmission efficiency and aids to retrieve the necessary data from the data. Regarding assessing the fluctuation in ping, jitter is the variance in the significant delay among while a message is delivered and the moment it is retrieved via a data connection. This is frequently brought on by device quality issues, limited bandwidth, and a failure to apply packet prioritization. As a result, the hybrid denoising system was implemented in this system. Three methods are frequently used for noise removal: temporal aggregation, wavelet transform, as well as pattern recognition and computational intelligence restoration. The detailed preprocessing mechanism of speech signals using MLE-SSA is shown in Figure 2. Numerous fields in technology, architecture, economics, and information science use the discrete wavelet transformation. The most notable application is signaling encoding, which is frequently utilized as a prerequisite for compression algorithms and represents a discrete information in a more repetitive manner. The noisy asthma speech signals are first subjected to the Discrete Wavelet Transform (DWT), which decomposes the speech signals into spectral and angular coefficients. A discontinuous wavelet transformation (DWT) divides an input signal into a variety of sets, every group consisting of a response variable of parameters that describe the transmitter time dynamics in the associated frequency spectrum. For image analysis, discrete wavelet transforms can be utilized. A higher quality photograph uses quite a lot of disc space. DWT is employed to shrink an object’s length while sacrificing performance, increasing clarity.
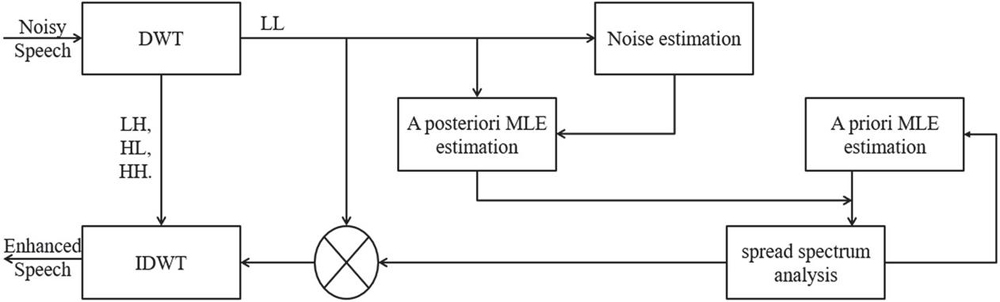
Figure 2 MLE-SSA Preprocessing approach.
Here, spectral coefficients contain the amplitude, phase and pitch intensities, whereas angular coefficients consisting of phase aware information. These characteristically information is generated by converting the time to frequency conversions. Then, initial noise eliminated signal and noise levels are applied to the “A posteriori MLE estimation”. Maximum likelihood estimation (MLE) is a statistical technique for evaluating the characteristics of a probability distribution that has been predicted provided certain observational data. The maximum likelihood approximation is reliable, effective, and homogeneity of variance for representative datasets. It fulfills a similarity characteristic in random studies, is a product of adequate data, in some cases – but not always – is objective & distinct. The process is iterated for multiple number of times until the signal levels is boosted as compared to the noise levels, which can be obtained by using Maximum Likelihood Estimation (MLE). Finally, increment in MLE levels indicates the reduces the decrement in noise levels. The posteriori outcome is applied to the priori information, where the noise presented in the phase and pitch intensities are identified using multi spectral analysis.
Here, “A priori MLE estimation” is used for calculating the spectral gain and also reduces the jitters presented in the various gain data. Spectral gain is improved by identifying and adjusting the lower and higher frequency levels. The process is repeated for multiple number of times and resulted in improved gain factor. Further, the original amplitude of speech signal is multiplied with the gain levels and this multiplication is used to improve the spectral properties. Finally, the resultant amplitude levels are applied to the IDWT with original phase angles and generates the clean speech signal.
3.2 Feature Extraction Using IPBS
Features are the statistical properties of the speech signal, which are used to classify the different types of asthma. But the conventional methods are extracting the low-level features by using basic signal processing methods. Further, the conventional systems need additional feature selection methods, which is a computationally complex. Thus, this article introducing a novel searching procedure named as IPBS to search the features over unique space. Figure 3 shows the proposed IPBS search procedure. Natural language analytics primarily employs 2 methods: syntax analysis as well as text analytics. The placement of phrases in order to ensure proper grammar is known as structure. NLP employs syntactic to evaluate a language’s interesting take on grammar structure. Machines can acquire, comprehend, and create information in human or natural speech with the use of computational linguistics (NLP). Both text/character identification as well as speech/voice identification are able to input data into the database, and NLP aids in the understanding of this data by both systems. IPBS is an advanced NLP based bio-optimization approaches, which converts the speech’s signal into textual data. Then, the best features are extracted from the textual data.

Figure 3 Feature extraction using IPBS.
When there are no alternative useful strategies with superior objective functions, the approach is said to be universally optimum. When there are no other viable alternatives close by with superior objective functions, the answer is said to be regionally optimum. At iteration of N, the j-particle is expressed as the local optimal solution, while the global optimal solution is found in all particles is denoted as . In iteration, the particle is uttered as for the local optimal solution. While the global optimal solution that all particles found is denoted as . Then, next iteration velocity was updated,
| (1) |
Here, d1 and d2 indicates irregular movement of particles around the area of the resolution. The 1 and 2 are two random vectors representing mainly distributed bases in series (0, 1) and each speeding up the particle towards and , respectively. The transition weight is defined as a
| (2) |
Here, and () are representing the initial and final value for . is denoting the most iterations of IPBS algorithm. When the iteration begins, N close to 0 is accepted and is approaching . When N close to, tend to . In general, a large helps PSO algorithm which is smaller in the area, the wider it is and the faster it can integrate with local optimal. After updating the velocity value, the temporary position for particle of iteration is defined a
| (3) |
Here, may be above the value of [1, M] (for ray particles, the range is [1, A]), also determining how particles should be repaired when the current search area is limited is difficult. This work accepts the reflection limit as available data without recommendation. With reflective boundaries, search the boundaries of search gap; while more light comes out of a wall glass or ball, i.e., the boundaries reflect the search location. Unrestrained as well as bound-constrained planning issues can be resolved using the technique of evolutionary algorithm. The technique simulates the physical procedure of raising an object’s warmth and then gradually decreasing it to reduce flaws while conserving nodes are interconnected. Here this work presents the acceptable criteria of the SA (Simulated Annealing) method for updating the local optimal solution as follows,
| (4) |
Change weight and , constant d1, d2, upper speed limit , total particles , maximum regeneration time , starting temperature t0 and cooling speed . (1) And (1) indicate the approximate starting position and velocity selected from the search location. This work can calculate this amount and updated the local and global optimization. As denote the least percentage of particles where total ratio values are equal to the current mass. The loop will complete when the regeneration time reaches to N, or when 90% of the particles have the same ratio value. The weight and velocity of the change in 3–5 rows are calculated to update the position of the particles.
All particles that do not control the speed, the velocity must be controlled to [, ]. The local optimal for j-th particle is updated in the line 6–7. Using the Metropolis acceptance criterion of SA is updated by the global optimal solution under current iterations. By cooling rate the temperature is decreases in line 8–9 and the operation will continue until the while loop gets finished. Assume that Z (P, F) indicates the optimization problem function value, denotes the j state of region. In SA algorithm, the state generation probability C and the reception probability B are respectively defined as
| (5) | ||
| (6) |
The Markov chain associates the SR algorithm. This algorithm combines the global optimal solution with a probability of 1, while the ergodicity and SA algorithm are optimal, then the condition is satisfied.
| (7) |
Where constant denote the local optimum set, denote the minimum transform number from state j to state g, and . When controlling the temperature, the parameter satisfies this condition and becomes the global optimal solution using probability 1 of the IPBS algorithm, as state-level operations represent the integrated distribution of the current generation environment and obtaining the Metropolis criterion. According to Equation (2), (4), and are two random variables which are obeying the uniform distribution Z(0,1), hence new position belongs to the region of
| (8) |
are generated by uniform distribution in , Equation (3.3) is fulfilled the condition (3.3) Meet the condition of a new state (7) approved throughout the metropolis. Therefore, until the (3.2) IPBS algorithm is satisfied, the algorithm switches to a globally optimal solution using probability 1. After receiving the optimal analog precoder matrix the planned user set at subcarrier x, the corresponding channel matrix can be denoted as , which in essence, is the product of the channel matrix and the analog precoder. The wavelet transform method, that divides and condenses a starting collection of original information into smaller, easier-to-manage groupings, includes segmentation method. As a result, processing will be simpler. The fact that these enormous data sets contain a lot of different factors is their most crucial feature. The working function of proposed feature extraction process is given in Table 2 IPBS algorithm.
| Input: Initialize the parameters such as , , d1, d2, , , , , and | |
| Output: Feature vector ( | |
| 1 | Assume the values for , , d1, d2, , , , , and (1), are updated. |
| 2 | If N or 90% do |
| for j 1 to do | |
| 3 | Calculate and (N 1) |
| 4 | Calculate (N 1) |
| 5 | Find sum rate |
| 6 | Substitute and (N 1) using (5) |
| 7 | end for |
| Reduce the temperature | |
| 8 | Increment the iterations until the maximum best features are selected. |
| End while | |
3.3 Classification Using HDCNN
The deep learning mechanisms are resulted in best performance in the field of medical applications due to their swarm intelligence properties. Figure 4 presents the proposed deep learning architecture, which contains the multiple number of convolution layers, rectified linear unit (ReLU) activation function, Recurrent dense layers and SoftMax classifier. The foundation of a CNN is a convolutional layer. It has a number of filtering (or kernels), whose settings must be acquired over the training period. The greatest popular input layer in deep learning techniques is the Rectified Linear Unit. Every negative input causes the procedure to output 0, however any optimum values x causes it to produce that quantity. Synchronous networking construction using levels. Comparable to feed-forward levels, recurring strands can be employed, but their intended intake form is num inputs, batch, sequence length, besides size. The cross-entropy function is used by the Softmax layer. The softmax function, that transforms the actual output integers into normalized good attributes that add from one in order for the cross-entropy loss may be utilized, gives the Softmax classification its surname.
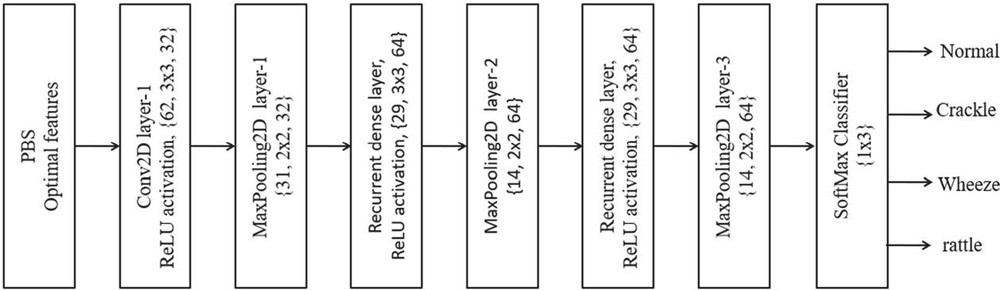
Figure 4 HDCNN architecture.
Knowledge Refinement: The knowledge from a complex model to a small model can be transferred through a technique called refinement. Refinement is a technology that transfers knowledge from a complex model to a small model accordingly. This work has developed the framework of knowledge filtering, the logics vector formed by the sub-network network for an input optimal feature is denoted by , where the vector dimension ] is the quantity of categories D. The SoftMax layer change the logics vector to a probability distribution
| (9) | ||
| (10) |
Then, the higher network provides the logics vector for an input optimal feature is represented by , where the vector dimension is the quantity of categories D. By introducing temperature t, the generalized layer change the logics vector to soft probability distribution
| (11) | ||
| (12) |
The higher model created the refinement class probability as “soft labels”, which is used to create the sub-network model. Training a sub-network model consists of two objective steps. The first objective function minimize the cross entropy with the soft labels and the sub-network model provided the soft probability . Are computed by with the same temperature t as the higher model,
| (13) | ||
| (14) |
The first objective function is
Here, is the probability produced by the sub-network that the optimal features belong to the class, the higher will produce the soft label as , is the sub-network’s weight, is the number of training optimal features, and D is the total class quantity. The second objective function minimizes the hard labels of cross entropy with x-true and the sub-network provide the probability .
Here, is the probability of i-th optimal features belongs to the class provide by the sub-network, is the information of hard label, and while the optimal features belongs to the class, other than that where L is the sub-network’s weight, m is the training optimal features quantity, D is the total classes count. The overall objective function W is weighted average of two different objective functions.
| (17) |
where L indicates the sub-network’s weight and is a relative weight.
During source multi-higher filtering, this work teaches diverse knowledge to multiple higher to increase accuracy and add a variety of records. A soft label is the average weight of a smooth probability distribution that varies according to the author. For the higher T1, T2 and T3 produce soft probability distributions, also produce and with FSOFTMAX layer and the same temperature remains. The soft label is a weighted average of , and :
| (18) |
Where, , and are weighted by 1, 2 and 3, respectively. Temporary network that accepts the input of operating vector and the rest are smaller model in HDCNN series, they can transfer more comprehensive refinement knowledge. The filter system is similar to a given motion vector or the remaining three higher.
Higher network to sub-network mode: Temporary networks that accept the input of the operating vector and the rest are smaller models in HDCNN series, though they can be change further detailed refinement knowledge. Video is frequently compressed using motion vectors, which keep track of how an image transforms through one screen to the following. We find innovative ways to recognize and monitor movement utilizing these matrices as well as a phase-shifting-free replacement for conventional video encoding. The filter system is similar to a given motion vector or the remaining three higher models, but the difference this work considers the motion vector and the rest as input to the sub-network network.
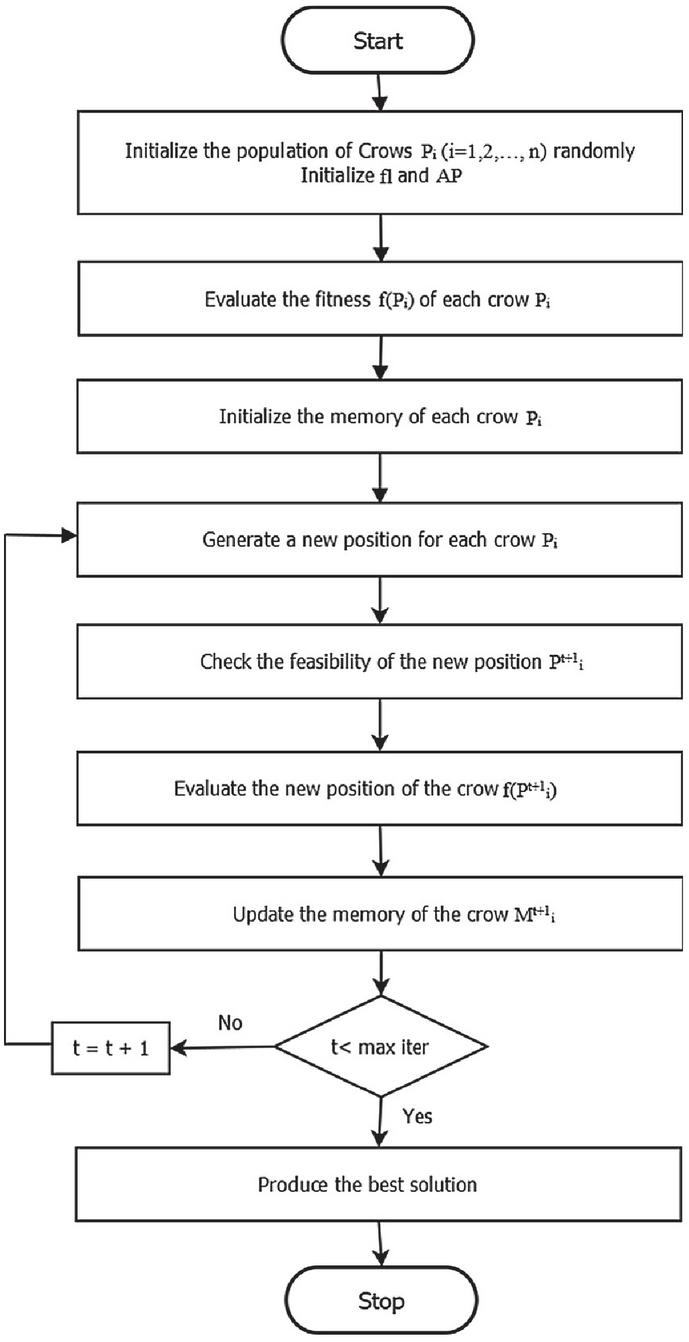
Figure 5 Flow chart of MCS algorithm.
3.4 Loss Optimization Using MCS Algorithm
All the deep learning models are suffering with the high training and testing loss, which needs to be improved. This this work adopted the MCS optimization approach for reducing the losses. Figure 5 presents the flowchart of MCS. Usually, the crows are considered to be the most intelligent creature among mammals. In terms of physical contact with the brain, its brain is slightly smaller than that of a human. There was plenty of evidence for the cleverness of the crows. In glass experiments they show self-knowledge and the ability to create tools. Crows can remember faces and warn each other. The standards of MCS were: crow lives as the group, crows point to the location of its secret places, crows follow one another to do theft. Crows secure its hideouts from being stolen by a probability.
MCS is a novel of forms contains inspiration from the intellect of crows. MCS is shown to be very effective in solving continuous optimization problems, such as pressure vessel design problem and gear train design problem. In this, MCS is a binary Sigmoid converter for solving 2D-BPPS. This work can assume that there is a D-dimensional environment, including the n crows. Each position in the group has a search interval d dimension that returns a vector where j {1,…, n} and for optimization problem each y is a possible solution. In order to the level, each crow has memory of K (T) J, so you remember the best place to store. The Objective function or exercise process optimization evaluates the crow potential of the problem. Depending on the behavior of the crows, the crows will change their position in the search area. The crows randomly choose a crow among the group of crows and follow it to find out where its charge is stored. The potential condition of the crow is assessed on the scale of the optimization problem. The new place of the crow j is obtained by the following equation:
| (19) |
Where denotes the crow flight length and j, denotes the probability of crow awareness j. Also, and denotes the random numbers in the interval [0, 1]. The memory of each crow is updated after checking the position of the new crows in Equation (2). If access to a new level is impossible, crow will remain in its current state.
| (20) |
The MCS will stop when the maximum frequency is reached. The objective function of the exercises at this point is declared as the resolution to the optimization problem. The MCS has a consistent character. A binary version of the MCS is studied for the above reason and used in a 2D-BPP environment. In the initial stage n crow are accidentally placed in a D-dimensional search space. A crow stage given in the binary matrix of B columns and N rows, where N refers the number of objects filled in bins. The representation of each solution t is defined as follows:
| (21) |
Where
| (22) |
The memory of each crow is loaded in its first state. Therefore, the crow state is created by chance and becomes a variety of inaccessible solutions where it cannot be sought. This exceeds the capacity constraints of the bins used, and the solution is inaccessible. Hence, a problem-based knowledge repair operator was system to contract with inaccessible solutions. For overloaded bins, this repair operator is applied and also used to maintain load-bearing capacity in the heavy-duty bins by removing the items. The removed material is fed one by one. A new bin is created when there is no bin to pack the discarded items. The Equation (21) is used to denote the positions of the crows, which contains the actual number of positions. The sigmoid function is used to convert a real value solution to binary. Then, the resultant in crow’s position is defined by the following rules:
| (23) | ||
| (24) |
Calculate the following function:
| (25) |
Calculate the following function:
| (26) |
Then, the Equation (6) is applied to discrete at time T. The associated position for each crow j is updated randomly according to the following rules:
| (27) |
The feasibility of the developed solution is assessed thanks to the objective function. A new specific repair operator is used to install the solution capabilities. Therefore, objective function is used to evaluate and evaluate the quality of solutions by changing the 2D-BPP circumstance:
| (28) |
Table 3 Loss optimization using MCS algorithm
| Input: Initialize the position of crows indicates the various loss values | |
| Output: Optimized loss values | |
| Step 1 | Define the position of crows to hold the loss values generated in the network. |
| Step 2 | Determine the new position of crows by binary searching process. |
| Step 3 | The new position of the crow agent is updated based on lowest combination of optimized loss levels. |
| Step 4 | Determine the behavioral changes in crow positions with respect to the losses generated in the system |
| Step 5 | Compute the updated fitness function |
| Step 6 | Determine binary weight maps of the network with optimized loss levels. |
Here, indicate the number of bins which is used to set the total size of the surface covered by the material shown in V. Then, P indicates the bin capacity by surface, and Z indicates a constant (1), which indicating a concentration in a well-filled tank compared to a less-filled tank. The result of authors’ test shows that Z 2 gives a positive result. This should enhance the objective function and create many bins with available items which will reduce the number of bins used. If the amount of solution is calculated using Equation (3.2), the crow’s memory is updated by t in Equation (12). If the position of the new crow is better than the position of the newly memorized crow, the old crow will refresh the memory with this new position. The maximum iteration time is completed by repeating the previous step. As mentioned above, a crow can have a better hiding place (memory) for each assembly. For maximum iteration, the best memory on the crow swarm is declared as the best solution in the global optimum solution. Table 3 indicates the working function of the loss optimization using MCS.
4 Result and Discussion
This section gives the detailed simulation analysis of proposed model using python simulations on real-time datasets. The performance of proposed method is compared with several state of art approaches for accuracy, precision, sensitivity, specificity, F1-score, and Recall metrics.
4.1 Database Description
The COSWARA database is a scientific challenge conducted by the International Conference on Biomedical and Health Informatics in 2017. It includes a respiratory sound database as well as an approved grading procedure. This database contains a total of 5.5-hour recordings with annotated respiratory cycles from 126 people, which totals 5.5 hours in length. For the sake of simplicity, a record is defined as the collection of lung sounds from a single patient, and a cycle is defined as a single breathing cycle from a single patient. As a result, the overall recording includes 920 samples, of which 374 are “normal,” 237 are “Stridor/ Crackles,” 213 are “wheezes,” and 96 are “Rattle/Rhonchi” Figure 6 presents the time domain representations of speech signals, which are classified as normal, stridor, wheezes and rattle diseases by using proposed model.
The system is trained with 80% of overall samples and tested with 20% of overall samples. Initially, the individual disease type performances are measured by selecting the known disease type speech sample. Further, randomly chosen speech samples are considered to measure the overall performance. The proposed MFESHC defines the ranges for each class of classification by choosing the probability-based features.
Table 4 presents the various probability levels used for separation each class in MFESHC model. Here, the MFESHC assigns the highest probability to Normal class as 0 to 0.4, then 0.41 to 0.6 probability range is assigned to Stridor/ Crackles class, then 0.61 to 0.8 probability range is assigned to wheezes class, and 0.81 to 1 probability range is assigned to Rattle/Rhonchi class, respectively.
4.2 Evaluation Metrics
This section gives the detailed analysis of various performance measures to compute the efficiency of proposed method and to compare with existing approaches. Accuracy is used to defined as the number of correctly classified speech signals with their disease type as compared to the total number of

Figure 6 Predicted asthma-based speech samples(a) normal (b) stridor (c) wheezes (d) rattle.
Table 4 Threshold levels of diseases detection probabilities
| Class | Normal | Stridor/Crackles | Wheezes | Rattle/Rhonchi |
| Threshold values | 0 to 0.4 | 0.41 to 0.6 | 0.61 to 0.8 | 0.81 to 1 |
tests. Sensitivity is defined as the number of mismatched speech samples with normal test dataset. Specificity is defined as the number improperly classified speech signals as compared to the available dataset with maximum number of samples.
| (29) | ||
| (30) | ||
| (31) | ||
| (32) | ||
| (33) |
Here, denotes accurate positive, indicates accurate negative, refers false positive and represents false positive independently. The is the true classified abnormal segments, which denotes the amount of precisely described pieces of wheezes and samples. The represent Total Number of Abnormal bits, wheezes and flies, under the test. The refer the Number of Correctly gathered Normal sections and represent total number of normal bits in the test.
4.3 Performance Evaluation
This section compares the performance of proposed method based on different feature extraction, feature selection and classification approaches. Table 4 show that proposed MFESHC framework resulted in better performance for all diseases as compared to the existing approaches such as BiLSTM [18], VGG19 [19], TSBEL [22] and SVM-LOO [23]. The proposed method resulted in better performance as it optimizes the losses. For the four diseases, proposed method resulted in superior performance as it is extracting best features Table 5.
Table 5 Performance comparison of multiple classes of asthma for various methods
| Asthma Type | Classifier | Precision | Recall | F1 Score | Accuracy | Specificity | Sensitivity |
| Voice sample 1 | BiLSTMs [18] | 88.93 | 90.28 | 89.84 | 89.38 | 87.38 | 85.38 |
| (Normal) | VGG19 [19] | 89.79 | 91.70 | 90.42 | 90.49 | 90.88 | 91.78 |
| TSBEL [22] | 91.33 | 92.48 | 91.11 | 92.96 | 91.81 | 92.85 | |
| SVM-LOO [23] | 95.99 | 93.59 | 94.32 | 95.20 | 96.33 | 93.86 | |
| MFESHC | 98.23 | 98.74 | 97.88 | 98.89 | 98.75 | 98.61 | |
| Voice sample 2 | BiLSTMs [18] | 89.74 | 85.73 | 87.62 | 96.37 | 96.38 | 95.37 |
| (Stridor/Crackles) | VGG19 [19] | 90.25 | 89.20 | 90.99 | 91.05 | 89.08 | 90.72 |
| TSBEL [22] | 93.00 | 90.20 | 91.02 | 93.27 | 90.18 | 93.61 | |
| SVM-LOO [23] | 94.35 | 92.80 | 91.97 | 96.29 | 94.29 | 95.79 | |
| MFESHC | 98.13 | 98.47 | 97.10 | 98.03 | 98.27 | 98.38 | |
| Voice sample 3 | BiLSTMs [18] | 87.36 | 93.27 | 91.38 | 96.39 | 95.34 | 94.69 |
| (Wheezes) | VGG19 [19] | 89.49 | 92.40 | 89.17 | 89.33 | 91.28 | 94.36 |
| TSBEL [22] | 91.67 | 94.92 | 91.19 | 90.34 | 93.22 | 95.12 | |
| SVM-LOO [23] | 92.45 | 95.18 | 93.88 | 96.99 | 94.36 | 95.19 | |
| MFESHC | 98.03 | 98.12 | 97.27 | 98.30 | 98.13 | 98.12 | |
| Voice sample 4 | BiLSTMs [18] | 68.37 | 71.39 | 69.37 | 76.38 | 75.46 | 96.49 |
| (Rattle/Rhonchi) | VGG19 [19] | 90.30 | 91.99 | 92.08 | 89.74 | 92.44 | 89.51 |
| TSBEL [22] | 91.31 | 93.47 | 94.34 | 94.37 | 93.21 | 92.81 | |
| SVM-LOO [23] | 96.69 | 93.93 | 95.17 | 96.75 | 95.73 | 93.50 | |
| MFESHC | 98.11 | 98.03 | 97.08 | 98.18 | 98.02 | 98.09 |
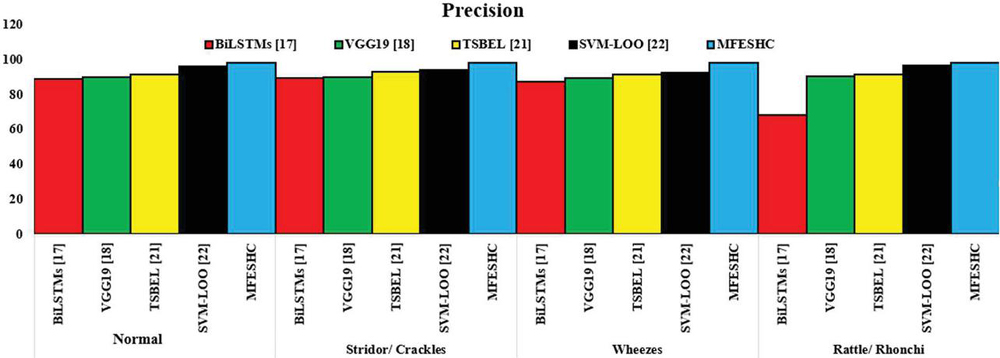
Figure 7 Graphical representation of precision.
Figure 7 represents the graphical representation of performance comparison of precision. During normal type of asthma detection, the MFESHC improved precision by 10.457% compared to BiLSTM [18] model. During stridor/crackle type of asthma detection, the MFESHC improved precision by 9.542% compared to VGG19 [19] model. During wheezes type of asthma detection, the MFESHC improved precision by 6.937% compared to TSBEL [22] model. Further during rattle/rhonchi type of asthma detection, the MFESHC improved precision by 7.44% compared to SVM-LOO [23] model.
Figure 8 represents the graphical representation of performance comparison of recall. During normal type of asthma detection, the MFESHC improved recall by 9.3708% compared to BiLSTM [18] model. During stridor/crackle type of asthma detection, the MFESHC improved recall by 5.5027% compared to VGG19 [19] model. During wheezes type of asthma detection, the MFESHC improved recall by 14.860% compared to TSBEL [22] model. Further during rattle/rhonchi type of asthma detection, the MFESHC improved recall by 10.39237668% compared to SVM-LOO [23] model.
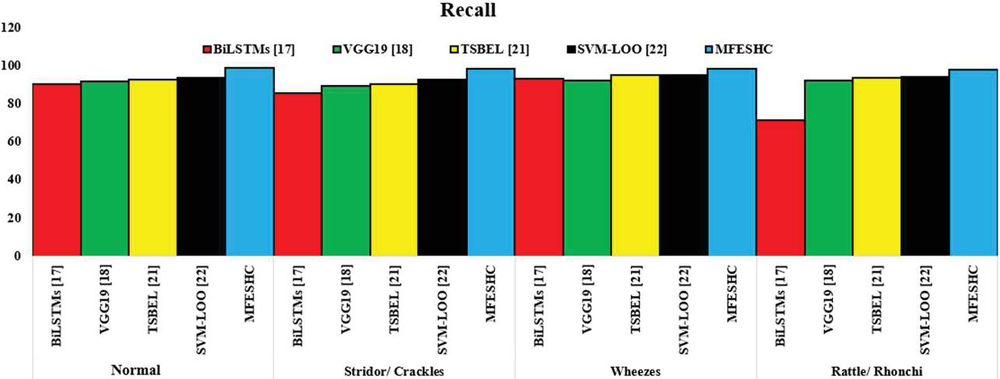
Figure 8 Graphical representation of recall.
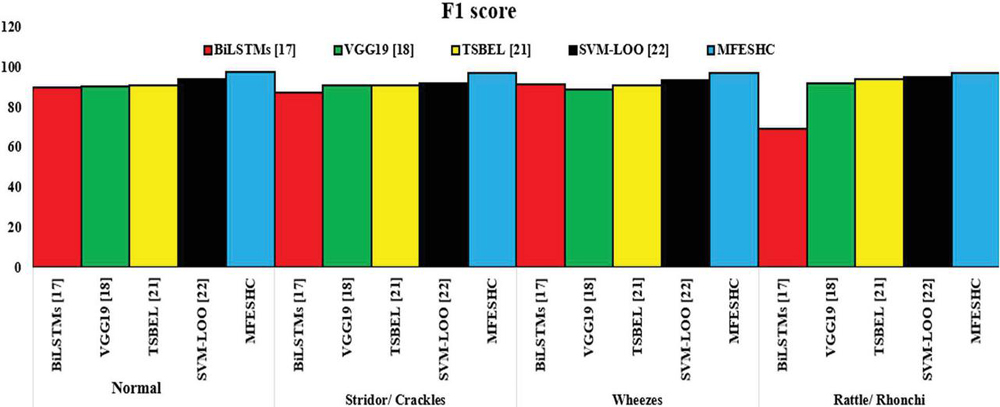
Figure 9 Graphical representation of F1-score.
Figure 9 represents the graphical representation of performance comparison of F1-Score. During normal type of asthma detection, the MFESHC improved F1-Score by 6.445% compared to BiLSTM [18] model. During stridor/crackle type of asthma detection, the MFESHC improved F1-Score by 9.0837% compared to VGG19 [19] model. During wheezes type of asthma detection, the MFESHC improved F1-Score by 5.4300% compared to TSBEL [22] model. Further during rattle/rhonchi type of asthma detection, the MFESHC improved F1-Score by 8.2503% compared to SVM-LOO [23] model.
Figure 10 represents the graphical representation of performance comparison of Accuracy. During normal type of asthma detection, the MFESHC improved Accuracy by 10.639% compared to BiLSTM [18] model. During stridor/crackle type of asthma detection, the MFESHC improved Accuracy by 9.282% compared to VGG19 [19] model. During wheezes type of asthma detection, the MFESHC improved Accuracy by 6.3790% compared to TSBEL [22] model. Further during rattle/rhonchi type of asthma detection, the MFESHC improved Accuracy by 3.8760% compared to SVM-LOO [23] model.
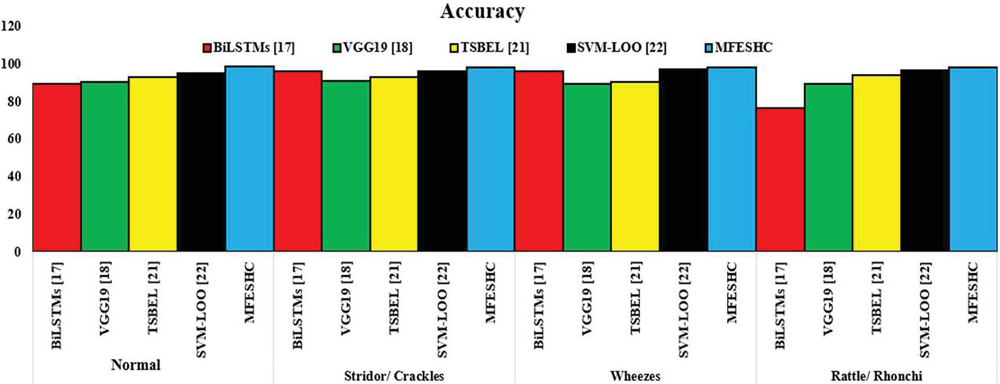
Figure 10 Graphical representation of accuracy.
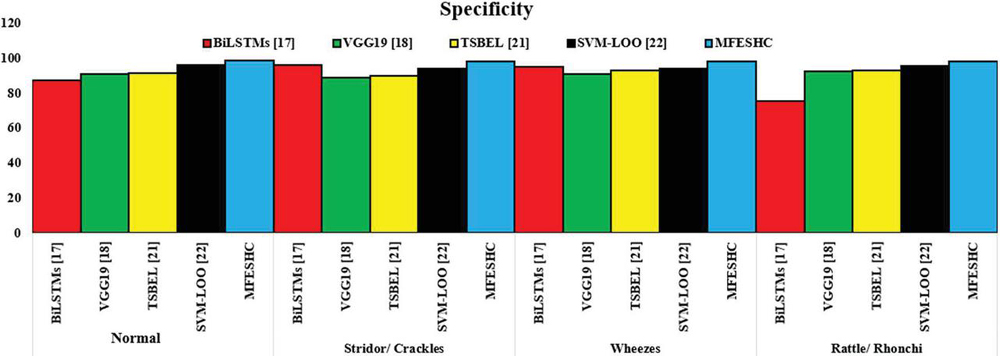
Figure 11 Graphical representation of specificity.
Figure 11 represents the graphical representation of performance comparison of specificity. During normal type of asthma detection, the MFESHC improved specificity by 13.012% compared to BiLSTM [18] model. During stridor/crackle type of asthma detection, the MFESHC improved specificity by 7.559% compared to VGG19 [19] model. During wheezes type of asthma detection, the MFESHC improved specificity by 8.970 % compared to TSBEL [22] model. Further during rattle/rhonchi type of asthma detection, the MFESHC improved specificity by 4.221% compared to SVM-LOO [23] model.
Figure 12 represents the graphical representation of performance comparison of sensitivity. During normal type of asthma detection, the MFESHC improved sensitivity by 15.495% compared to BiLSTM [18] model. During stridor/crackle type of asthma detection, the MFESHC improved sensitivity by 5.060% compared to VGG19 [19] model. During wheezes type of asthma detection, the MFESHC improved sensitivity by 6.203% compared to TSBEL [22] model. Further during rattle/rhonchi type of asthma detection, the MFESHC improved sensitivity by 7.441% compared to SVM-LOO [23] model. Further, the performance of randomly selected voice samples is presented in Table 6, which shows the effectiveness of MFEHC method. Table 6 shows the performance comparison of proposed method with existing classifiers such as BiLSTMs [18], VGG19 [19], TSBEL [22] and SVM-LOO [23]. The proposed method extracted the unique features, so it resulted in superior performance. Further, the graphical representation of Table 6 is presented in Figure 13.
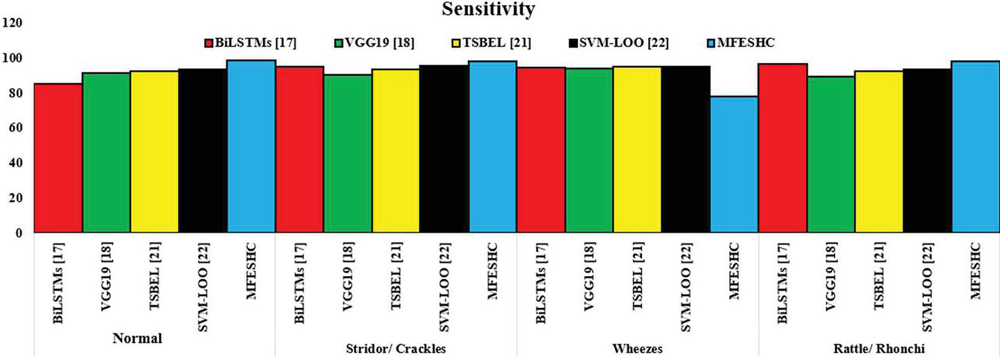
Figure 12 Graphical representation of sensitivity.
Table 6 Performance comparison of classification methods using random samples
| Method | Accuracy | Specificity | Precision | F1-Score | Sensitivity | Recall |
| BiLSTMs [18] | 90.80 | 89.06 | 84.30 | 87.30 | 91.30 | 90.30 |
| VGG19 [19] | 84.80 | 81.70 | 81.40 | 81.40 | 81.38 | 81.70 |
| TSBEL [22] | 93.67 | 92.67 | 87.91 | 92.91 | 93.15 | 92.91 |
| SVM-LOO [23] | 94.50 | 90.00 | 94.60 | 94.91 | 97.67 | 93.81 |
| MFESHC | 98.10 | 98.75 | 98.23 | 97.88 | 98.31 | 98.74 |
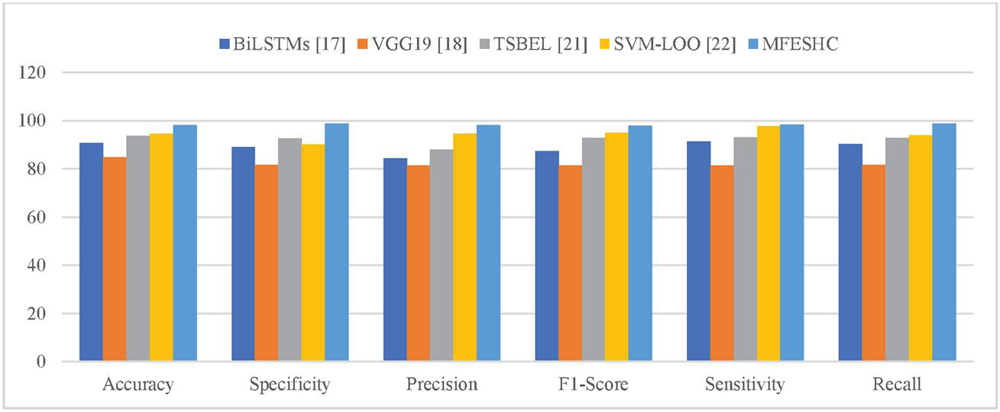
Figure 13 Graphical representation of performance comparison.
5 Conclusion
This work has proposed real time asthma disease detection and identification technique for speech signals using MFESHC. Initially, MLE-SSA preprocessing method was introduced to reduce the noises presented in the speech signals, which also eliminates phase mismatches, phase changes and improves the speech quality. Then, IPBS is a bio-optimization based NLP approach, which is used to convert the speech signals into textual format. Then, best features are extracted and selected from the textual data, which also identifies the relationship between various features. In addition, HDCNN model is used to train and test the network by using these optimal features. Usually, the deep learning models are suffering with the training and testing loss. So, MCS based bio-optimization approach is used to reduce these loss values and resulted in superior performance as compared to the state of art approaches. This work is consuming considerable computation time. Thus, to overcome this problem, this work can be extended to implement advanced extreme learning machines to improve the performance.
Declarations
Funding: Authors did not receive any funding.
Conflicts of interests: Authors do not have any conflicts.
Data Availability Statement: No datasets were generated or analyzed during the current study.
Code availability: Not applicable.
Authors’ Contributions: Asim Iqbal, K. Devarajan, is responsible for designing the framework, analyzing the performance, validating the results, and writing the article. Syed Musthak Ahmed, is responsible for collecting the information required for the framework, provision of software, critical review, and administering the process.
References
[1] Gayathri, G. V., and S. C. Satapathy. “A Survey on techniques for prediction of asthma.” Smart Intelligent Computing and Applications. Springer, Singapore, 2020. 751–758.
[2] Akbar, Wasif, et al. “Predictive Analytics Model Based on Multiclass Classification for Asthma Severity by Using Random Forest Algorithm.” 2020 International Conference on Electrical, Communication, and Computer Engineering (ICECCE). IEEE, 2020.
[3] Ullah, Rahat, et al. “A comparative study of machine learning classifiers for risk prediction of asthma disease.” Photodiagnosis and photodynamic therapy 28 (2019): 292–296.
[4] Mozaffarinya, M., et al. “A data-mining algorithm to assess key factors in asthma diagnosis.” Revue Française d’Allergologie 59.7 (2019): 487–492.
[5] Pooja, M. R., and M. P. Pushpalatha. “A predictive framework for the assessment of asthma control level.” Int J Engs Adv Technol 8 (2019): 239–245.
[6] Harvey, Julie L., and Sathish AP Kumar. “Machine Learning for Predicting Development of Asthma in Children.” 2019 IEEE Symposium Series on Computational Intelligence (SSCI). IEEE, 2019.
[7] Gaudillo, Joverlyn, et al. “Machine learning approach to single nucleotide polymorphism-based asthma prediction.” PloS one 14.12 (2019): e0225574.
[8] Silveira, Arthur, Cristian Muñoz, and Leonardo Mendoza. “Severe asthma exacerbations prediction using neural networks.” International Conference on Engineering Applications of Neural Networks. Springer, Cham, 2019.
[9] Di Caprio, Debora, et al. “A novel ant colony algorithm for solving shortest path problems with fuzzy arc weights.” Alexandria Engineering Journal (2021).
[10] Phan, Dinh-Van, et al. “Deep learning approaches for sleep disorder prediction in an asthma cohort.” Journal of Asthma 58.7 (2021): 903–911.
[11] Wang, Xiao, et al. “Deep Learning Models to Predict Pediatric Asthma Emergency Department Visits.” arXiv preprint arXiv:1907.11195 (2019).
[12] Exarchos, Konstantinos P., et al. “Artificial intelligence techniques in asthma: a systematic review and critical appraisal of the existing literature.” European Respiratory Journal 56.3 (2020).
[13] Kaplan, Alan, et al. “Artificial intelligence/machine learning in respiratory medicine and potential role in asthma and COPD diagnosis.” The Journal of Allergy and Clinical Immunology: In Practice (2021).
[14] Bhat, Gautam S., et al. “Machine learning-based asthma risk prediction using IoT and smartphone applications.” IEEE Access 9 (2021): 118708–118715.
[15] Kumar, Ajay, et al. “Towards cough sound analysis using the Internet of things and deep learning for pulmonary disease prediction.” Transactions on emerging telecommunications technologies (2020): e4184.
[16] Balamurali, B. T., et al. “Deep Neural Network-Based Respiratory Pathology Classification Using Cough Sounds.” Sensors 21.16 (2021): 5555.
[17] AlSaad, Rawan, et al. “Interpreting patient-Specific risk prediction using contextual decomposition of BiLSTMs: application to children with asthma.” BMC medical informatics and decision making 19.1 (2019): 1–11.
[18] Kim, Yoonjoo, et al. “Respiratory sound classification for crackles, wheezes, and rhonchi in the clinical field using deep learning.” Scientific Reports 11.1 (2021): 1–11.
[19] Tong, Yao, Amanda I. Messinger, and Gang Luo. “Testing the generalizability of an automated method for explaining machine learning predictions on asthma patients’ asthma hospital visits to an academic healthcare system.” IEEE Access 8 (2020): 195971–195979.
[20] Yahyaoui, Amani, and Nejat Yumuşak. “Deep And Machine Learning Towards Pneumonia And Asthma Detection.” 2021 International Conference on Innovation and Intelligence for Informatics, Computing, and Technologies (3ICT). IEEE, 2021.
[21] Chen, Long, et al. “Unprofessional problems and potential healthcare risks in individuals’ social media use.” Work 68.3 (2021): 945–953.
[22] Khasha, Roghaye, Mohammad Mehdi Sepehri, and Nasrin Taherkhani. “Detecting asthma control level using feature-based time series classification.” Applied Soft Computing 111 (2021): 107694.
[23] Singh, Om Prakash, Ramaswamy Palaniappan, and M. B. Malarvili. “Automatic quantitative analysis of human respired carbon dioxide waveform for asthma and non-asthma classification using support vector machine.” IEEE Access 6 (2018): 55245–55256.
[24] Altan, Gökhan, et al. “The diagnosis of asthma using Hilbert-Huang transform and deep learning on lung sounds.” arXiv preprint arXiv:2101.08288 (2021).
[25] Shibly F H A, Kumar R L. “Image Processing for Automatic Cell Nucleus Segmentation Using Super pixel and Clustering Methods on Histopathological Images”, Tamjeed Journal of Healthcare Engineering and Science Technology, 1.1, 2022.
[26] Wu, Wei. “Predicting atopic asthma by using eNose breath profiles with machine learning.” Journal of Allergy and Clinical Immunology 146.5 (2020): 1010.
[27] Khan, Misha Urooj, et al. “Embedded System Design for Real-time Detection of Asthmatic Diseases Using Lung Sounds in Cepstral Domain.” 6th International Electrical Engineering Conference (IEEC 2021) April, 2021 at NEDUET. 2021.
[28] Aroud, Rawabi A., Anas H. Blasi, and Mohammed A. Alsuwaiket. “Intelligent Risk Alarm for Asthma Patients using Artificial Neural Networks.” arXiv preprint arXiv:2009.12175 (2020).
[29] Hosseini, Seyed Ahmad, et al. “Neural Network–Based Clinical Prediction System for Identifying the Clinical Effects of Saffron (Crocus sativus L) Supplement Therapy on Allergic Asthma: Model Evaluation Study.” JMIR Medical Informatics 8.7 (2020): e17580.
[30] Kontogianni, Konstantina, et al. “COPD and Asthma Differentiation using Quantitative CT Biomarkers by Hybrid Feature Selection and Machine Learning.” (2021).
[31] Di Caprio, Debora, et al. “A novel ant colony algorithm for solving shortest path problems with fuzzy arc weights.” Alexandria Engineering Journal (2021).
[32] Kumar, Priyan Malarvizhi, et al. “Cloud and IoT based disease prediction and diagnosis system for healthcare using Fuzzy neural classifier.” Future Generation Computer Systems 86 (2018): 527–534.
Biographies

Md. Asim Iqbal received his M.Tech degree from the JNTU Hyderabad and pursuing Ph.D in Annamalai University. In 2013 he was appointed as Assistant Professor at KUCE&T, Kakatiya University. The author has over 24 international Journals, 4 National Conferences, and 1 book. His research interests include Speech Processing, Embedded Systems, and Wireless Networks. He is an active member of The Indian Society for Technical Education (ISTE), IETE and Institution of Engineers (India) (IEI). He received two prestigious awards like IEI Young Engineers award in the year 2021 and Bharat Vikas award in the year 2018.

K. Devarajan received his M.E and Ph.D degree from the Annamalai University. In 2006 he was appointed as Assistant Professor at Annamalai University. The author has over 40 international Journals, 11 International, 2 National conference and 2 books. His research interests include Wireless Communication Networks and Security Management, Antenna Design. He is an active member of the International Association of Engineers (IAENG), Institute of Research Engineers and Doctors (IRED) and The Indian Society for Technical Education (ISTE) societies.

Syed Musthak Ahmed, perused his BE, and ME in Electronics from Bangalore University, Bangalore and Ph.D. from Vinayaka Mission’s University, Tamil Nadu. He has around 35 years of teaching experience, teaching UG, PG and guiding Research Scholars. Four Scholars perused Ph.D. under him and presently guiding 3 scholars of home University other Universities. He served at various capacities as Professor and Head of department, Dean of Academics, Dean of Students Affairs and presently working as Professor and Dean of Students welfare at SR University, Warangal, Telangana has published around 120+ papers at various National and International Conferences/Journals. He has completed a Sponsored research project under Department of Science and Technology, Govt. of India. He is life member of ISTE, IETE, SMIEEE, MIAENG and MIAMT. He served the IEEE professional society, IEEE Hyderabad Section at various capacities as Section Executive Member, Students Activities Chair, Mentor Young Professionals, Chair and Vice Chair of Education Society and presently nominated as Chair Education Society.
Journal of Mobile Multimedia, Vol. 19_6, 1495–1530.
doi: 10.13052/jmm1550-4646.1967
© 2023 River Publishers