HDQNN-Net: An Optimal Asthma Disease Detection Technique for Voice Signal Using Hybrid Deep Q-Neural Networks
Md. Asim Iqbal1, K. Devarajan1,* and Syed Musthak Ahmed2
1Dept. of E.C.E, Annamalai University, Tamil Nadu, India
2Dept. of E.C.E, SR University, Warangal, Telangana, India
E-mail: mdasimiqbal605@gmail.com; devarajan_lecturer@yahoo.com
*Corresponding Author
Received 02 December 2022; Accepted 29 May 2023; Publication 13 October 2023
Abstract
Recently, asthma patients are severely suffering COVID-19 disease, thus the asthma has become one of the dangerous diseases in the world. Further, asthma is occurring in all age groups, which causing huge loss to patient’s health. The primary way to detect the asthma in humans is done by their speech signals, as the asthma severity is increases, which manipulates the properties of speech signal. The conventional methods are failed to extract the maximum features from the speech signals, which resulted in low classification performance. Thus, this article is focused on implementation of real time asthma disease detection and identification technique from speech signals using Hybrid Deep Q Neural Networks (HDQNN). Initially, the features from the speech signals are extracted by using Krill herd optimization (KHO) approach, which extracts the detailed disease specific features. Further, the optimal features are extracted by using chaotic opposition krill herd optimization (COKHO) algorithm. Then, HDQNN is used to classify the type of asthma such as normal, and stridor classes. Further, COKHO is also used to optimize the losses generated in the HDQNN model. The simulation results shows that the proposed HDQNN method resulted in superior performance as compared to state of art approaches.
Keywords: Asthma detection, HDQNN, chaotic opposition krill herd optimization, deep neural network, krill herd optimization.
1 Introduction
Asthma is a disease characterized by chronic tenderness of the airways that causes smooth muscle contraction that can lead to asthma symptoms such as shortness of breath, cough and chest tightness, medical history and spirometry test to diagnose asthma. This paper offers an aggressive mechanism that can be used to study breathing for the diagnosis of asthma. There are various techniques in the literature for detecting the concentration of these gases during respiration. The amount of nitrous oxide can be calculated based on conversion of NO to NO2 by a chemical reaction [1]. Adjustable diode laser absorption spectroscopy is another technique used for examine nitric oxide to analyze shortness of breath [2]. Laser absorption spectroscopy (LAS) is an absorption spectroscopic technique that uses a laser as the light source and estimates chemical concentration by detecting changes in laser beam intensity following transmission throughout the optical channel. In other literature, Polyvinylidene fluoride (PVDF) film is used as a sensitive component to create a respirator in the consular configuration. This sensor records the laws of respiration.
Respiration contains a very complex molecular matrix containing many chemical compounds and organ components. Compounds such as oxygen, carbon dioxide, nitrogen, and water are here in excessive concentrations. Of these, 3500 VOC (volatile organic compounds) are establishing in minute concentrations [3, 4]. In terms of diagnostics, marker concentration biomarkers (billions of parts) can range from PPP to Trillion dollars (PPT) concentration levels that can be complicate to identify with conventional hardware. Therefore, collection or pre-concentration of a breath sample prior to analysis is mandatory. A little measurement of the breath contains a huge element of the gas swap over in the blood, and you can get the best analytical results by selecting this small part with an analyzer or anterior center [5]. Now, research on aromatic systems has become clearer, mainly due to its successful use [6]. The alpha factory signal and signals that the human senses see carry more information than the human senses, while the electronic nose is the device that receives such signals. The electronic nose contains electrochemical sensors that detect odors that are simple or complex [7]. Therefore, the electronic nose be used to quickly as well as independently diagnose many diseases caused and isolated by the invention of the human body [8, 9].
Asthma is a chronic respiratory syndrome in which the airways of the lungs become narrow, narrow and swollen. Common symptoms of asthma are dyspnea, chest pain, and cough. According to World Health Organization (WHO) [10], asthma currently affects 235 million people worldwide, making it one of the most common chronic diseases that affect the children. The risk of asthma is expected to increase in the coming years, leading to an increase in morbidity and mortality [11].
It was used a follow-up monitoring device that detects the audio signal whenever a conventional dry dust inhaler is used. Each record is kept with a special timestamp that records the use of the inhaler [12]. Finding the inhaler from the inhaler’s records is empirical evidence that the drug has been ingested, and allows clinics to monitor the use of inhalers in patients. Inhaler should be held by patient between thumb at base and index and middle fingers at top. Ask the patient to lean their head back slightly, take a slow, deep breath through their lips, and push the inhaler canister at the same time. Ask the patient to hold their breath for around 10 seconds without exhaling medicine. Manual classification of inhalers from inhaler signals is a complex and time intense method for clinics, so an efficient algorithm that can be identify as well as determine respirations is very effective [13]. Throughout the routine problem, the sound returns to the “breathing” position. During respiration [14], the mass of the vocal folds is expelled along with the glottis level. The air coming from bronchitis does not create vocal nodes with vibration [15]. The folding track can be maintained during sound formation, especially in the case of unnoticed and verbal problems [15, 16]. In the unexpected subject, the song scenes happen very close to each other and break them. In a less pronounced state (i.e., the entire vocal training program) [17], the song becomes deeper and stronger and closes the glottis. The relatively closed glottis causes a high noise muffler as well as a closing oscillation [18]. The airflow from the branches is agitated by sound cables and the half-life of the tension is increased [19]. In order to increase the specific stress, the accelerations are related to the height, and the stress stability is called the audio stability [20]. Recently, many algorithms for asthma identification and characterization have been proposed. The accuracy of asthma exacerbations is even more important when distinguishing between asthma and non-asthma. Therefore, in order to develop the accuracy of many parameters of respiratory vibration, companies are moving deeper and deeper. In addition to the long production phase and equipment configuration requirements, the evaporation gradient is a problem for deeper systems as companies get deeper and deeper. In order to identify patients with asthma and non-asthma, we have improved behavioral accuracy. The asthma classification prediction performance is purely depending upon the speech signal properties and their features. The conventional deep learning methods are directly training with all available features and not considering the optimal features. To overcome these problems, this work offers advanced asthma prediction through voice samples using the advanced deep learning methods. Deep learning methods were used to recognize the various type of sounds, since deep learning operates on several neural networks of three or more layers and attempt to imitate the behavior of the human brain. It enables statisticians to learn and analyze trends from large amounts of information. The major contributions of this paper are organized as follows:
• Recently, bio-optimization approaches are using in constraint related problems. Initially, KHO algorithm-based feature extractor is used to extract the features from the dissimilar types of breathing sound of speech signal coming from the trunk in the same incidence variety as breathing.
• Thus, the novelty of this work is that “the proposed method utilizes the COKHA for feature selection”. So, the COKHA is capable of selecting the high probabilistic features.
• Finally, the HDQNN model is trained and tested with these optimal features for better performance.
Rest of the paper is organized as follows: Section 2 deals with the conventional systems with their drawbacks, Section 3 deals with the detailed implementation of proposed architecture. Section 4 deals with the simulation results and analysis. Finally, Section 5 concludes the paper with possible future enhancements.
2 Related Works
In [21] authors have proposed a precipitation sensor that responds to the output of the breath. To form the zinc in the gas sensor, the ratio of the zinc oxide and stannic oxide nano powder are used. The reaction of the atmospheric sensor to respiratory asthma is different from that of the normal respiratory reaction. The electrical conductivity, sensitivity, response time, and humidity sensor recovery time under the influence of uncomfortable breathing are calculated and compare with the normal response. As part of routine data collection, a spirometer is used to distinguish between a normal person and an asthma patient. The response of the rainfall sensor to normal and asthma subjects varies from regular to persistent. The nature of the precipitation sensor is designed for normal, infectious cases. Comparison of normal and asthma pellet sensor response to use as an adjunct to asthma diagnosis.
In [22] authors have proposed the evaluated the phenomenon of VDT transcription scales in humans, using the newly developed miscommunication system to identify common pattern or mechanism of various pathologies, whether fundamental or transient causal between specific human diseases. A proven method with osteoporosis showing one or two severe strokes, especially Chronic Obstructive Pulmonary Disease (COPD) asthma. The latter showed no effect of VTD on known molecular pathways. Based on conclusion, a assessment and meta-analysis of available data based on objective activity (compulsory expiration rate per second, FEV1%) did not reveal VDT’s important impact on the objective development of any subsequent situation.
In [23] authors recommended a planned cross-examination of 44 children aged 6–12 years; Asthma is diagnosed according to the Global Asthma Initiative (GINA) criteria. The children’s saliva immunoassay was performed at 37 cytokines and 785 nm by SERS (Surface Enhanced Raman Spectroscopy) analysis. We also found a large structure for bronchial cases between IL-8 (p 0.004), IL-10 (p 0.008) and sCD163 (p 0.003). The Raman range increases significantly in this region from 760 to 1750 cm. The Principal Component Analysis and Linear Discriminant Analysis (PCA-LDA) method was 85% sensitivity, 82% specificity, and 84% accuracy for asthma analysis. These results indicate the presence of a subclinical inflammatory condition, which may indicate lung regeneration in the population. To identify the bronchitis the SERS method is used and the endotype allowing for a more sensitive and accurate diagnosis.
In [24] authors have proposed a model of LPS air respiration has developed a model of metabolic changes similar to those of horses in a natural way. To determine the more pronounced metabolism of air respiration in horses affected by asthma and LPS compared to healthy horses, the metabolic pathway was analyzed by appropriate Fisher testing. The most well-known modes of metabolism are fatty acid biology, gelatos metabolism, and the citrate cycle. These results propose that the airway induction pattern with LPS is a good case study model for cattle with asthma due to the similarity in profile of lung cells (especially neutrophils) and similar metabolites found in bronchoalveolar lavage fluid (BALF) during airway. Further studies will shed light on metabolic disorders and their importance in the pathogenesis of equine asthma.
In [25] authors have proposed the occurrence of asthma and allergic diseases revealed an escalating tendency over the space between the two studies, which was important for dry cough and pollen allergy. The number of indoor air pollution is extensively reduced. However, we found an association between PM2.5 level and asthma prevalence and a dose-effective relationship. The history of asthma and allergies, poor nutrition and non-Mediterranean diet are associated with an increased risk of these diseases.
In [26] authors have proposed the SPLA2-X is found in human asthma and human virus samples, which play an important role in regulating this type 2 inflammation, AHR, and eco sanide production. We discuss the regulation of eosinophils in leukocytes, the mechanism of action of SPLA2-X, the production of glycerophospholipids, and the mediation of receptors. This article or section needs sources or references that appear in credible, third-party publications.
In [27] authors have proposed the biggest improvement in asthma genetics over the past 13 years is the combination of asthma genetic variations with drug targets. Further research is needed to determine the functional significance of genetic variants associated with asthma in subgroups of patients and to describe the biological networks in which they operate. Finding genetically controlled asthma drug targets will lead to the reuse of existing asthma medications and the development of new therapies.
A novel Block-Chain (BC)-assisted optimized deep learning method, explicitly enhanced dragonfly algorithm based Deep Neural Network (IDA-DNN), is suggested for diagnosing the various illnesses of COVID-19 patients. The results of the suggested approach are analyzed and compared to those of other widely used methods [28].
Health support systems confront significant difficulties include a lack of sufficient medical information, avoidable mistakes, data security risks, incorrect diagnoses, and delayed communication. In order to solve this issue, a wearable sensor that are integrated to big data mining IoT-based analysis [29].
In [30] authors have proposed Metal Nodes with Zn (II) Ions Zn3 (OH) Secondary Structural Units (SSU) is a metal of biodegradable structure with a strong hexa carboxylic acid binder of 5,5,5,1 dm. A N, N-dimethylacetamide). Then, High sensitivity of Complex 1 is used as a fluorescent sensor, due to significant resistance to water and its ability to detect Fe3 ions in aqueous solution have been studied. In addition, the complex treatment of pediatric asthma was evaluated and its associated mechanism was investigated. First, it detects reverse transcription polymerase chain reaction by comparative performance of the BLC-2 gene and determines the apoptotic status of cells that detect cell apoptosis.
In [31] authors have proposed Analysis of spatial-temporal clusters of asthma and sociological factors related to asthma hospitalization rates, Asant, China, and Guangxi. Methods: Asthma Hospital and Socio-Environmental Data Collected In 2015, a space-time scan was used for 88 counties/ municipalities in Guangxi, China to identify high-risk periods and asthma hospital locations. We used the geodector and the Sphereman correlation coefficient to study the socio-environmental factors associated with asthma hospital admission rates.
In [32] authors contain an existing original technique for ID of wheeze, pop, and standard sound using the genuine Optimized S-Transform (OST) and tremendous extra affiliations (ResNets). However, the noise of uncomfortable breathing determines the specific OST. The respiratory sound classes are seen, after the learning and the representation are satisfied by the ResNet. The projected OST have the features of wheeze, snap, respiratory sounds, and excessive control of research creates cautious properties for the best guarantee, and this particular strategy provides a reliable recognition of telemedicine and E-wellness analysis associated with respiratory infections. The classification is executed via preparing and analysis by the techniques for ANN, GMM, CNN, ensemble CNN and CNN.
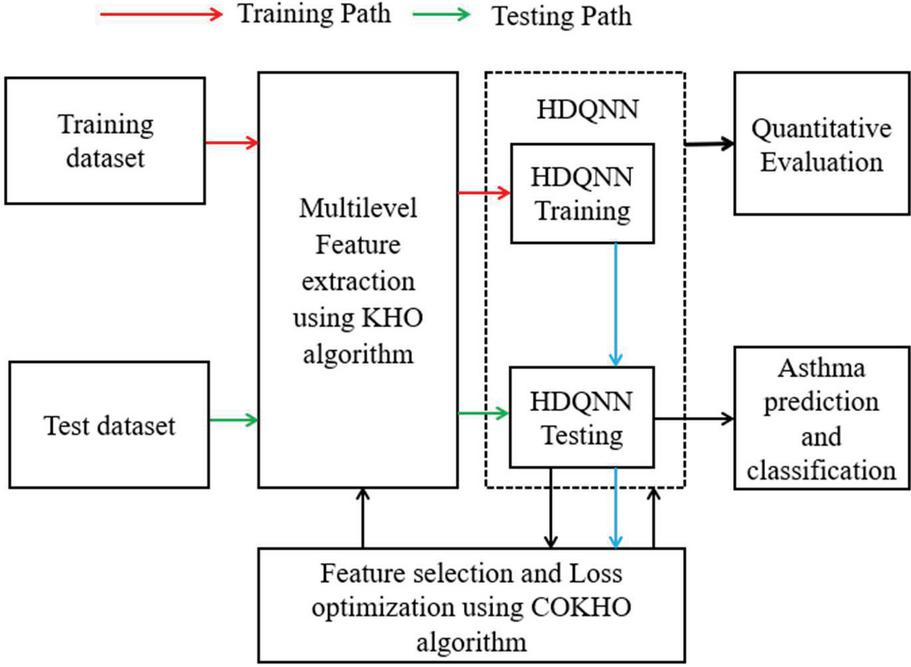
Figure 1 Proposed HDQNN technique for asthma classification.
| Input: Training dataset and Test data | |
| Output: Asthma detection, Quantitative evaluation | |
| Start the training procedure | |
| Step 1: | Apply the KHO algorithm for extracting the multi-level inter dependent and optimal features by converting the speech signals into textual feature format. |
| Step 2: | Apply the COKHO algorithm for extracting the disease specific best features. |
| Step 3: | Apply these optimal features to the HDQNN for training purpose, which generates optimal training set. But, during the training higher loss values are generated. |
| Step 4: | Apply the MCS based bio-optimization algorithm on HDQNN with loss values as input, which effectively identifies the solution for loss minimization problems. |
| Step 5: | Retrain the system with loss optimized features using high redundancy HDQNN model. HDQNN system loss optimized with high speed of execution. |
| Start the Testing procedure | |
| Step 6: | Consider the test dataset and repeat the steps 1 to 5, which generates the optimal features with low loss values. |
| Step 7: | Apply, these optimal test dataset features to the HDQNN classifier for testing purpose, which predict and classify the asthma by comparing test features with train feature set. |
3 Proposed System Model
This section gives the detailed analysis about the proposed methodology by using the various operational blocks. Figure 1 presents the block diagram of proposed approach with training and testing stages. Table 1 presents the proposed algorithm for detecting the asthma from speech-based sound signals. Usually, the speech signals of different age groups contain with inter dependent features. Vocal cord vibration is a necessary component of speech production. Because the vocal tract is a component of the lung airways, which are resistant to inflammation, voice alterations can happen in respiratory illnesses like asthma. Based on variations in speech signals, RTDF technology is utilized to differentiate between normal and asthmatic conditions. Asthma suppression may be avoided with the use of RTDF technology, which incorporates a range of functional Differential Evolutionary Neural Network (DENN) classifiers that are superior to the conventional SVM classifiers. Previously, multiple speech processing approaches are used to extract the deep features such as wavelet transforms. But, the computational complexity of the existing methods is increasing as the number of features are increases. Thus, this article introducing the novel bio-optimization approaches for extracting the features with low computational complexity and to overcome the state of art problems. Bio-inspired optimization refers to a wide range of computational methodologies based on biological system concepts. This supports the use of biology in optimization issues. Natural computation includes a significant subset of biologically inspired computation and optimization. Model complexity measures the amount of data a machine learning model needs to view in order to generate accurate predictions as well as how well it can predict previously unknown data. Then, speech samples are applied to the KHO based multi-level feature extraction method, which extracts the inter dependent and detailed features from the preprocessed signal.
One of the most recent heuristic optimization techniques is the Krill herd (KH) algorithm. This algorithm simulates the ocean krill lifecycle. Despite KH’s great performance, difficulties in solving difficult optimization problems are likely to arise from local optima stagnation and slowdown convergence. This method is also regarded as a bio-inspired heuristic optimization tool since it replicates the behavior of individual krill in krill heads. Additionally, the KH algorithm incorporates evolutionary operators including crossover and mutation. The chaotic systems are non-linear dynamical systems as well, making them extremely sensitive to their initial circumstances. Three chaotic maps, including circle, sine, and sinusoidal, are selected to improve the performance of the KH algorithm. Further, COKHO is used to extract the best features over each sample with pitch spectral properties. Then, there existed millions of speech properties, so it is difficult to perform training and testing operations with the huge feature set. Larger test datasets provide more accurate model performance computation. Using sample methods like stratified sampling, it is possible to train on smaller datasets. It will accelerate training and improve the reliability of the outcomes. Finally, the optimal features are applied to the HDQNN based training operation, which trains the optimal feature based neural network using multiple convolutions based hidden layers. But all the deep learning models are suffering with the higher training loss as number of epochs are increased. The neural network’s weights are modified more frequently as the number of epochs increases, and the curve shifts from underfitting to optimum to overfitting. The performance of the deep learning models also reducing as the loss levels are increased. A deep learning system can reach perfect performance if it concentrates on processes like data optimization, algorithm optimization, and hyperparameter optimization. So, this work presented another bio-optimization approach named as COKHO to optimize the loss values. The process will be repeated only few times and losses generated in the deep learning model is effectively reduced. Finally, the performance was significantly improved as compared to the existing approaches.
3.1 Feature Extraction Using KHO
Features are the statistical properties of the speech signal, which are used to classify the different types of asthma. But the conventional methods are extracting the low-level features by using basic signal processing methods. Due to the ambiguity of useful features in emotion detection and voice variety, feature extraction may be considered as the most crucial component of the SER. The vocal tract’s output, which is activated by the source signal, generates the speech signal. Further, the conventional systems need additional feature selection methods, which is a computationally complex. Chi-square test, Fisher’s score, correlation coefficient, and dispersion ratio are examples of the feature selection techniques used to select the most appropriate variables. Additionally, it may be utilized for feature selection by assessing each variable’s information gain in relation to the target variable. Thus, this article introducing a novel searching procedure named as KHO to search the features over unique space. Figure 2 shows the proposed KHO search procedure. KHO is an advanced bio-optimization approaches, which converts the speech’s signal into textual data. Then, the best features are extracted from the textual data. The authors used two adaptable genetic operators in the suggested KHO approach. With its unique methodology, the Krill herd algorithm is recognized for effectively tackling a wide range of optimization problems. This algorithm’s concept is based on simulating krill swarm herding in response to a certain biological, environmental event. Feature engineering is the process of choosing and modifying variables while building a machine learning prediction model. Because it involves identifying similarities, highlighting important data, and bringing in a specific topic expert, it’s an effective method for improving prediction models. For feature extraction in pitch spectral characteristics, a number of methods are utilized, namely Mel Frequency Cepstral Coefficients (MFCC), Linear Prediction Coefficients (LPC), Line Spectral Frequencies (LSF), Discrete Wavelet Transform (DWT), and Perceptual Linear Prediction (PLP). The position of a single krill on a two-dimensional surface is determined by three primary actions, which are as follows:
• Individual krill motion is triggered by other krill.
• Foraging action.
• Diffusion at Random.
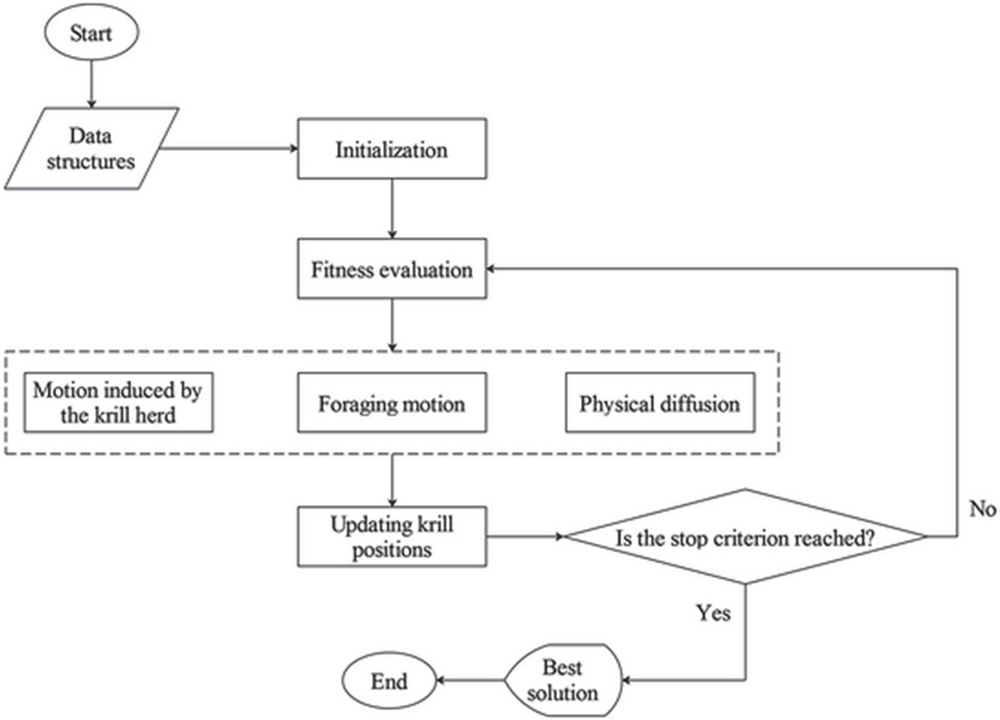
Figure 2 Flowchart of KHO.
The flexibility of the KH method is a key benefit, making it simple to implement and conducive to parallel processing. In order to accelerate KH’s convergence, chaotic KH-based (CKH) methods are discussed. The parameters used in KH are replaced by a variety of one-dimensional chaotic maps.
Motion induced by separate krill individuals: The direction of motion is approximated by the target swarm density (target effect), a local swarm density (local impact), and a repulsive swarm density (repulsive force). This movement can be described as follows in the case of a krill individual:
| (1) | ||
| (2) | ||
| (3) | ||
| (4) | ||
| (5) | ||
| (6) |
Here the maximum generated motion is expressed as . Here, is the result of the generated motion of the krill at the movement and is the result of the generated motion of the kth krill at the movement; The inertia weight of the motion is ; The effect is localised , and the target effect is . is the worst possible situation, and is the most advantageous position among all krills in the population; Fk is the value of fitness individuals and is the optimum value of persons; the current number of iterations is q and the maximum number of iterations is . A sensing distance Each krill individual’s neighbours are identified using this method. If the sensing distance between two individual krills is greater than the distance between them, that krill is regarded a neighbour of the other. The detection range krill can be defined by:
| (7) |
where , and the number of the population, and the location of the population and krill, respectively.
Foraging action: The foraging action is influenced by historical Q-Layer of the food location as well as the current food location. The ith krill individual’s foraging motion is represented by:
| (8) | ||
| (9) |
Here, and are the foraging motion and inertia weight of the krill at and respectively, movement.
Random diffusion: This procedure can increase the variety in the population of the jth krill, which can be stated numerically as:
| (10) |
where and are the foraging motion and inertia weight of the krill at and movement, respectively; Mmax d and Rd. the largest and lowest diffusion motions, respectively, can be found in the range (1,1).
Position update: Finally, the krill changes its position from t to which can be written as:
Finally, krill update its position from t to (t t) which may be represented by:
| (11) | ||
| (12) |
Genetic operators: A genetic algorithm’s ability to address issues that are challenging or impossible to solve using conventional techniques is one benefit of implementing it. Genetic algorithms also offer the benefit of being able to address problems that have a variety of objectives or restrictions. The traditional DE algorithm motivates the inclusion of adaptive genetic reproduction mechanisms such as crossover and mutation. The two surgeries are described as follows:
Crossover: Each krill interacts with others to maintain its position for the components of the krill, which can be described as:
| (13) |
Mutation: The vectors generated by two other random vectors and as shown in the following equation:
| (14) |
Here, and can be used to represent , respectively.
| (15) |
3.2 Classification Using HDQNN
The deep learning mechanisms are resulted in best performance in the field of medical applications due to their swarm intelligence properties. Swarm intelligence improved the utilization of machinery such that it was not utilized for fast activities if the changeover time for a machine component was less than an hour. The program was not concerned with getting goods from one location to another in the smallest amount of time, but with completing a series of tasks in the lowest amount of time. Figure 3 presents the proposed deep learning architecture, which contains the multiple number of convolution layers, rectified linear unit (ReLU) activation function, Recurrent dense layers and SoftMax classifier.
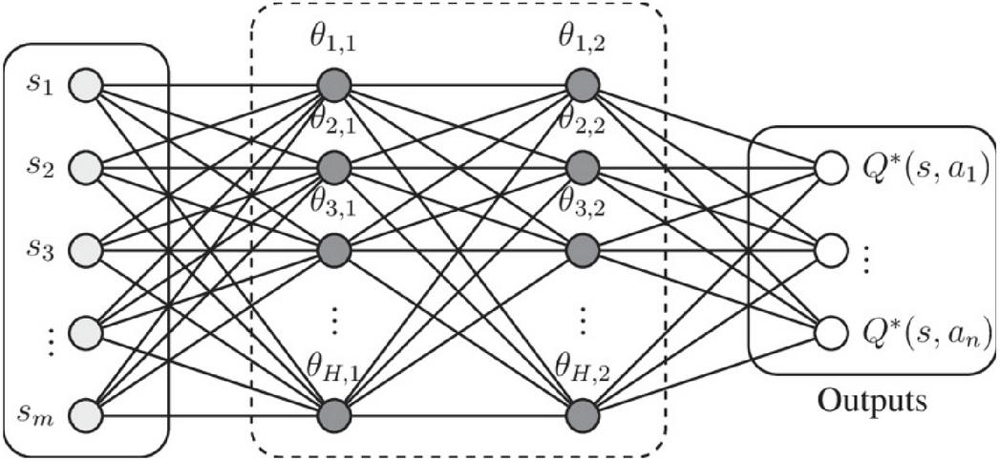
Figure 3 HDQNN architecture.
Q-Layer Refinement: The Q-Layer from a complex model to a small model can be transferred through a technique called refinement. Refinement is a technology that transfers Q-Layer from a complex model to a small model accordingly. This work has developed the framework of Q-Layer filtering, the logics vector formed by the sub-network network for an input optimal feature is denoted by , where the vector dimension ] is the quantity of categories D. The SoftMax layer change the logics vector to a probability distribution .
| (16) | ||
| (17) |
Then, the higher network provides the logics vector for an input optimal feature is represented by , where the vector dimension is the quantity of categories D. By introducing temperature t, the generalized layer change the logics vector to soft probability distribution
| (18) | ||
| (19) |
The higher model created the refinement class probability as “soft labels”, which is used to create the sub-network model. Soft labels are produced using characteristics collected from data instances, and a single layer perceptron (SLP) network termed MetaLabelNet learns the mapping function. The base classifier is then trained using these newly established soft-labels. For every collection of training data, these iterations are repeated. Training a sub-network model consists of two objective steps. The first objective function minimize the cross entropy with the soft labels and the sub-network model provided the soft probability . Are computed by with the same temperature t as the higher model,
| (20) |
Here
| (21) |
The first objective function is
Here, is the probability produced by the sub-network that the optimal features belong to the class, the higher will produce the soft label as , is the sub-network’s weight, is the number of training optimal features, and D is the total class quantity. The second objective function minimizes the hard labels of cross entropy with x-true and the sub-network provide the probability .
Here, is the probability of i-th optimal features belongs to the class provide by the sub-network, is the information of hard label, and while the optimal features belongs to the class, other than that where L is the sub-network’s weight, m is the training optimal features quantity, D is the total classes count. The overall objective function W is weighted average of two different objective functions.
| (24) |
where L indicates the sub-network’s weight and is a relative weight.
During source multi-higher filtering, this work teaches diverse Q-Layer to multiple higher to increase accuracy and add a variety of records. A soft label is the average weight of a smooth probability distribution that varies according to the author. For the higher T1, T2 and T3 produce soft probability distributions, also produce and with FSOFTMAX layer and the same temperature remains. The soft label is a weighted average of , , and :
| (25) |
Where, , and are weighted by 1, 2 and 3, respectively. Temporary network that accepts the input of operating vector and the rest are smaller model in HDQNN series, they can transfer more comprehensive refinement Q-Layer. The filter system is similar to a given motion vector or the remaining three higher.
3.3 Feature Selection and Loss Optimization Using COKHO Algorithm
All the deep learning models are suffering with the high training and testing loss, which needs to be improved. This this work adopted the COKHO algorithm approach for reducing the losses. Further, COKHO also used to select the best features as shown in Figure 4. The population is randomly initialized in an evolutionary method, and the population always tries to find the best solution. Although the oppositional krill herd is effective in solving the LFC problem, it is unable to identify the global optimal solution due to its poor convergence speed. COKHO is developed in this paper to mitigate this effect by combining chaos behavior with the KHO algorithm. Chaos’s unpredictable and non-repeating character causes overall searches to run at higher speeds, which can help the recommended meta-heuristic approach converge faster.
Opposition based population initialization: The entire evolutionary process is modified based on jumping rate by implementing opposite points. Following the induction, foraging action, and random diffusion processes of KHO, OBL generates a new set of opposition based chaotic population and chaotic equation supplied in the chaotic map (N5).
• Create a random variable for the population set.
• Set the chaotic map’s initial value (N5) to a random number, and inertia weights n, x.
• Calculate each krill’s fitness based on the number of krills it started with
• Using a chaotic map, update the inertia weight (sl no N5). Carry out the motion calculation below.
• Foraging motion, Physical diffusion and updation of krill individuals
• Merge population and opposite population sets as:
| (26) |
Where a 1,2…MQ & a 1,2,3…m and Ps,t signifies the population and the population opposite it for sth variable of the rth vector.
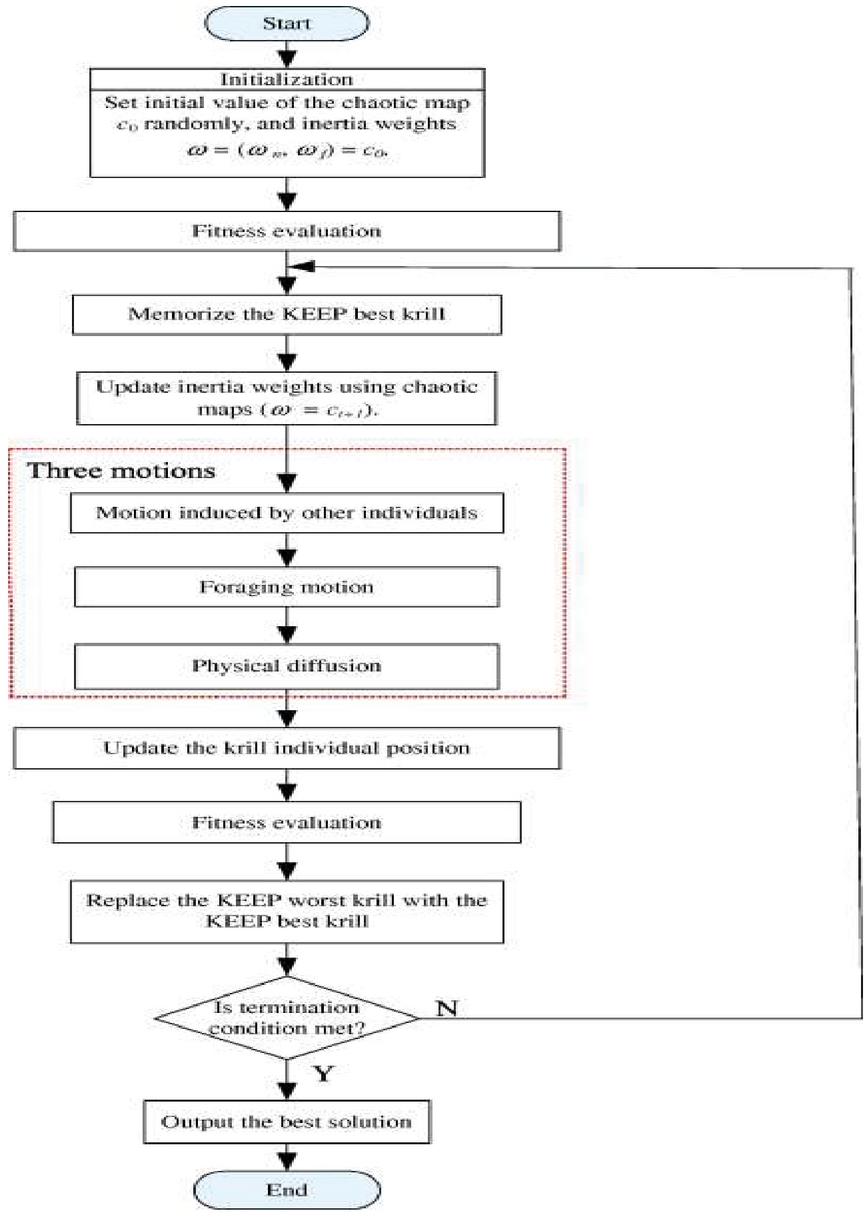
Figure 4 COKHO flowchart.
Chaotic algorithm: A computational process for generation leaping based on opposition is developed.
1. if (rand JQ) wher e ranc1 [0,1], PQ is Jumping rate
for q = 1: NQ
for q = 1: m
| (27) |
end for
end for
2. Select Nq fittest individuals from set of ().
4 Result and Discussion
This section gives the detailed simulation analysis of proposed model using python simulations on real-time datasets. Python’s compact syntax and open-source nature enhance program readability and implementation, projected to be the fastest programming language nowadays. Python offers a number of additional benefits that set it aside from other well-known programming languages like Java and C. The performance of proposed method is compared with several state of art approaches for accuracy, precision, sensitivity, specificity, F1-score, and Recall metrics.
4.1 Database Description
The coswara dataset is a scientific challenge conducted by the International Conference on Biomedical and Health Informatics. It includes a respiratory sound database as well as an approved grading procedure. This database contains a total of 5.5-hour recordings with annotated respiratory cycles from 126 people, which totals 5.5 hours in length. For the sake of simplicity, a record is defined as the collection of lung sounds from a single patient, and a cycle is defined as a single breathing cycle from a single patient. As a result, the overall recording includes 6,898 cycles, of which 3,642 are “normal,” 1864 are “crackles,” 886 are “wheezes,” and 506 are “crackle plus wheeze.” The system is trained with 80% of overall samples and tested with 20% of overall samples. Initially, the individual disease type performances are measured by selecting the known disease type speech sample. Further, randomly chosen speech samples are considered to measure the overall performance. The proposed HDQNN-Net defines the ranges for each class of classification by choosing the probability-based features. Table 2 presents the various probability levels used for separation each class in HDQNN-Net model. Here, the HDQNN -Net assigns the highest probability to Normal class as 0 to 0.4, then 0.41 to 0.1 probability range is assigned to Stridor/Crackles class, respectively.
Table 2 Threshold levels of diseases detection probabilities
| Class | Normal | Stridor/Crackles |
| Threshold values | 0 to 0.4 | 0.41 to 1.0 |
4.2 Performance Evaluation
This section compares the performance of proposed method based on different feature extraction, feature selection and classification approaches. Table 3 show that proposed HDQNN-Net framework resulted in better performance for all diseases as compared to the existing approaches such as BiLSTMs [17], VGG19 [18], TSBEL [21] and SVM-LOO [22]. The proposed method resulted in better performance as it optimizes the losses. For the two diseases, proposed method resulted in superior performance as it is extracting best features.
Table 3 Performance comparison of multiple classes of asthma for various methods
| Asthma Type | Classifier | Accuracy | Specificity | Sensitivity | Recall | Precision | F1_Score |
| Voice samples-5 | BiLSTMs [17] | 89.38 | 87.38 | 85.38 | 90.28 | 88.93 | 89.84 |
| (Normal) | VGG19 [18] | 90.49 | 90.88 | 91.78 | 91.70 | 89.79 | 90.42 |
| TSBEL [21] | 92.96 | 91.81 | 92.85 | 92.48 | 91.33 | 91.11 | |
| SVM-LOO [22] | 94.20 | 93.33 | 93.86 | 93.59 | 92.99 | 93.32 | |
| HDQNN-Net | 95.92 | 96.38 | 96.35 | 95.42 | 95.13 | 95.98 | |
| Voice samples-5 | BiLSTMs [17] | 80.37 | 89.38 | 85.37 | 85.73 | 89.74 | 87.62 |
| (Stridor) | VGG19 [18] | 91.05 | 89.08 | 90.72 | 89.20 | 90.25 | 90.99 |
| TSBEL [21] | 93.27 | 90.18 | 93.61 | 90.20 | 93.00 | 91.02 | |
| SVM-LOO [22] | 93.29 | 94.29 | 92.79 | 92.80 | 93.35 | 91.97 | |
| HDQNN-Net | 94.98 | 95.56 | 94.16 | 94.56 | 95.02 | 94.96 |
Figure 5 represents the graphical representation of performance comparison of accuracy metric. During normal type of asthma detection, the HDQNN-Net improved maximum accuracy by 7.746% compared to VGG19 [18] model. During asthma detection, the HDQNN-Net improved precision by 12.237% compared to SVM-LOO [22] model.
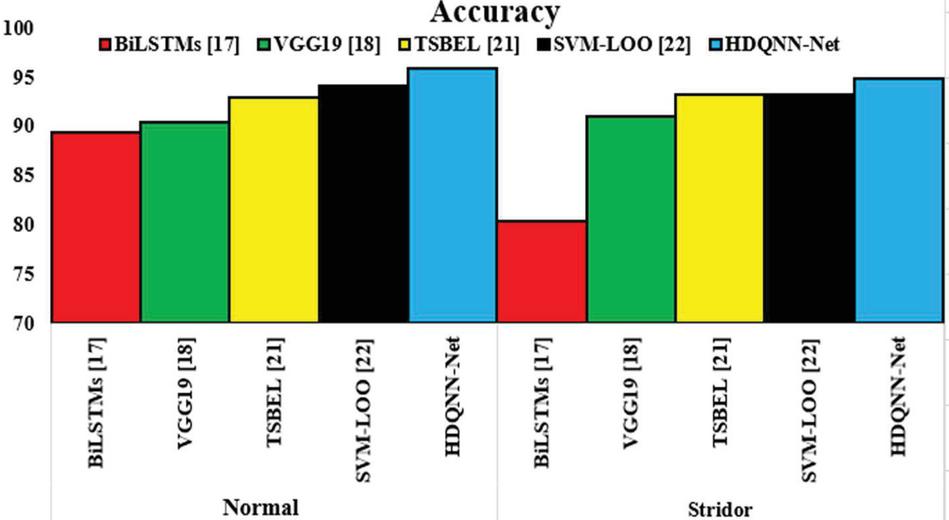
Figure 5 Graphical representation of accuracy performance comparison.

Figure 6 Graphical representation of specificity performance comparison.

Figure 7 Graphical representation of sensitivity performance comparison.
Figure 6 represents the graphical representation of performance comparison of specificity metric. During normal type of asthma detection, the HDQNN-Net improved maximum specificity by 6.477% compared to VGG19 [18] model. During asthma detection, the HDQNN-Net improved specificity by 11.746% compared to SVM-LOO [22] model. Figure 7 represents the graphical representation of performance comparison of sensitivity metric. During normal type of asthma detection, the HDQNN-Net improved maximum sensitivity by 10.71% compared to VGG19 [18] model. During asthma detection, the HDQNN-Net improved sensitivity by 08.46% compared to SVM-LOO [22] model.
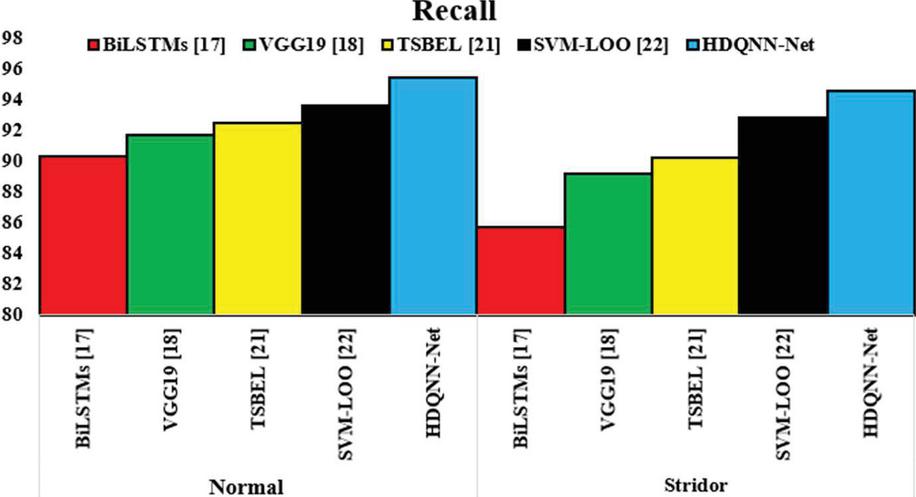
Figure 8 Graphical representation of recall performance comparison.
Figure 8 represents the graphical representation of performance comparison of recall metric. During normal type of asthma detection, the HDQNN-Net improved maximum recall by 12.872% compared to VGG19 [18] model. During asthma detection, the HDQNN-Net improved recall by 8.416% compared to SVM-LOO [22] model.

Figure 9 Graphical representation of precision performance comparison.
Figure 9 represents the graphical representation of performance comparison of precision metric. During normal type of asthma detection, the HDQNN-Net improved maximum precision by 6.12% compared to VGG19 [18] model. During asthma detection, the HDQNN-Net improved precision by 6.16% compared to SVM-LOO [22] model.
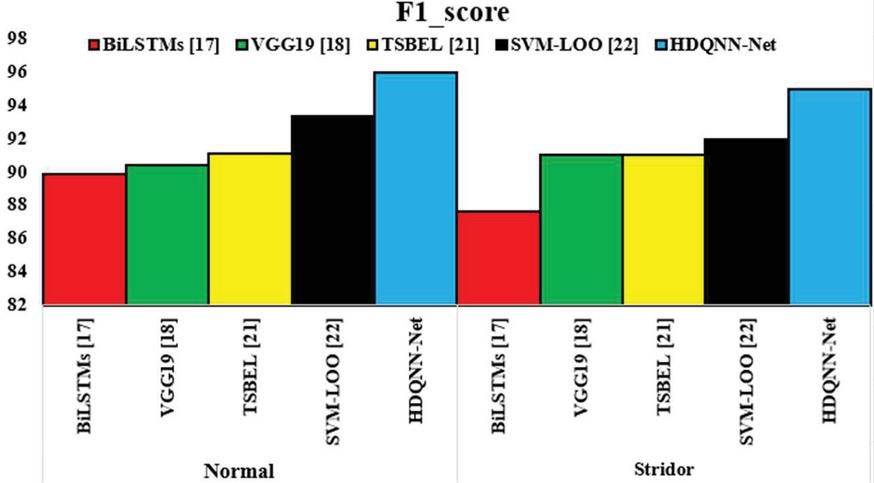
Figure 10 Graphical representation of F1-score performance comparison.
Figure 10 represents the graphical representation of performance comparison of F1-score metric. During normal type of asthma detection, the HDQNN-Net improved maximum F1-score by 4.23% compared to VGG19 [18] model. During asthma detection, the HDQNN-Net improved F1-score by 3.38% compared to SVM-LOO [22] model. Further, the performance of randomly selected voice samples is presented in Table 4, which shows the effectiveness of HDQNN-Net method. Table 4 shows the performance comparison of proposed method with existing classifiers such as BiLSTMs [17], VGG19 [18], TSBEL [21] and SVM-LOO [22]. The proposed method extracted the unique features, so it resulted in superior performance. Further, the graphical representation of Table 4 is presented in Figure 9.
Table 4 Performance comparison of classification methods using random samples
| Method | Accuracy | Specificity | Sensitivity | Precision | Recall | F1-Score |
| BiLSTMs [17] | 90.80 | 89.06 | 91.30 | 84.30 | 90.30 | 87.30 |
| VGG19 [18] | 84.80 | 81.70 | 81.38 | 81.40 | 81.70 | 81.40 |
| TSBEL [21] | 93.67 | 92.67 | 93.15 | 87.91 | 92.91 | 92.91 |
| SVM-LOO [22] | 94.50 | 90.00 | 92.67 | 94.60 | 93.81 | 94.91 |
| HDQNN-Net | 95.82 | 96.01 | 96.13 | 95.46 | 95.03 | 95.36 |
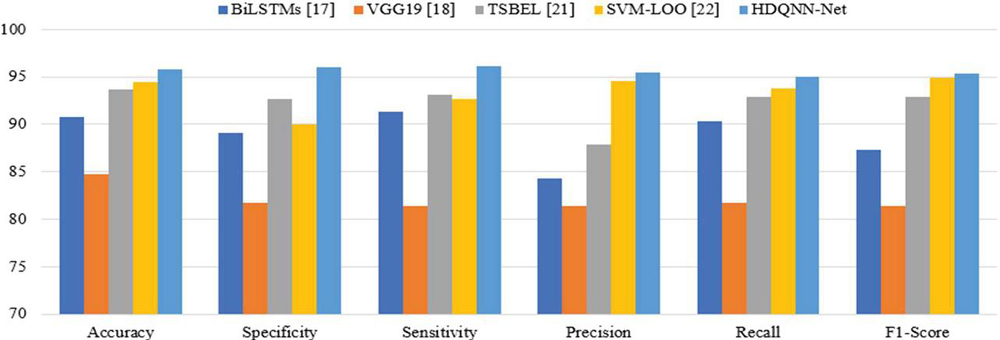
Figure 11 Graphical representation of performance comparison.
5 Conclusion
There is currently no effective strategy available in clinical practice for the management of chronic respiratory disorders that enables patients and their careers to continuously assess the severity of respiratory symptoms. When you have asthma, your respiratory system produces what is known as “asthma breath.” This study offers a deep learning HDQNN-Net-based approach for detecting asthma illness from speech signals that is both accurate and fast. It is the KHO algorithm that is utilized for feature extraction in the HDQNN-Net approach. Then, COKHO algorithm is used for the feature grouping and selection procedure. Then, HDQNN is trained and used to determine if the dispersed signal pattern matches the frequency of normal and abnormal breathing speeches using the COKHO characteristics. The HDQNN classifier was used to distinguish between asthma, crackling, and regular speech in this instance. Comparing the suggested technique to the state-of-the-art methods, the simulation results demonstrate that the new method outperforms the existing approaches. However, this method is suffering with binary asthma classification problem i.e., asthma and Stridor classes. Thus, this work can be extended with multiple sub-types asthma classification.
Declarations
Funding
No funds, grants were received by any of the authors.
Conflict of interest
There is no conflict of interest among the authors.
Data Availability
All data generated or analysed during this study are included in the manuscript.
Code Availability
Not applicable.
Author’s contributions
All author is contributed to the design and methodology of this study, the assessment of the outcomes and the writing of the manuscript.
References
[1] Gayathri, G. V., and S. C. Satapathy. “A Survey on techniques for prediction of asthma.” Smart Intelligent Computing and Applications. Springer, Singapore, 2020. 751–758.
[2] Akbar, Wasif, et al. “Predictive Analytics Model Based on Multiclass Classification for Asthma Severity by Using Random Forest Algorithm.” 2020 International Conference on Electrical, Communication, and Computer Engineering (ICECCE). IEEE, 2020.
[3] Ullah, Rahat, et al. “A comparative study of machine learning classifiers for risk prediction of asthma disease.” Photodiagnosis and photodynamic therapy 28 (2019): 292–296.
[4] Mozaffarinya, M., et al. “A data-mining algorithm to assess key factors in asthma diagnosis.” Revue Française d’Allergologie 59.7 (2019): 487–492.
[5] Pooja, M. R., and M. P. Pushpalatha. “A predictive framework for the assessment of asthma control level.” Int J Engs Adv Technol 8 (2019): 239–245.
[6] Harvey, Julie L., and Sathish AP Kumar. “Machine Learning for Predicting Development of Asthma in Children.” 2019 IEEE Symposium Series on Computational Intelligence (SSCI). IEEE, 2019.
[7] Gaudillo, Joverlyn, et al. “Machine learning approach to single nucleotide polymorphism-based asthma prediction.” PloS one 14.12 (2019): e0225574.
[8] Silveira, Arthur, Cristian Muñoz, and Leonardo Mendoza. “Severe asthma exacerbations prediction using neural networks.” International Conference on Engineering Applications of Neural Networks. Springer, Cham, 2019.
[9] Di Caprio, Debora, et al. “A novel ant colony algorithm for solving shortest path problems with fuzzy arc weights.” Alexandria Engineering Journal (2021).
[10] Phan, Dinh-Van, et al. “Deep learning approaches for sleep disorder prediction in an asthma cohort.” Journal of Asthma 58.7 (2021): 903–911.
[11] Wang, Xiao, et al. “Deep Learning Models to Predict Pediatric Asthma Emergency Department Visits.” arXiv preprint arXiv:1907.11195 (2019).
[12] Exarchos, Konstantinos P., et al. “Artificial intelligence techniques in asthma: a systematic review and critical appraisal of the existing literature.” European Respiratory Journal 56.3 (2020).
[13] Kaplan, Alan, et al. “Artificial intelligence/machine learning in respiratory medicine and potential role in asthma and COPD diagnosis.” The Journal of Allergy and Clinical Immunology: In Practice (2021).
[14] Bhat, Gautam S., et al. “Machine learning-based asthma risk prediction using IoT and smartphone applications.” IEEE Access 9 (2021): 118708–118715.
[15] Kumar, Ajay, et al. “Towards cough sound analysis using the Internet of things and deep learning for pulmonary disease prediction.” Transactions on emerging telecommunications technologies (2020): e4184.
[16] Balamurali, B. T., et al. “Deep Neural Network-Based Respiratory Pathology Classification Using Cough Sounds.” Sensors 21.16 (2021): 5555.
[17] AlSaad, Rawan, et al. “Interpreting Patient-Specific risk prediction using contextual decomposition of BiLSTMs: application to children with asthma.” BMC medical informatics and decision making 19.1 (2019): 1–11.
[18] Kim, Yoonjoo, et al. “Respiratory sound classification for crackles, wheezes, and rhonchi in the clinical field using deep learning.” Scientific Reports 11.1 (2021): 1–11.
[19] Tong, Yao, Amanda I. Messinger, and Gang Luo. “Testing the generalizability of an automated method for explaining machine learning predictions on asthma patients’ asthma hospital visits to an academic healthcare system.” IEEE Access 8 (2020): 195971–195979.
[20] Yahyaoui, Amani, and Nejat Yumuşak. “Deep And Machine Learning Towards Pneumonia And Asthma Detection.” 2021 International Conference on Innovation and Intelligence for Informatics, Computing, and Technologies (3ICT). IEEE, 2021.
[21] Khasha, Roghaye, Mohammad Mehdi Sepehri, and Nasrin Taherkhani. “Detecting asthma control level using feature-based time series classification.” Applied Soft Computing 111 (2021): 107694.
[22] Singh, Om Prakash, Ramaswamy Palaniappan, and M. B. Malarvili. “Automatic quantitative analysis of human respired carbon dioxide waveform for asthma and non-asthma classification using support vector machine.” IEEE Access 6 (2018): 55245–55256.
[23] Altan, Gökhan, et al. “The diagnosis of asthma using Hilbert-Huang transform and deep learning on lung sounds.” arXiv preprint arXiv:2101.08288 (2021).
[24] Nabi, Fizza Ghulam, et al. “Characterization and classification of asthmatic wheeze sounds according to severity level using spectral integrated features.” Computers in biology and medicine 104 (2019): 52–61.
[25] Wu, Wei. “Predicting atopic asthma by using eNose breath profiles with machine learning.” Journal of Allergy and Clinical Immunology 146.5 (2020): 1010.
[26] Khan, Misha Urooj, et al. “Embedded System Design for Real-time Detection of Asthmatic Diseases Using Lung Sounds in Cepstral Domain.” 6th International Electrical Engineering Conference (IEEC 2021) April, 2021 at NEDUET. 2021.
[27] Aroud, Rawabi A., Anas H. Blasi, and Mohammed A. Alsuwaiket. “Intelligent Risk Alarm for Asthma Patients using Artificial Neural Networks.” arXiv preprint arXiv:2009.12175 (2020).
[28] Sivaparthipan, C. B., et al. “Blockchain Assisted Disease Identification of COVID-19 Patients with the Help of IDA-DNN Classifier.” Wireless Personal Communications 126(3), 2597–2620 (2022).
[29] Muthu, BalaAnand, et al. “IOT based wearable sensor for diseases prediction and symptom analysis in healthcare sector.” Peer-to-peer networking and applications, 13(6), 2123–2134 (2020).
[30] Hosseini, Seyed Ahmad, et al. “Neural Network–Based Clinical Prediction System for Identifying the Clinical Effects of Saffron (Crocus sativus L) Supplement Therapy on Allergic Asthma: Model Evaluation Study.” JMIR Medical Informatics 8.7 (2020): e17580.
[31] Kontogianni, Konstantina, et al. “COPD and Asthma Differentiation using Quantitative CT Biomarkers by Hybrid Feature Selection and Machine Learning.” (2021).
[32] Di Caprio, Debora, et al. “A novel ant colony algorithm for solving shortest path problems with fuzzy arc weights.” Alexandria Engineering Journal (2021).
Biographies

Md. Asim Iqbal received his M.Tech degree from the JNTU Hyderabad and pursuing Ph.D in Annamalai University. In 2013 he was appointed as Assistant Professor at KUCE&T, Kakatiya University. The author has over 24 international Journals, 4 National Conferences, and 1 book. His research interests include Speech Processing, Embedded Systems, and Wireless Networks. He is an active member of The Indian Society for Technical Education (ISTE), IETE and Institution of Engineers (India) (IEI). He received two prestigious awards like IEI Young Engineers award in the year 2021 and Bharat Vikas award in the year 2018.

K. Devarajan received his M.E and Ph.D degree from the Annamalai University. In 2006 he was appointed as Assistant Professor at Annamalai University. The author has over 40 international Journals, 11 International, 2 National conference and 2 books. His research interests include Wireless Communication Networks and Security Management, Antenna Design. He is an active member of the International Association of Engineers (IAENG), Institute of Research Engineers and Doctors (IRED) and The Indian Society for Technical Education (ISTE) societies.

Syed Musthak Ahmed, perused his BE, and ME in Electronics from Bangalore University, Bangalore and Ph.D. from Vinayaka Mission’s University, Tamil Nadu. He has around 35 years of teaching experience, teaching UG, PG and guiding Research Scholars. Four Scholars perused Ph.D. under him and presently guiding 3 scholars of home University other Universities. He served at various capacities as Professor and Head of department, Dean of Academics, Dean of Students Affairs and presently working as Professor and Dean of Students welfare at SR University, Warangal, Telangana has published around 120+ papers at various National and International Conferences/Journals. He has completed a Sponsored research project under Department of Science and Technology, Govt. of India. He is life member of ISTE, IETE, SMIEEE, MIAENG and MIAMT. He served the IEEE professional society, IEEE Hyderabad Section at various capacities as Section Executive Member, Students Activities Chair, Mentor Young Professionals, Chair and Vice Chair of Education Society and presently nominated as Chair Education Society.
Journal of Mobile Multimedia, Vol. 19_6, 1553–1582.
doi: 10.13052/jmm1550-4646.1969
© 2023 River Publishers