Spatial Predictive Modeling of Power Outages Resulting from Distribution Equipment Failure: A Case of Thailand
Thanaporn Thitisawat, Supaporn Kiattisin* and Smitti Darakorn Na Ayuthaya
IT Management, Faculty of Engineering, Mahidol University, Nakhon Pathom 73170, Thailand
E-mail: thanaporn.ths@student.mahidol.ac.th; supaporn.kit@mahidol.ac.th; smitti.dar@mahidol.ac.th
*Corresponding Author
Received 31 January 2023; Accepted 14 April 2023; Publication 11 August 2023
Abstract
This research develops a location-based predictive model for distribution equipment failure for use in preventative maintenance scheduling and planning. This study focuses on equipment-related failures because they are one of the main causes of outages in Thailand. Geographic Information Systems (GIS) data was integrated with asset data to predict the equipment failure of distribution equipment. Data on assets and outages from the Provincial Electricity Authority (PEA) was merged with GIS data from multiple sources, including elevation data, weather data, natural landmarks, and points of interest (POIs). Data was split into four regional datasets, and Random Forests (RF) feature selection and structural equation modeling was used to identify and confirm the most important features in each region. Logistic regression and RF regression were then used to estimate failures. RF regression was more effective than logistic regression at estimating equipment failure. The asset age and electrical load were significant predictors of outages. There were also geographic features that were significant predictors in each region, but which features affected outages varied by region. Thus, the study concluded that the approach developed could be used in preventative maintenance planning with some modification for regional characteristics, including geographic location and patterns of urbanization and industrialization.
Keywords: Power outages, spatial predictive modeling, reliable electric distribution. geographic information system (GIS), electricity preventive maintenance, machine learning, spatial data analytic, geospatial artificial intelligence.
1 Introduction
A reliable electricity supply is the foundation of modern life, enabling domestic safety and well-being, community economic and social activities, and large-scale industry [1]. Reliable electricity supplies enable poverty reduction, economic growth and development, and positive health outcomes around the world [2]. On the other hand, unreliable electricity supply both stymies economic growth and development and can have a negative impact on the environment as people turn to higher-pollution sources of energy [3]. The economic impact can be particularly high in developing countries. Although these losses have not been estimated for Thailand, an estimate for South Africa suggested that transmission and distribution losses (including outages) depressed economic growth from a potential 3.79% to an actual 2.25% between 1971 and 2014 [4]. Therefore, ensuring a reliable electricity supply is critical at both the local and national level, particularly in developing countries where there may not yet be adequate infrastructure and supply [3, 4].
Electricity reliability can be assessed using metrics like the System Average Interruption Duration Index (SAIDI) and System Average Interruption Frequency Index (SAIFI) [5]. In general, these measures are lower for more developed countries (with more resources to improve and support reliable electricity grids) [6]. Thailand is classified as an upper middle income developing countries [7], and it has a relatively high level of both access and reliability. More than 99% of Thailand population has access to electricity, with the few remaining supply shortages being remote mountain communities [8]. The most recently reported SAIDI (0.38) and SAIFI (0.78) indices show that Thailand’s electricity grid is in general relatively highly reliable [9]. In fact, Thailand’s electricity grid is amongst the most reliable in the Asia Pacific region [10].
Despite this overall high level of reliability, there are still shortages and outages occur that do affect Thailand’s power supply. These outages are frequently associated with equipment failures related to aging infrastructure and deferred grid maintenance [11, 12]. In global studies, electrical faults and other equipment failures have been associated with a significant proportion of unplanned outages. One of these studies estimated that 32% of unplanned outages were due to equipment failure [13], while a second study estimated an even higher rate of 51.1% [14]. Thus, by improving the preventative maintenance program [15] of Thailand’s grid operators to target equipment before it fails, Thailand’s electricity supply could become even more reliable. Even though Thailand is not yet equipped with a full smart grid [16], but there is a base of asset data that can be used to estimate failures. Geographic Information Systems (GIS) can also be used to provide locations, weather, and other spatial data for electrical distribution sites [17]. This data can be used to develop model for specific risks and predict the environmental stresses that equipment will undergo.
2 Literature Review
2.1 Power Outages
A power outage refers to the disruption of electrical supply to end users, whether planned or unplanned [18]. Power outages can occur at any point in the electricity grid (generation, transmission, distribution and control) [19, 20]. Power outages can be independent (occurring due to localized failure of a single component), common mode dependent (with one failure causing others), or cascading [19, 21]. The most commonly identified causes of power outages include weather conditions (especially storms), equipment failure, and environmental conditions such as vegetation [18, 22, 23]. Voltage instability can also cause large-scale outages, which can be particularly impactful in urban areas [24]. In some places, vandalism, such as pipeline vandalism or power line theft, can also play a role in localized outages, although this tends to occur in areas that are very economically precarious [25]. This study focuses on equipment failure in the distribution system, which commonly occurs due to problems like crossed or broken wires, tripped circuit breakers, and/or fuse and transformer failures among others [18, 26], because it is a common problem both in Thailand and around the world.
2.2 Preventative Maintenance
Preventative maintenance refers to the practice of maintaining and/or replacing equipment in order to reduce or prevent unexpected failure [27]. There are several different ways to coordinate planned maintenance, including using a time-based approach such as scheduled maintenance [27], using sensors or other data to monitor equipment and conduct maintenance as it undergoes signs of wear [28], or based on probabilistic risk of failure [29]. In a fully established smart grid, it is possible to use sensor data to monitor the distribution network and identify components at risk of failure [13]. However, as Thailand does not yet have a fully established smart grid, this study employs a risk-based model of preventative maintenance.
2.3 Geographic Information System (GIS) and Predicting Power Outages
A Geographic Information System (GIS) is “a computer system for capturing, storing, querying, analyzing, and displaying geospatial data [30]”, or in other words data about the geographic attributes of specific locations. Geospatial data include locations (using standard coordinate systems), geographical features, point of interest, and information about the location such as vegetation or ground cover, water, and other features [30]. GIS can also be integrated with other sources of data, such as energy asset data (or data about specific pieces of equipment) [17, 31]. GIS is one source of data that can be used in big data-driven techniques for energy management [31]. These techniques are considered here, through investigation of how other authors have approached the use of GIS and asset data to predict outages and equipment failures previously.
Previous authors have used a variety of approaches to predicting power outages, including fuzzy logic applications for predicting storm-related outages [32], a time series approach [14], and cross-sectional techniques [26]. These studies identified a wide range of potential influences that could be associated with power outages, although there were limits to the geospatial data used within the analysis. Other authors have investigated equipment failure and subsequent power outages, using adaptations such as energy market data to estimate outage costs [33], supervised learning on datasets from energy providers and grid operators [34], and the ArcGIS Notebooks visualization tool [35]. While each of these models did have their benefits, none were a comprehensive model that included both asset and geospatial data to predict outages. Thus, the objective of this study is to develop a predictive model for power outages attributable to distribution equipment failure in Thailand using both asset data and geospatial data.
3 Materials and Methods
3.1 Research Process
The research process (Figure 1) incorporated two stages: initial feature extraction and proving, and predictive model building. The initial feature extraction is the process to identify the important features that caused the equipment failure. The process began with outage records, asset data and geospatial data, then employed a process of Spatial Feature Engineering (SFE) (Figure 2) and Feature Selection (FS) [36] to identify an initial important feature set. Following a prior study [37], Structural Equation Modeling (SEM) was then used to validate the feature set. In the second stage, the sample data was subjected to a data normalization process, and RF classification was then used iteratively to build the predictive model for equipment failure.
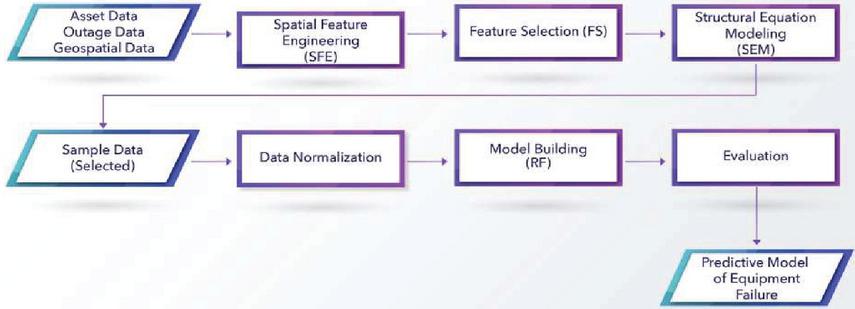
Figure 1 Process of the research.
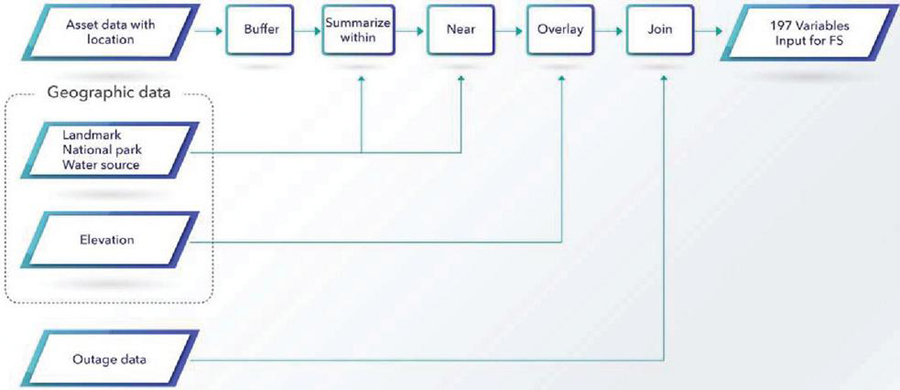
Figure 2 Spatial feature engineering (SFE) process.
3.2 Tools
There were two main tools used for the analysis process. The majority of the analysis was performed through the ArcGIS Desktop, which offers multiple tools for geospatial analysis [38]. ArcGIS Pro was used for data import and cleaning. Four tools were used for the SFE process, including Buffer (used to create specified buffers around specific points, Near (used to calculate distances between points), Summarize (used to summarize data within buffer zones), and Overlay (used to coordinate data from several layers).
The predictive model was constructed in ArcGIS Notebooks. Thus, the ArcGIS platform offered most of the functionality required for the project. However, the SEM process could not be conducted in ArcGIS, which does not offer this type of data visualization and modeling. Instead, the SPSS AMOS tool was used, as it is specifically designed for this task [39].
3.3 Data Sources and Feature Selection
Data included asset data, outage data, and geospatial data. Basic geospatial data was supplied from standard maps incorporated into the ArcGIS platform Asset data and outage data were supplied by the Provincial Electricity Authority (PEA) of Thailand, the body tasked with grid management and oversight for areas outside Thailand’s Central region. Ocean data was incorporated from the ne_10m_ocean (World Oceans, 1:10 million (2012)) data [40]. Elevation data was sourced from the NASA/SRTM 2007 dataset [41]. Finally, geographic information including landmarks, rivers, canals, national parks, and other points of interest were sourced from the NOSTRA database, which offers the highest level of geographic data coverage for Thailand [42].
Figure 3 shows the process by which the large number of potential features from the available datasets was reduced to the incorporated feature set. The initial SFE process included enrichment (overlaying multiple layers or interpolation of data from other points), geometry and context (extraction of some data, such as elevation and distance from roads, using the map geometry itself) [36, 43]. This resulted in 195 potential features. The FS process then commenced. This process used RF to identify the features that would be most effective for modeling the data itself [44]. A score was developed for each of the features, and the highest-scoring features (at least one standard deviation from mean score) were incorporated. SEM was then used to validate the model.
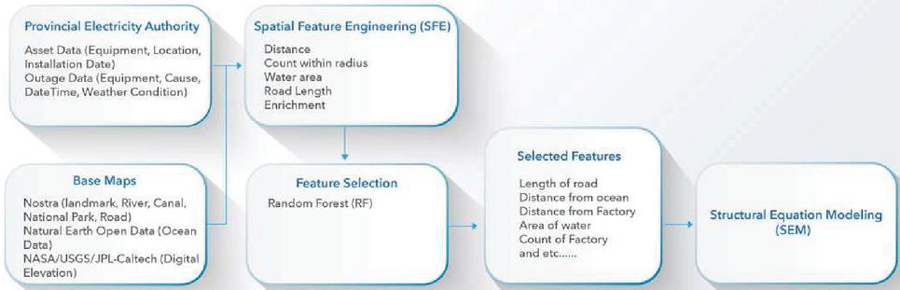
Figure 3 Features incorporated into the dataset.
3.4 Predictive Model Building
Following the SEM process, a data normalization approach [45] was used to reduce outliers. The dataset was divided into two parts, with 80% of the data randomly assigned to the training dataset and 20% to the testing dataset. A supervised learning approach was then employed [46]. The approach used was RF, a technique which performs several decision trees and then takes the average of the decision trees [44, 47]. The RF approach was selected because it can manage more complex structures compared to an approach like logistic regression [47]. The final outcome was a predictive model which estimated the failure probability of an asset at a given point of time. These results are explained in the following section.
4 Results and Discussion
4.1 Outage Data Selection and Preparation
The first step in data preparation was selection of outages from the PEA power distribution areas (Figure 4). The Outage dataset included 2,178,088 records, which related to outage events. This data represented four PEA districts, which were:
• PEA Northern Region 1 (N1)
• PEA Northeastern Region 1 (NE1)
• PEA Central Region 2 (C2)
• PEA Southern Region 2 (S2)
The regions and their geographic locations are shown in Figure 5. This is approximately one third of the PEA regions, as the North, Northeast, Central and Southern areas of PEA’s control are each divided into three different regions (resulting in a total of 12 regions). A summary of these regions and their geographic coverage is provided in Table 1. In total, the data represented 25 provinces of Thailand.

Figure 4 Locations of equipment in the PEA’s power distribution in four representative areas.
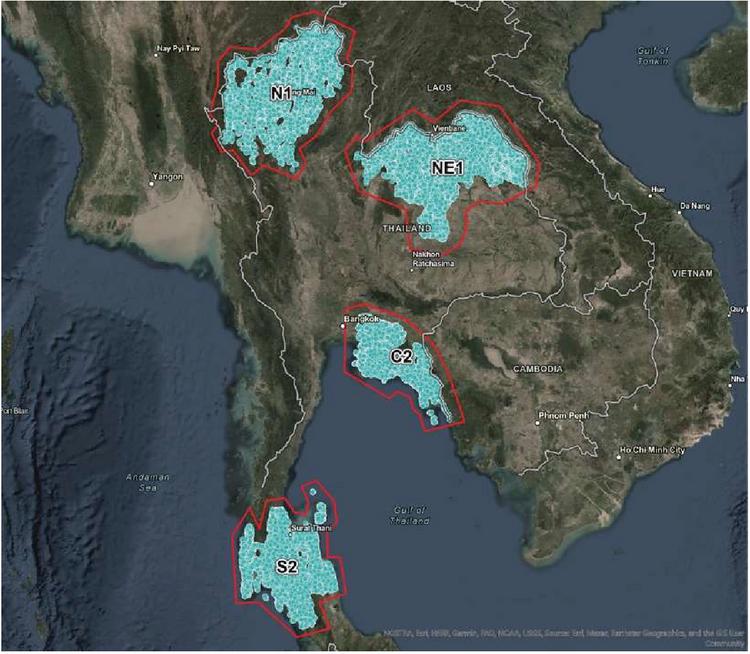
Figure 5 Regional distribution of power outages.
Table 1 The PEA Regions and their geographic scope
| Region | Number of Provinces | Largest Provinces |
| Northern Region 1 (N1) | 6 | Chiang Mai Mae Hong Son Chiang Rai |
| Northeastern Region 1 (NE1) | 8 | Udon Thani Khon Kaen Nong Bua Lamphu Nong Khai |
| Central Region 2 (C2) | 5 | Chonburi Rayong Chanthaburi Chachoengsao |
| Southern Region 2 (S2) | 6 | Nakhon Si Thammarat Phuket Surat Thani |
This study only included outages that were caused by equipment failure. The frequency of failures is summarized in Table 2. As this shows, there were a total of 705,770 data outages recorded. Of these, faulty equipment was the primary cause of 251,804 outages, or 35.7% of the total.
The data included four main sources of equipment-related failure, including Distribution Transformer (called Transformer from here) and Disconnector (Circuit Breaker, Recloser and Switch). The disconnector equipment is designed to cut off downstream power when overloads or faults are detected, in order to prevent damage to the power distribution network [22]. Therefore, these outages represent the grid working as designed. Therefore, the dataset was narrowed to Transformer failures, which included 183,717 failures (26% of the total sample).
Table 2 Summary of power outages and their causes
| Transformer | Circuit Breaker | Recloser | Switch | Total | |
| Faulty Equipment | 183,717 | 13,333 | 2,826 | 51,928 | 251,804 |
| Maintenance | 693 | 1,014 | 419 | 1,138 | 3,264 |
| Other Sources | 128,998 | 33,738 | 17,972 | 269,994 | 450,702 |
| Total | 313,408 | 48,085 | 21,217 | 323,060 | 705,770 |
4.2 Spatial Feature Engineering (SFE)
Following the preparation of the sub-sample, landmark data was selected within a one-kilometer buffer of the outage locations. Elevations were added from USGS and other data sources. Next, equipment data from the PEA dataset was added for each failure point, including installation year and equipment ID. Other factors were then encoded, including EventType, weather data, and KnownCause. The data was sorted into four regions (C2, N1, NE1, and S2), as depicted in Figure 5. In the next step, Outage data was joined with Asset data using FACILITYID, and unmatched records were then dropped. Remaining records were then grouped with year (of the event). Installation dates (from the Asset data) were then used to calculate the age of the asset at the time of the outage event (AGE). Following the SFE process, a total of 91,211 records remained, including 28,046 in C1 (30.75%), 13,962 in N1 (15.31%), 26,907 in NE1 (29.5%), and 22,296 in S2 (24.44%).
4.3 Feature Selection (FS)
The second stage of analysis was Feature Selection (FS), used to select the variables for use. The initial variable set was categorized into geographic data (from the SFE process) and outage incident data (from the PEA dataset), as shown in Figure 6. There were 197 variables prior to beginning FS. Two variables were excluded immediately. The ‘cause of failure’ variable was removed because only equipment failures were included in the dataset. Therefore, there was no variance. The ‘frequency of failure’ variable was not included because it was the output of FS process. Therefore, the FS process began with 195 variables. The dataset was split into a training set (80%) and test data (20%) and normalized. A Random Forest (RF) model was used to calculate a Feature Importance (FI) score for each of the variables, based on the age at failure. Features were selected using the FI score (FI SD).
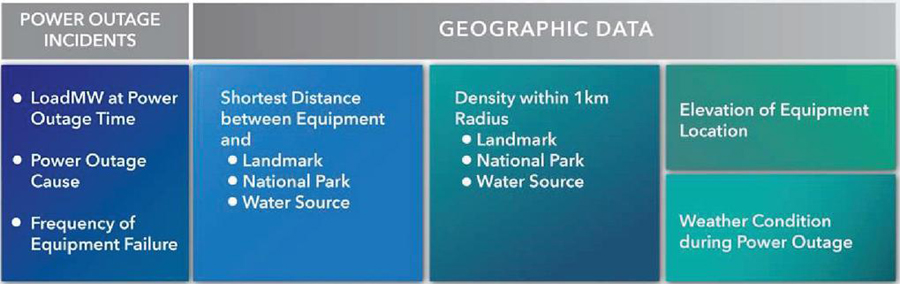
Figure 6 Variable inputs for feature selection (FS).
Table 3 The most important features in each region
| Feature | All Regions | C2 | N1 | NE1 | S2 |
| Dist_IndustrialEstate | 1st | ||||
| Dist_FireStation | 2nd | ||||
| Dist_RaceCourse | 3rd | 2nd | |||
| Dist_Butcher | 4th | ||||
| Dist_SubDistrictOffice | 5th | ||||
| Dist_Coast | 1st | 4th | |||
| Dist_ThaiTouristOffice | 2nd | ||||
| Dist_DistrictOffice | 3rd | ||||
| LoadMW | 4th | 1st | 3rd | ||
| Dist_Hotel | 5th | ||||
| Elevation | 2nd | ||||
| Dist_Buddhist | 3rd | 1st | |||
| Weather | 4th | ||||
| Dist_Ophanage | 5th | ||||
| Dist_VillageOffice | 3rd | ||||
| Dist_Store | 4th | ||||
| Dist_Shipyard | 5th | ||||
| Count_Condo | 1st | ||||
| Dist_National_Park | 2nd |
The most important features are location-related, other than Load_MW (electrical load), as shown in Table 3. The FS process showed some interesting variations between regions. In Region N1, equipment located near schools and temples have shorter lifespans. This indicates that in this region, equipment in urban areas has a shorter lifespan. In comparison, Region S2 equipment has a shorter lifespan when located near the ocean or national parks, as well as condominium density. This suggests that equipment in tourism areas and areas with high environmental stress may be more prone to failure. Therefore, the selection of most important features varied depending on the area.
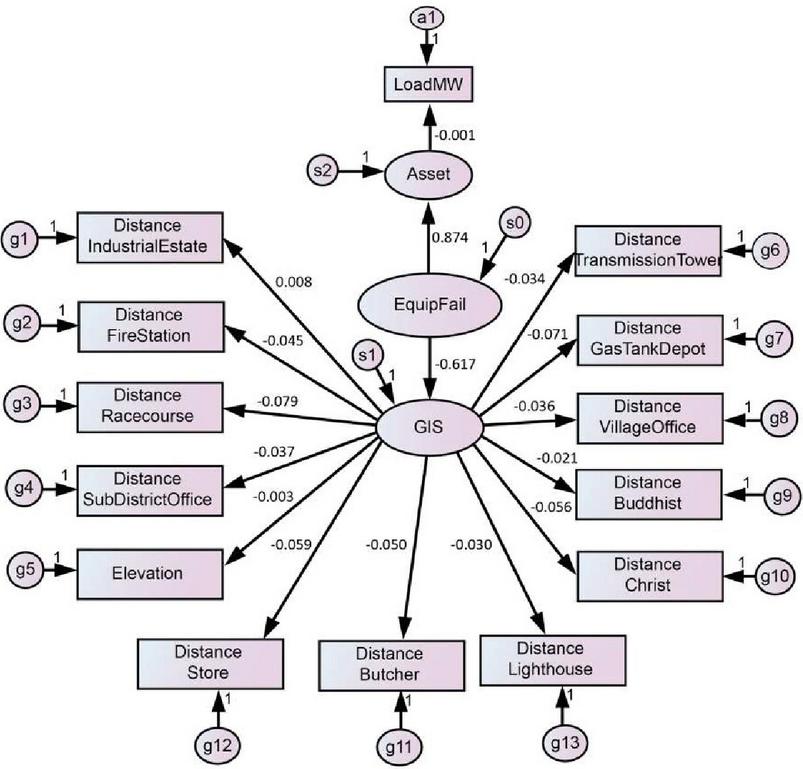
Figure 7 Structural model: All regions.
Table 4 Summary of the SEM regression weights for all five models
| All Regions | C2 | N1 | NE1 | S2 | |
| GIS EquipFail | -0.617 | 0.780 | 0.743 | -0.482 | 1.091 |
| Asset EquipFail | 0.874 | -0.569 | -0.557 | 1.106 | 1.195 |
| LoadMW Asset | -0.001 | -0.003 | -0.002 | -0.001 | -0.003 |
| Elevation GIS | -0.003 | -0.041 | 0.027 | ||
| Weather GIS | -0.021 | -0.003 | |||
| Points of Interest | |||||
| Dist_FireStation GIS | -0.045 | ||||
| Dist_IndustrialEstate GIS | 0.008 | 0.086 | |||
| Dist_Racecourse GIS | -0.079 | 0.335 | |||
| Dist_SubdistrictOffice GIS | 0.037 | -0.035 | 0.030 | ||
| Dist_Christ GIS | -0.056 | 0.187 | |||
| Dist_Buddhist GIS | -0.021 | -0.025 | 0.018 | ||
| Dist_VillageOffice GIS | -0.036 | 0.100 | |||
| Dist_GasTankDepot GIS | -0.071 | 0.303 | |||
| Dist_TransmissionTower GIS | -0.034 | ||||
| Dist_Lighthouse GIS | 0.030 | ||||
| Dist_Store GIS | -0.059 | 0.156 | |||
| Dist_Butcher GIS | -0.050 | ||||
| Dist_Coast GIS | -0.020 | -0.081 | 0.073 | ||
| Dist_ThaiTouristOffice GIS | -0.084 | ||||
| Dist_DistrictOffice GIS | -0.046 | ||||
| Dist_Hotel GIS | -0.059 | ||||
| Dist_Palace GIS | -0.008 | ||||
| Dist_DecoStore GIS | -0.098 | 0.368 | |||
| Dist_Road GIS | 0.016 | 0.013 | |||
| Dist_ChainRestaurant GIS | -0.095 | ||||
| Dist_GasStation GIS | -0.040 | ||||
| Dist_FishingPort GIS | -0.008 | ||||
| Dist_MunicipalOffice GIS | -0.058 | ||||
| Dist_Airport GIS | -0.057 | ||||
| Dist_School GIS | -0.021 | ||||
| Dist_Port GIS | 0.000 | ||||
| Dist_VillageOffice GIS | -0.031 | ||||
| Dist_Orphanage GIS | -0.024 | ||||
| Dist_EducationCenter GIS | -0.047 | 0.130 | |||
| Dist_Shipyard GIS | 0.026 | ||||
| Dist_Market GIS | 0.149 | ||||
| Dist_University GIS | 0.331 | ||||
| Count_Inc GIS | -0.125 | ||||
| Dist_Village GIS | 0.333 | ||||
| Dist_Hindu GIS | 0.192 | ||||
| Dist_Harbour GIS | -0.097 | ||||
| Dist_Monument GIS | 0.230 | ||||
| Dist_Fastfood GIS | 0.027 | ||||
| Count_Condo GIS | -0.018 | ||||
| Dist_National_Park GIS | -0.027 |
4.4 Structural Equation Modeling (SEM)
SEM was used to verify the FS process. The SEM process included asset data (LoadMW of the asset at time of outage), equipment failure data (Age_Day, representing duration from last maintenance to outage), GIS data (POI data selected from the FS process), and weather conditions. Figure 7 shows the SEM output of the model for all four areas. Table 4 summarizes the regression weights for the four area model, as well as each individual model, showing the variations between the regions in terms of the factors included and their relative significance. As this shows, the effect of Asset (0.617) and GIS (0.874) is approximately equivalent in terms of influence on EquipFail. However, there are some variations in the regions in the strength and direction of the relationships of these factors. Furthermore, while the Asset model is fairly consistent between all regions, the POIs of significance vary a lot between regions. This is due to the different natural and built environments of each region. For example, C2 is an urban region, and most of its POIs of importance reflect this. Similarly, the other regions reflect variations in the importance of different POIs. This is consistent with the expected findings from the FS process, which identified different features of interest in the different regions.
4.5 Predictive Modeling
The final step of the analysis was the development of a predictive model to predict Transformer-related power outages. This process was conducted using RF and logistic regression, with the input variables including the predictor variables identified previously and the output variable being AGE_DAY, which represents the predicted time to failure from the last maintenance period for the asset. The analysis was conducted five times, once for all regions and once for each region (C2, N1, NE1 and S2). Once again, the dataset was broken into separate training (80%) and test (20%) datasets, and data was then normalized.
Table 5 Summary of logistic regression and RF regression
| All Regions | C2 | N1 | NE1 | S2 | |
| Logistic Regression (R-square) | 0.0024 | 0.0032 | 0.0018 | 0.0046 | 0.0018 |
| RF Regression (R-square) | 0.2852 | 0.2414 | 0.3252 | 0.3239 | 0.2148 |
A summary of the logistic regression and RF regression outcomes is provided in Table 5. As this shows, in all cases the RF regression r-square value was higher than the logistic regression r-square value. This indicates that RF regression is preferable to logistic regression for predicting outages by equipment failure. Figure 8 shows the most important factors in All Regions and in the individual regions. This shows that for all regions, Total_Age_Day (representing the equipment age at time of failure) and LoadMW (the equipment electrical load at time of failure) are significant predictors. However, other predictors vary by regions. Most notably, in Region S2, the Dist_Coast was a significant predictor, which may be related to the level of precipitation. This can be seen in Figure 9, which shows that early failures (red dots) are concentrated along the coastline.
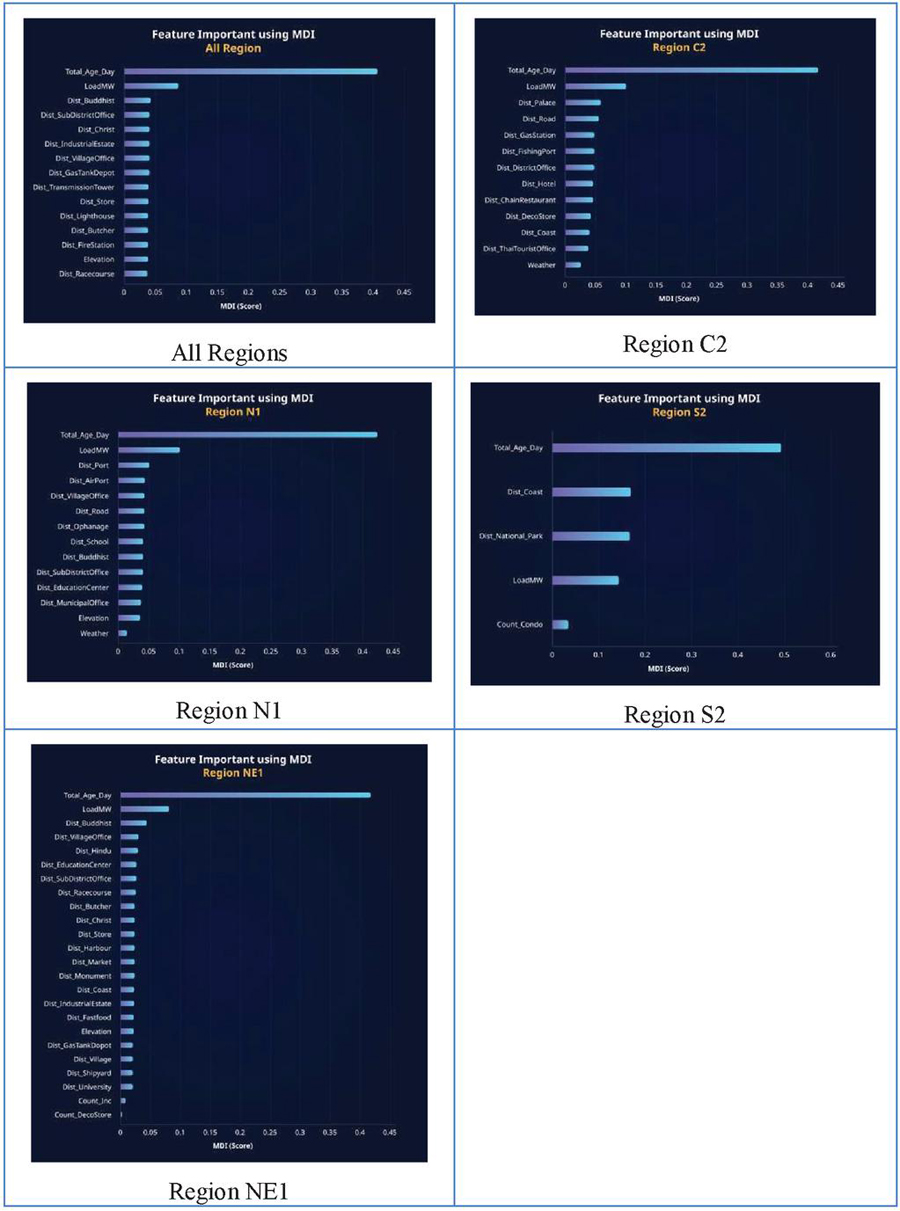
Figure 8 Feature Importance of variables derived from RF regression.
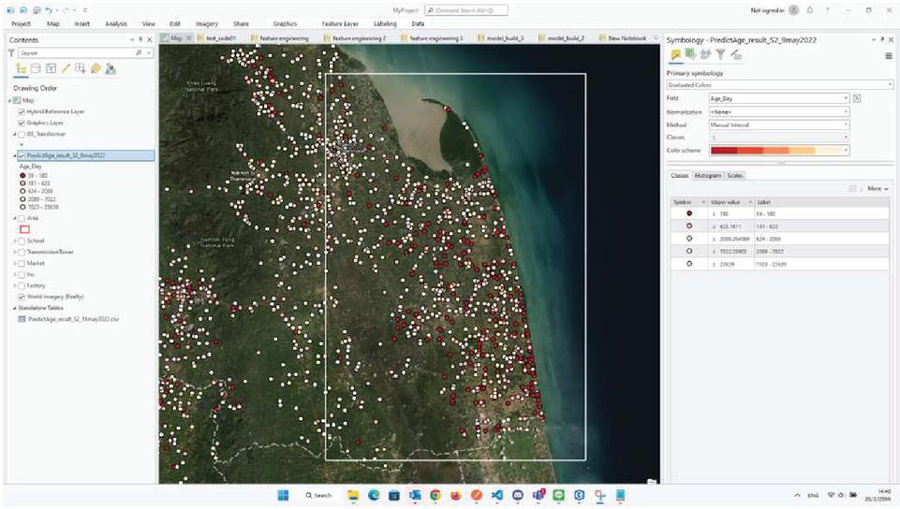
Figure 9 Map of predicted failures in Area S2, illustrating concentration of predicted failures along the coastline.
4.6 Discussion
The research outcomes showed that equipment-related power outages could not be predicted in the exact same way in different regions of Thailand. In all regions, the amount of time since the installation date to the last maintenance date (Total_Age_Day) was a significant predictor of transformer failure, as was the equipment’s electrical load (LoadMW) to a lesser extent. However, there were different locational factors that were relevant in each of the regions. In region N1, the POI predictors suggested that proximity to an urban area was a factor in equipment failure, with POIs including education centers and schools, village and municipal offices, airports and so on being significant predictors of failure. This was also true in regions NE1 and CE2. However, region S2 was different, with POI-based predictors of failure including distance from the coast and national parks, as well as the number of condominiums, predicting equipment failure. This suggests that in region S2, equipment in coastal regions (which are both the location of national parks and areas of high condominium density due to tourist areas) is more susceptible to failure. Therefore, it is likely that climate factors, like daily humidity, precipitation, or wind, may play a significant role in equipment failure in this region, but is less important in other regions.
The most obvious contribution of this study is that it confirms the importance of location-related factors for reducing or preventing equipment-related electricity outages. Preventative maintenance is specifically intended to reduce the rate of equipment failure [27]. This study provides support for a scheduled maintenance schedule, in which maintenance is conducted routinely [27], but it also suggests that probabilistic maintenance [29] could be used. Regardless of the maintenance structure used, it is clear that preventative maintenance is essential for reducing the potential transformer failure.
This research also shows the usefulness of GIS data for the electrical grid. There were many different GIS variables that were relevant to equipment failure in all regions, but it was clear that near the coast (region S2), weather and particularly precipitation may be a factor in failure, as has been found by earlier researchers [11, 14, 26, 33, 34]. Similarly, in urban areas, proximity to densely settled areas may be predictive of increased equipment stress. Thus, GIS data can be a useful adjunct to equipment data for predicting equipment failure.
5 Conclusion
This research set out to develop a statistical model to predict power outages that were attributable to distribution equipment (transformer) failure in Thailand. The study drew on outage data and asset data from the Provincial Electricity Authority (PEA), which manages Thailand’s electric distribution grid outside major urban areas. It also merged in GIS data from different sources, including weather data, elevation data, and distance from various POIs within both the built environment and the natural environment. The analysis encompassed four different regions of Thailand, which have different population distributions, levels of urbanization, and natural environments. A predictive model was also built for the entire dataset. In all regions, there were some common predictors for transformer failure, including the time since the last maintenance cycle and the electrical load on the equipment at the time of failure. However, different regions had very different geographic predictors. In the C2, N1 and NE1 regions, POIs that indicated urbanization and industrialization, such as schools, administrative centers, roads, and ports, are predictive of equipment failure. Therefore, in these regions it is more likely that equipment will fail in urban and industrial areas. However, the S2 region is very different, with proximity to the coast and national parks and the density of condominiums predicting failure. This suggests that climate factors, such as exposure to high humidity, sea spray and other coastal precipitation, and so on, is much more important in the largely rural S2 region. In conclusion, therefore, it is not possible to really predict equipment failure based only on equipment data itself. The inclusion of regionally relevant GIS indicators can improve the predictive power of such models and make them more useful for preventative maintenance planning.
There are some managerial implications from these findings. The most important of these implications is that scheduled maintenance and predictive maintenance are critical for grid reliability. The predictive model strongly suggests that time since the most recent maintenance cycle is the most important factor in predicting failure. Therefore, this research strongly supports implementing a preventative maintenance program for all equipment, in order to reduce the risk of failure. Since most electric grid operators can be expected to already be using preventative maintenance, the findings also support improving the preventative maintenance scheduling process by customizing the schedule for individual installations depending on local conditions. For example, based on this study it may be more appropriate to schedule installations in urban and industrial areas, as well as coastal installations, to have an enhanced maintenance schedule. It may also be appropriate to use additional information such as GIS data and weather data to evaluate the preventative maintenance schedule for each installation. In future, data from environmental sensors could also be used to collect real-time weather and environment data, although these have not yet been implemented in Thailand’s electricity grid.
There were some limitations to this study. First, the analysis covered only certain areas of Thailand, which were some of those fully covered by the PEA’s asset and outage datasets. These datasets are not complete, as they have been collected over time in different formats. There were also limitations to the study’s variables. For example, only a 4-year period of outage data was available and used for the analysis. However, electrical distribution equipment is typically long-lived, with actual lifespans of some kinds of equipment reaching decades. Therefore, this study may not reflect failures in this longer-lived equipment, particularly in more lightly loaded rural areas. The asset and outage data did not include broken or retired assets. So, the analysis only includes assets that are still in operation or that have not yet been removed from the database. It can create bias which can reduce the effectiveness of the model. In addition, direct information about climate conditions were not included, as they were excluded in the feature selection process. Additionally, the study should consider other factors that could contribute to this equipment failure such as maintenance history and manufacturing quality of equipment. Models were also constructed in a large region, which could be refined to smaller regions. These limitations mean there is an opportunity to improve the predictive modeling process. For example, future analysis could be conducted at smaller granularity, improving knowledge of how urban and industrial areas and the natural environment influence the time to failure for electricity distribution equipment. Furthermore, future study could explore the use of other machine learning algorithms for estimating equipment failure, such as neural networks or support vector machines.
References
[1] T. Winther, The impact of electricity: Development, desires and dilemmas, Berghahn Books, London, 2008.
[2] S.A. Sarkodie, S. Adams, Electricity access, human development index, governance and income inequality in Sub-Saharan Africa, Energy Reports. 6 (2020) 455–466. https://doi.org/10.1016/j.egyr.2020.02.009.
[3] S.M. Naeem Nawaz, S. Alvi, Energy security for socio-economic and environmental sustainability in Pakistan, Heliyon. 4 (2018) 854. https://doi.org/10.1016/j.heliyon.2018.
[4] S. Adams, F. Atsu, E.M. Klobodu, L. Richmond, Electricity transmission, distribution losses and economic growth in South Africa, Heliyon. 6 (2020). https://doi.org/10.1016/j.heliyon.2020.e05564.
[5] J. Ayaburi, M. Bazilian, J. Kincer, T. Moss, Measuring “Reasonably Reliable” access to electricity services, Electricity Journal. 33 (2020) 106828. https://doi.org/10.1016/j.tej.2020.106828.
[6] P.J. Gertler, K. Lee, A.M. Mobarak, Electricity reliability and economic development in cities: A microeconomic perspective, Oxford, 2017.
[7] World Bank, Income classification and lending groups, World Bank Data. (2020). https://datahelpdesk.worldbank.org/knowledgebase/articles/906519-world-bank-country-and-lending-groups.
[8] World Bank, Access to electricity (% of population) – Thailand, World Bank Open Data. (2022). https://data.worldbank.org/indicator/EG.ELC.ACCS.ZS?locations=TH.
[9] World Bank, GovData360, Global Governance Practice (GGP). (2022). https://govdata360.worldbank.org/.
[10] J. Arlet, Electricity tariffs, power outages and firm performance: A comparative analysis, in: Proceedings of the DECRG Kuala Lumpur Seminar Series, Kuala Lumpur, Malaysia, 2017.
[11] S. Panya, W. Pattaraprakorn, T. Detmote, P. Teansri, P. Bhasaputra, Economic impact of power outage in Thailand: Industry perspectives, Proceedings of the International Conference on Energy and Sustainable Development: Issues and Strategies, ESD 2010. (2010). https://doi.org/10.1109/esd.2010.5598792.
[12] P. Teansri, R. Bhasaputra, W. Pattaraprakorn, P. Bhasaputra, Outage Cost of Industries in Thailand by Considering Thailand Standard Industrial Classification, GMSARN International Journal. 4 (2010) 37–48.
[13] H. Haes Alhelou, M.E. Hamedani-Golshan, T.C. Njenda, P. Siano, A survey on power system blackout and cascading events: Research motivations and challenges, Energies (Basel). 12 (2019) 1–28. https://doi.org/10.3390/en12040682.
[14] C. Silva, M. Saraee, Electricity distribution network: Seasonality and the dynamics of equipment failures related network faults, 2020 Advances in Science and Engineering Technology International Conferences, ASET 2020. (2020). https://doi.org/10.1109/ASET48392.2020.9118274.
[15] B.A. Wender, M.G. Morgan, K.J. Holmes, Enhancing the Resilience of Electricity Systems, Engineering. 3 (2017) 580–582. https://doi.org/10.1016/J.ENG.2017.05.022.
[16] H.A. Gabbar, Introduction, in: H.A. Gabbar (Ed.), Smart Grid Energy Engineering, Elsevier, 2017.
[17] Y. Kakumoto, Y. Koyamatsu, A. Shiota, Y. Qudaih, Y. Mitani, Application of Geographic Information System to Power Distribution System Analysis, Energy Procedia. 100 (2016) 360–365. https://doi.org/10.1016/j.egypro.2016.10.189.
[18] A. Vinogradov, A. Vinogradova, V. Bolshev, Analysis of the quantity and causes of outages in LV/MV electric grids, CSEE Journal of Power and Energy Systems. 6 (2020) 537–542. https://doi.org/10.17775/CSEEJPES.2019.01920.
[19] R. Billinton, Basic models and methodologies for common mode and dependent transmission outage events, IEEE Power and Energy Society General Meeting. (2012) 1–8. https://doi.org/10.1109/PESGM.2012.6343943.
[20] M. Papic, S. Agarwal, R.N. Allan, R. Billinton, C.J. Dent, S. Ekisheva, D. Gent, K. Jiang, W. Li, J. Mitra, A. Pitto, A. Schneider, C. Singh, V.V. Vadlamudi, M. Varghese, Research on Common-Mode and Dependent (CMD) Outage Events in Power Systems: A Review, IEEE Transactions on Power Systems. 32 (2017) 1528–1536. https://doi.org/10.1109/TPWRS.2016.2588881.
[21] M. Vaiman, P. Hines, J. Jiang, S. Norris, M. Papic, A. Pitto, Y. Wang, G. Zweigle, Mitigation and prevention of cascading outages: Methodologies and practical applications, IEEE Power and Energy Society General Meeting. (2013) 1–5. https://doi.org/10.1109/PESMG.2013.6672795.
[22] R. Murugan, R. Ramasamy, Understanding the power transformer component failures for health index-based maintenance planning in electric utilities, Eng Fail Anal. 96 (2019) 274–288. https://doi.org/10.1016/j.engfailanal.2018.10.011.
[23] T. Dokic, M. Pavlovski, D. Gligorijevic, M. Kezunovic, Z. Obradovic, Spatially aware ensemble-based learning to predict weather-related outages in transmission, Proceedings of the Annual Hawaii International Conference on System Sciences. (2019) 3484–3493. https://doi.org/10.24251/hicss.2019.422.
[24] J. Wu, H. Wang, L. Yao, Z. Kang, Q. Zhang, Comprehensive evaluation of voltage stability based on EW-AHP and Fuzzy-TOPSIS, Heliyon. 5 (2019). https://doi.org/10.1016/j.heliyon.2019.e02410.
[25] S.C. Nwanya, C.A. Mgbemene, C.C. Ezeoke, O.C. Iloeje, Total cost of risk for privatized electric power generation under pipeline vandalism, Heliyon. 4 (2018) 702. https://doi.org/10.1016/j.heliyon.2018.
[26] J. Niu, J. Su, Y. Yang, Y. Cai, H. Liu, Distribution transformer failure rate prediction model based on multi-source information, CMD 2016 - International Conference on Condition Monitoring and Diagnosis. (2016) 944–947. https://doi.org/10.1109/CMD.2016.7757980.
[27] W. Wascom, Y. Xiang, Time-based preventative maintenance policies for circuit breakers with multiple failure types, in: 2021 Annual Reliability and Maintainability Symposium (RAMS), IEEE, 2021. https://doi.org/10.1109/RAMS48097.2021.9605785.
[28] D. Catenazzo, B. Orflynn, M. Walsh, On the use of wireless sensor networks in preventative maintenance for industry 4.0, Proceedings of the International Conference on Sensing Technology, ICST. 2018-December (2019) 256–262. https://doi.org/10.1109/ICSensT.2018.8603669.
[29] P. Kundu, S. Chopra, B.K. Lad, Development of a Risk Based Maintenance strategy to optimize forecast of gas turbine failures, International Journal of Performability Engineering. 11 (2015) 407–416.
[30] K.-T. Chung, Geographic information system, in: D. Richardson, N. Castree, M.E. Goodchild, A. Kobayashi, W. Liu, R.A. Marston (Eds.), The International Encyclopedia of Geography, John Wiley and Sons, 2019: pp. 1–10. https://doi.org/10.1002/9781118786352.wbieg0152.pub2.
[31] K. Zhou, C. Fu, S. Yang, Big data driven smart energy management: From big data to big insights, Renewable and Sustainable Energy Reviews. 56 (2016) 215–225. https://doi.org/10.1016/j.rser.2015.11.050.
[32] P.C. Chen, M. Kezunovic, Fuzzy Logic Approach to Predictive Risk Analysis in Distribution Outage Management, IEEE Trans Smart Grid. 7 (2016) 2827–2836. https://doi.org/10.1109/TSG.2016.2576282.
[33] J.B. Leite, J.R.S. Mantovani, T. Dokic, Q. Yan, P.C. Chen, M. Kezunovic, Resiliency Assessment in Distribution Networks Using GIS-Based Predictive Risk Analytics, IEEE Transactions on Power Systems. 34 (2019) 4249–4257. https://doi.org/10.1109/TPWRS.2019.2913090.
[34] R.D. Flamenbaum, T. Pompo, C. Havenstein, J. Thiemsuwan, Machine Learning in Support of Electric Distribution Asset Failure Prediction, SMU Data Science Review. 2 (2019) 16.
[35] V. Sultan, B. Hilton, How may location analytics be used to enhance the reliability of the smart grid?, Inventions. 4 (2019). https://doi.org/10.3390/inventions4030039.
[36] S.J. Rey, D. Arribas-Bel, L.J. Wolf, Geographic data science with PySAL and the PyData Stack, (2020).
[37] S. Chen, X. Zhang, S. Wei, T. Yang, J. Guan, W. Yang, L. Qu, Y. Xu, An energy planning oriented method for analyzing spatial-temporal characteristics of electric loads for heating/cooling in district buildings with a case study of one university campus, Sustain Cities Soc. 51 (2019) 101629. https://doi.org/10.1016/j.scs.2019.101629.
[38] T. Corbin, Learning ArcGIS Pro 2, 2nd ed., Packt, 2020.
[39] B.M. Byrne, Structural equation modeling with AMOS: Basic concepts, applications and programming, 3rd ed., Routledge, London, 2016. https://doi.org/10.4324/9781410600219.
[40] Natural Earth (2022). Natural Earth. https://www.naturalearthdata.com/downloads/10m-physical-vectors/10m-ocean.
[41] NASA/USGS/JPL-Caltech (2007). NASA SRTM Digital Elevation 30m. https://developers.google.com/earth-engine/datasets/catalog/USGS\_SRTMGL1\_003.
[42] Nostra, NOSTRA Map [GIS dataset], (2021).
[43] S. Ozdemir, D. Susaria, Feature engineering made easy, Packt, Birmingham, 2018.
[44] M. Kuhn, K. Johnson, Feature engineering and selection: A practical approach for predictive models, CRC Press, 2020.
[45] N.N.R. Ranga Suri, N. Murty M, G. Athithan, Outlier detection: Techniques and applications. A data mining perspective, Springer, 2019.
[46] T. Jo, Machine learning foundations: Supervised, unsupervised, and advanced learning, Springer, 2021.
[47] M. Kuhn, K. Johnson, Applied predictive modeling, Springer, 2019.
Biographies

Thanaporn Thitisawat received the bachelor’s degree in business administration (Accounting) from Thammasat University, Thailand in 1993, the master’s degree in business administration (Finance) from Clark University, USA. in 1996, and the second M.Sc. in computer information system with distinction from Bentley University (former Bentley College), USA. in 1997, respectively. She is currently Ph.D. candidate of IT management, faculty of Engineering, Mahidol University, Thailand. Her research interests include applying Geographic Information System (GIS), Geospatial Artificial Intelligence, Location Intelligence, Data Analytic, GIS Applications in Utilities and Spatial Predictive Modeling. She has experience working with IT/Geospatial technology leading companies in Thailand. She has been a guest speaker and mentor for many executive leadership programs such as Digital CEO, Chief of Digital Agro Business, Young Digital CEO, etc.

Supaporn Kiattisin, Ph.D. received a bachelor’s degree in Computer Engineering from Chiang Mai University, Thailand in 1996, the master’s degree in Electrical Engineering from King Mongkut’s University of Technology Thonburi, Thailand in 1999. She received Ph.D. degree in Electric and Computer Engineering from King Mongkut’s University of Technology Thonburi, Thailand in 2008 under the Royal Golden Jubilee Ph.D. scholarships program. She is currently a head of information technology management program at faculty of engineering, Mahidol University and head of Global Enterprise Management Center. Her research interests include enterprise architecture, data governance, big data, internet of thing, data warehouse and business intelligence. She has been an active member in many organizations such as consultant of sustainable agriculture for Ministry of Agriculture and Cooperatives, consultant for information technology projects for Office of Local Government’s Pawnshop Committee, board of director of Government Enterprise Architecture for Thai government under Ministry of Digital Economy and Society, etc.

Smitti Darakorn Na Ayuthaya, Ph.D. received the bachelor’s degree in economic (honor) from University of Thai Chamber of Commerce, Thailand in 1981, the master’s degree in business administration (Marketing) from Colorado University, USA. in 1985 and the second master’s degree in business administration (Innovation Management) from Ramkhamhaeng University, Thailand in 2008. He received the Ph.D. degree in public administration from University of Northern Philippines, Philippines in 2010 and the second Ph.D. degree in business administration from Lyceum of the Philippines University, Philippines in 2020. He is currently a lecturer with IT Management, faculty of Engineering, Mahidol University, Thailand. His research interests include digital economy, innovative business engineering, economy value management and evaluation and control. He has been an active board member in many organizations such as the Zoological Park Organization of Thailand, the Marketing Organization for Farmers, Ministry of Agriculture and Cooperative, etc.
Journal of Mobile Multimedia, Vol. 19_5, 1195–1220.
doi: 10.13052/jmm1550-4646.1954
© 2023 River Publishers