Securing Service Instantiation on Next-generation Networks
Rodrigo Santos1, Daniel Corujo1, 2,*, José Quevedo1 and Rui Aguiar1, 2
1Institute of Telecommunications, Aveiro, Portugal
2Department of Electronic, Telecommunication and Informatics, University of Aveiro, Portugal
E-mail: dcorujo@av.it.pt
*Corresponding Author
Received 31 January 2023; Accepted 27 October 2023; Publication 07 February 2024
Abstract
The Next Generation of Software Defined Networks (NG-SDN) enables a whole new set of possibilities for innovation in the data plane (e.g., computing, monitoring, load-balancing). In parallel, we have been witnessing the increasing adoption of virtualized services running in light but efficient containers, which brings forth the capability to flexibly deploy services at the network edge, while providing dynamic scaling and management. As a result, operators have tap in a lot of computational real-estate as part of the adoption of telco cloud concepts, as well as to support the foreseen edge and fog computing scenarios. However, exposing the infrastructure to third parties and realizing complex services over a multi-stakeholder environment raises challenges at different levels (e.g., security, reliability, SLA guarantees). Reconfiguring the data plane for flow monitoring and handling service requests directly on the data plane could address these challenges to support the joint communication and computation vision. This is where this paper contributes by proposing a secure and reliable system for dynamic instantiation of third-party services. A proof-of-concept prototype was developed using P4 and Kubernetes showcasing the feasibility of the proposed approach.
Keywords: Next-generation software defined networks, P4, service provisioning, monitoring.
1 Introduction
Advances in new technologies development have made the areas of information technology and telecommunications no longer regarded as operating exclusively separate. Instead, these areas are becoming increasingly entangled, fostering the development of new mechanisms capable of taking information and communication technologies even further. Mobile network architectures have seen many updates and evolutions throughout the different iterations. Fifth-Generation (5G) [1] mobile cellular networks were presented as an enabler for Internet of Everything (IoE) applications, however the deployment of 5G systems exposes the inherent limitations of this system [2]. Changes to the cloud-native 5G core are now a focus with Multi-access Edge Computing (MEC) use cases that provide network scalability, elasticity, flexibility, and automation [3]. MEC proposes to have a virtualized platform to host services at the edge of the mobile network [4]. Virtualization of network functions has drawn significant attention from the industry, leading to many changes and is now regarded as a core technology driver, deeply rooted in the telecommunications sector [5].
The association of cloud technologies brings forth an increase in the range of tools for the construction of Internet protocols that will carry the information in future usage scenarios. Next-Generation SDN (NG-SDN) leverages the latest technologies including programmable networks, and verification theory to deliver robust networks. Networks can now be dynamically reprogrammed, at run-time, to deliver new capabilities and enable unprecedented innovation for operators [6]. The P4 language is a high-level language for programming protocol-independent packet processors. It provides mechanisms to program and configure the processing pipeline of a programmable switch [7]. All the features that P4 provides allow for in data plane processing of complex problems. It is now possible to have programmable switching fabrics, highly flexible and capable of performing computation tasks. All these developments enable the possibility for joint communication and computation management for dynamic service provisioning.
Combined with MEC, such mechanisms not only allow for the instantiation of third-party services closer to users, but with the addition of network programmability it is also possible to update associated traffic flows dynamically and transparently. In this context, exploring these capabilities as an interactive service to third parties, by providing them with access to control and programming capabilities, demands for a secure and reliable infrastructure. This is where this paper aims at contributing by focusing on the design and implementation of a solution for integrated management of computation and communication resources towards dynamic service provisioning. Concretely, the paper pursues the development of a uniform Exposure Management Function that interacts with the computation and communication fabrics of the network and exposes an API for third-party service provisioning that hides all the joint implementation and respective cross-relations internals. A system that can reliably instantiate third-party services based on monitoring functionality also provided by the Exposure Management Function.
The remainder of this paper is organized as follows; Section 2 presents the relevant related works. Section 3 describes the proposed solution which is then assessed in Section 4. Finally, Section 5 concludes the paper.
2 Related Works
Some of the core aspects of the motivation of our work have been identified by the research community, which has been tackling the joint communication and computation cooperation. Particularly, progress has been made in optimizing computation capacity and the energy efficiency of the system [8, 9], reducing latency when using edge instead of cloud resources [10], in accelerating the execution of high priority jobs [11], optimizing migration costs and benefits [12], and effectively deploying microservice-based user-facing services while ensuring the requirements of quality of service (QoS) [13]. Projects have also been developed on the topics of deploying user plane functions (UPF) to serve as an interface that the 5G control plane could expect a data plane implementation to expose [14], enabling offloading of computation and storage resources closer to the users to the edge of mobile networks [15], reducing handover time [16], facing network resource allocation problems within datacenters [17], and even on securing ultra-reliable low latency communications (URLLC) applications in device-to-device communication and resource allocation [18, 19]. However, there is the need for a secure system for third-party service instantiation with integrated computation and communication fabrics. A system that provides reliable service support with agnostic service provisioning through a common management interface.
The provisioning of reliable systems requires the integration of supportive capabilities, such as monitoring and automation. The first allows to assess the system’s operational state, while the second reduces human error events. With the intent of performing monitoring actions on the data plane utilizing the P4 language capabilities, some technologies have been developed [20, 21]. Projects employing this capability exist, such as Blink, a project for network failure recovery; In-Band Network Telemetry (INT) for programmable data planes; and HULA a load balancing algorithm. Blink is a data-driven system to detect failures implemented in P4. It exploits transmission control protocol (TCP) predictable patterns to detect these failures [22]. INT is an abstraction that allows data packets to query the switch-internal state such as queue size, link utilization, and queuing latency [23]. HULA is a P4 data plane load balancing algorithm that overcomes limitations of both equal-cost multi-path (ECMP) and congestion-aware load balancing mechanisms such as CONGA [24]. P4 has also been utilized for NFV offloading in solutions such as the P4-BNG, an implementation of a Broadband Network Gateway (BNG), meeting BNG’s demands in carrier-grade environments [25]. Many of the data plane monitoring solutions, however, require processing and understanding of the network state by the control plane through the controller application. This is a recurring problem, where the control plane executes most of the processing necessary to know the network state. To solve this issue, event triggered solutions have begun to be proposed (see e.g., [26]), to utilize the switches’ computational capabilities to the fullest and offload some of the computation from the controllers.
With the modernization of virtualization and data plane programming technologies we can build a zero-touch system capable of monitoring server’s traffic and requesting service instantiation based on traffic flow. As well as a secure and reliable system where these actions are requested and performed hiding all the joint implementation. Just like MEC technology, the servers should be able to interact with this system and chose how and when these computations are done, either statically called by server, or dynamically triggered by the data plane’s monitoring features, where server’s only need to provide rules for such computation. These rules can be translated by controller applications on the network and implemented utilizing programmable switches and switch programming languages such as P4.
3 Solution and Implementation
This section provides an overview of the proposed solution for seamless exposure of a joint computing and communication system. This section starts by explaining the solution proposed and then detailing its implementation.
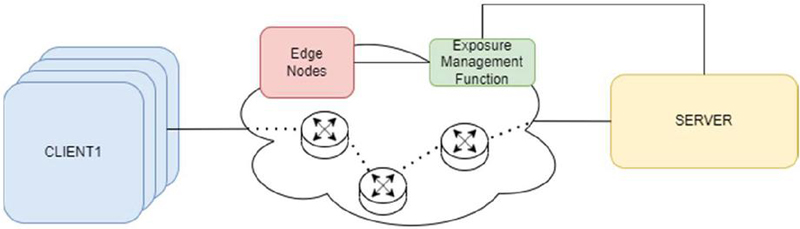
Figure 1 Solution overview.
The architecture shown in Figure 1 was developed with the intent of creating a feasible and simple solution for reliable dynamic instantiation of services and traffic monitoring. By developing a uniform Exposure Management Function (EMF), that interacts with both the computation and communication fabrics, and exposes an API for service provisioning towards third party entities. By leveraging this design to feature interactions using a modern REST API, the system was conceived to use security best practices made in place by web-based architectures [27].
The solution implements a basic Client/Server communication process, in which the Server has the possibility of communicating with an EMF in the cloud for requesting service instantiation on the edge and traffic monitoring in the data plane.
In this solution, each component has a specific, well defined, function in the behaviour of the behaviour. Firstly, the Clients are the applications responsible for generating traffic to the Server, sending messages and expecting responses from the Server. The Server is the service providing entity, which will answer to the Client’s requests, and should be in a different network than the Client’s network. The switches represent the fully programmable switching fabric, separating the Clients and the Server, and are the entities responsible for making the traffic forwarding between these two components, as well as the traffic monitoring and service instantiation requests. The EMF is the main cloud computing controller, which will act as the link between the Server and the controller functions responsible for service instantiation and the creation of rules for traffic monitoring on the data plane of the network, in this case the P4 switches. The Edge Nodes represent the edge computing mechanisms used to provide the Server’s service closer to the Clients.
3.1 Solution Implementation
In this subsection we will go over the implementation considerations of the system, detailing and providing reasoning for our implementation choices.
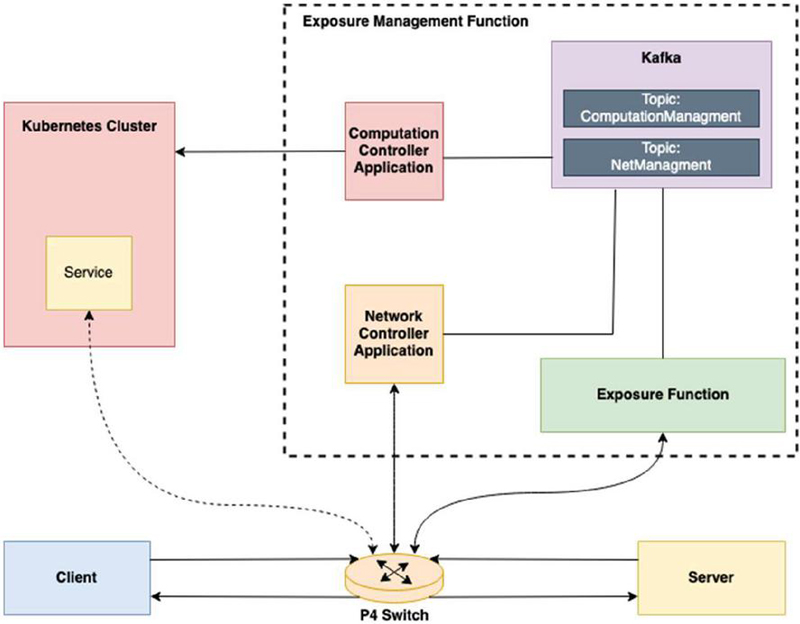
Figure 2 Solution implementation.
As shown in Figure 2, in order to implement the solution system, some of the components were decomposed into smaller more specific applications. Starting by the Client and Server, these were constructed as simple UDP message exchanging applications, in which the Server is an echo server, and the clients are simple Python clients that send messages to the Server and expect a response from it. To represent the Edge Node on the solution system, a Kubernetes cluster was created, as it is a good way to approximate an edge computing node, capable of lodging services and maintaining them [28]. The switching fabric was reduced to one P4 switch, as it will be sufficient to demonstrate the feasibility of the concept within the scope of the paper. Finally, the EMF was divided into four components. First, an API named Exposure Function (EF), that handles the Server requests flow monitoring rule creation and removal, service instantiation and deletion. Second, the EF method calls result on the production of Kafka messages in response to the API requests with the request’s information. These messages are then consumed by two controller applications that perform the control processes. Third, the Network Controller Application (NCA) is responsible for managing the P4 switch, acting as its gRPC controller, capable of inserting and removing table entries, read counters, etc., through the use of P4Runtime. Finally, the Computation Controller Application (CCA) is the Kubernetes cluster controller, responsible for creating, deleting, updating and managing the Kubernetes services and deployments. These four elements form the EMF, and represent the control plane of the network, supported by the cloud computing mechanisms.
3.1.1 Traffic redirection
To achieve traffic redirection our system needed to implement some additional tables as compared to traditional IPv4 forwarding. As the system must incorporate service migration, a new action for traffic redirection functioning similarly to a network address translation (NAT) was created, in which the required changes are made to the packet’s headers in order to forward the packet to the Kubernetes edge node service. Also, another table, for reverse NAT, was created to match on the traffic coming from the Kubernetes Cluster, along with another action to make as if the client’s messages were being answered by it was the real Server, instead of its edge-instantiated representation. Traffic redirection only occurs after the edge service is fully instantiated, to reliably guarantee the packets are not lost during service creation.
3.1.2 Traffic detection
This implemented mechanism was based on a probabilistic counting structure named Count-Min Sketch [29]. This flow monitoring functionality was implemented using two P4 registers. One register is used to keep track of the existing flows to the Server where each nonzero entry represents one or more flows. And the other register is utilized as a counter to keep track of the total number of different existing flows. To distinguish between traffic flows, the P4 switch needs to monitor incoming packets. A new table to perform this action was created. This table matches on the packet’s IPv4 destination address, IPv4 protocol, and UDP destination port as these are the parameters that define our service flow. The process of detecting flows begins every time a new packet with a valid IPv4 header arrives at the P4 switch. If the arriving packet has a valid IPv4 header and matches on the Server’s parameters, then the action responsible for the detection and storing of new flows is applied to the packet. In this action three different hash values are computed. These hash values are computed using the Server’s service parameters and the packet’s IPv4 source address and UDP source port. With these five fields we can differentiate flows from different Clients. All three hash values are computed using a different algorithm. The obtained values are then used as indices to read the contents of the register used to keep track of existing flows. Each of the read values is stored on a metadata variable and incremented by one and the result is written back on the hash values position in the register. Finally, a metadata variable is written with maximum number of allowed flows, which is the action’s argument.
3.1.3 Traffic counting
After the flow detection action is executed, each of the stored metadata values that were read from the register are compared to 1. If at least one of the values is equal to 1, we conclude that the packet currently on the pipeline belongs to a new flow to the Server, as there was no record of a flow with the same hash for at least one of the three hashes. This results on the increment of the counter register by one unit, and none of the following metadata values still to be compared are counted as the flow was already counted.
3.1.4 Service instantiation request
To have the P4 switch ask for Kubernetes service instantiation based on the Server’s capacities, the set of @controller_headers, packet_out and packet_in were created. These headers are named in the P4Runtime Controller viewpoint where packet_out is a packet going out of the controller directed to the switch and packet_in is a packet from the switch to the controller. These packets are received and sent through the CPU port.
Having the capability of communicating with a controller application through the usage of the mentioned headers, service instantiation requesting was implemented through controller communication using cloned packets.
Following the traffic counting process, a verification of the number of flows is done, in which the value of the counter register is compared to the maximum number set by the Server. If the number of flows is bigger or equal to the maximum, then the packet originating this discovery is cloned and added a packet_in header. This cloned packet is then forwarded to the NCA through the CPU port, which will receive it and act accordingly.
3.1.5 Instantiation process
In the development of this system, two modes of Server operation were implemented. The first is the immediate mode, where the service instantiation process starts as soon as the request is received. The second mode is named trigger-based, in this mode the service instantiation will be triggered by the flow monitoring system.
Immediate operation mode
In the immediate mode, once the Server starts receiving packets from clients, it makes an API request to the EF, requesting the instantiation of the service. The utilized method requires the following information: the Kubernetes namespace where the service is to be instantiated, the service name, the application name, the container name, and finally the name of the docker image to be passed to pods running the service. This method call results in the production of a Kafka message to the Kafka broker’s ComputationManagement topic. This message contains the information necessary for the instantiation of the service received from the Server API request. The ComputationManagement Kafka topic is subscribed by the CCA. If an instantiation message is consumed by the Computation Controller on the ComputationManagement Kafka topic the application will proceed to create a Kubernetes deployment and a Kubernetes service. Once both elements are created and the deployment is in the READY state, the CCA will produce a message to the NetManagement Kafka topic, demanding the NCA to create routes for the newly instantiated Kubernetes service to complete the service migration. The NCA is a consumer to the NetManagement Kafka topic. After consuming a message from this topic, the NCA will analyse it and insert table entries to the P4 switch’s tables in order to ensure the demands specified on the received message. Once all entries are inserted the requirements for service migration are completed, and traffic starts flowing to the Kubernetes instantiated service.
Trigger-based operation mode
The process in the trigger-based mode is slightly more complex. In the beginning of the Server’s execution, the Server will inform the EMF of the conditions necessary to instantiate its service. These conditions are a maximum number of flows to the Server, and the Server’s service defining information, this being the IPv4 address, the application’s protocol (IPv4 protocol field) and the application’s protocol port. This is done through an API request to the EF API. In the same request, the Server also passes the information required for the creation of the Kubernetes deployment and service, the same information as the passed on the immediate mode. With this request from the Server, the API’s method will produce a message to the NetManagement Kafka topic, demanding the creation of the flow counting rules on the P4 switch. When the Network Controller consumes a message of this kind, it inserts the necessary table entry, which is an entry to the detection table. With this, completed traffic monitoring and counting is in place. At this point, the traffic flows normally from the Clients to the Server until the number of flows is superior to the maximum number established by the Server, which is detected through the method explained in Section 3.1.2. In case this happens, our switch will send a cloned packet that symbolizes the service instantiation request, as detailed in Section 3.1.4. Once the Network Controller receives this cloned packet it produces a message to the ComputationManagement Kafka topic demanding the instantiation of the service on the Kubernetes cluster. At this point the Computation Controller does not know anything about the service to instantiate. Therefore, the Computation Controller will request the EF API, to get the required information. This information was previously stored on the EF when the Server made its initial API call. With the required information gathered, the rest of the process occurs like it does for the immediate mode of operation. The Computation Controller instantiates the service, and when this process is complete it will produce a message to the NetManagement Kafka topic demanding the creation of redirection routes. Later, the Network Controller will consume that message, insert the necessary table entries into the P4 switch, and the migration process is complete.
4 Deployment and Validation
In this section a detailed description of the implementation scenario that was deployed and tested will be given. Followed by the display of the measurements made to assess the correctness and time performance of our implementation system.
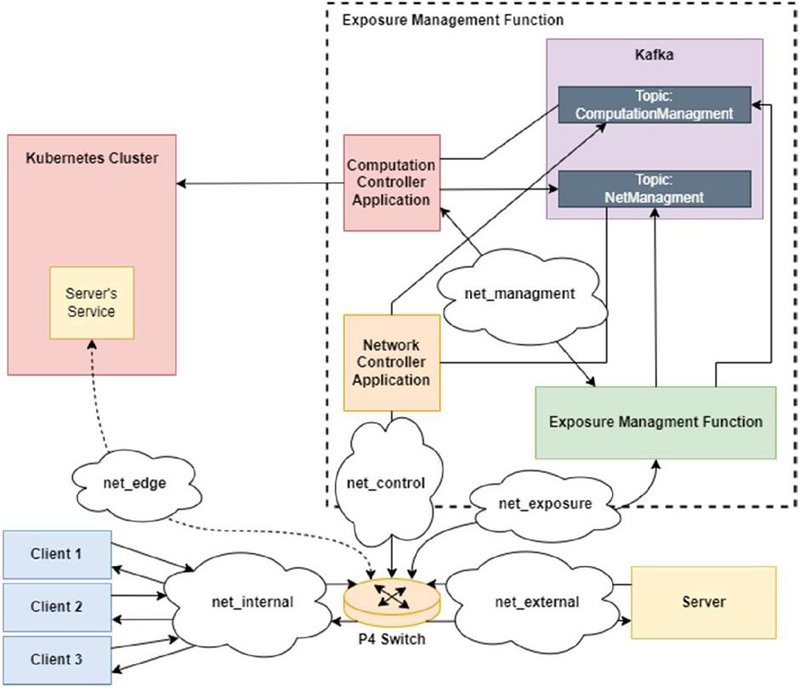
Figure 3 Solution implementation testing system.
4.1 Scenario Deployment
With the solution implementation system previously presented in mind, the system detailed in Figure 3 was tested. In this system three clients and one server were deployed in order to have a simple demonstrative program with a packet exchange between them. The system components are all ran in Docker containers for testing except the Kubernetes Cluster and the Kafka broker. The system was described and initiated using a Docker Compose environment.
The testing environment for the developed solution system is composed of a single Oracle VM VirtualBox virtual machine on version 6.1.38, running on a computer with an AMD Ryzen 7 5800H 8-core CPU, and a NVIDIA GeForce RTX 3050 Ti Laptop version GPU and 8GB of RAM. The virtual machine is an Ubuntu 20.04, with 8 processors and 4GB of RAM. The implemented system has two different operation modes, immediate and trigger-based. For each of these modes of operation the system was tested 50 times, in which the clients initiated a few seconds apart from each other. In each of the test runs, various values of link throughput and important process’s timestamps were stored, in order to allow us to measure the processing time of each of the major operations in our solution implementation, such as P4 rule and table entry insertions and deletions, and Kubernetes deployment and service instantiation and deletion. These are the most important metrics to gather information on the amount of time necessary for a service migration, and consequent network update, as well as service deletion and network restoration. In addition to these, some operation mode specific metrics were also measured. Furthermore, captures on the net_edge interface and the net_external were performed to guarantee packets were being transmitted correctly and therefore make sure the system was working properly.
It is important to highlight the fact that these measurements were taken utilizing a software switch, the Behavioral Model Version 21 (BMV2) software switch, which is not meant to be a production grade software switch and, as such, provides a significantly lower throughput and latency performance compared to that of a production-grade software or hardware switch. Adding to this, everything was ran using only one virtual machine, in a single laptop computer. Therefore, the measurements could, potentially, be significantly better in proper hardware, better suited to perform these actions.
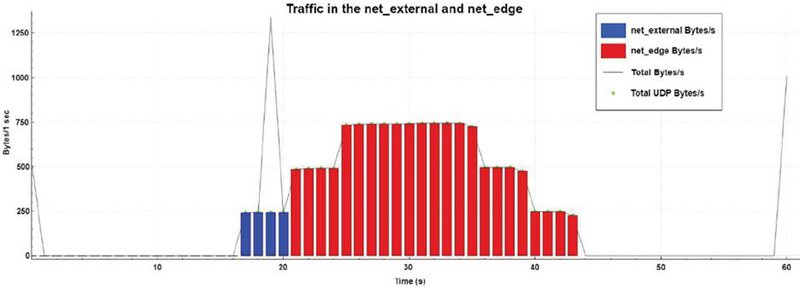
Figure 4 Bytes per second for the immediate operation mode.
4.2 Results: Immediate Operation
As we can examine from the graphic presented in Figure 4, there is a first burst of packets being exchanged at the external network. These are the result of the first client messages arriving at the server, represented by the blue bar, and the server’s call to the EMF’s API, depicted by the black line, where the server’s Kubernetes service instantiation is requested. Shortly after, the other two clients begin to send messages directed to the server, represented as the red bar. However, these are, as expected forwarded to the Kubernetes service, meaning they are sent and captured on the net_edge network. This behaviour is maintained for all the duration of the message exchange process between the clients and the server. Right at the end, a new burst of messages on the external network is captured, as the server requests for the deletion of the Kubernetes service, depicted as the black line.
In addition to the correct functioning and expected behaviour, the system was tested 50 times, in the following metrics:
• Instantiation time: Time in seconds between the moment in which the Computation Controller receives the message to instantiate the Kubernetes service and the moment in which the service is READY. This metric value had no meaningful variation, as expected, when the system was executed in the immediate or trigger-based mode, Figure 5(a).
• Service Route Creation time: Time in seconds the Network Controller takes to insert the NAT route directed to the Kubernetes cluster after the service was instantiated, and the route back to the client’s network is created, Figure 5(b).
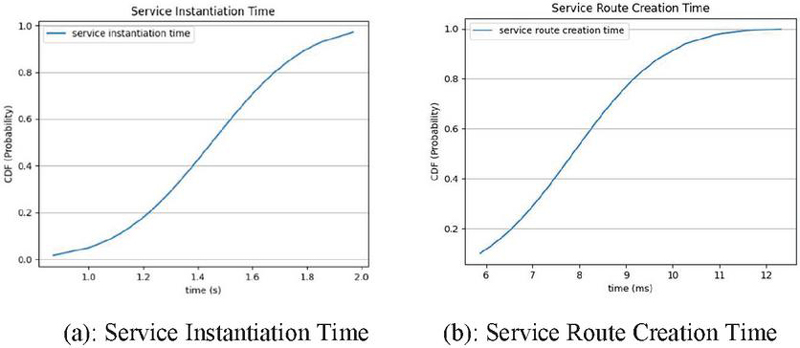
Figure 5 Immediate mode migration times.
• Deletion time: This represents the amount of time the Computation Controller requires to remove the deployment and service from the Kubernetes cluster, Figure 6(a).
• Service Route Deletion time: Time in seconds that the network controller takes to fully remove all routes necessary to redirect traffic destined to server to the Kubernetes cluster, after the Kubernetes service has been deleted, Figure 6(b).
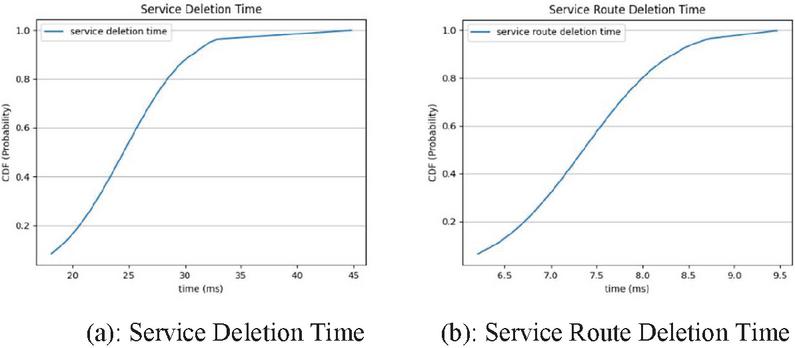
Figure 6 Immediate mode deletion times.
With the results gathered and presented on the graphs present in Figures 5 and 6, we get the following average processing times calculated with a 95% confidence interval (CI).
• Kubernetes Service and Deployment Instantiation: 1.451 0.077 (s)
• Edge Service Route Creation: 7.860 0.441 (ms)
• Kubernetes Service and Deployment Deletion: 24.535 1.322 (ms)
• Edge Service Route Deletion: 7.356 0.217 (ms)
Utilizing the values obtained from each of the previous metrics we can calculate the average migration and deletion times for the immediate mode. The migration average time is the mean of the sum of the instantiation times and the service route creation times. The deletion average time is the mean of the sum of the service deletion times and the service route deletion times. Both values were calculated with a 95% confidence interval.
| (2) |

Figure 7 Bytes per second for the trigger-based operation mode.
4.3 Results: Trigger-based Operation
It is possible to examine from the graph presented in Figure 7, there is a first burst of packets being exchanged at the external network. These are the result of the server’s call the EMF’s API, where this time the server requests for the instantiation of a flow control rule for the service. Shortly after, the clients begin sending messages directed to the server and these are, as expected, forwarded directly to the server, meaning they are sent and captured on the external network. As the clients begin to send messages, the number of packets per second increases until all the clients begin and the maximum number of flows is reached, this being three for this test deployment. When this occurs, the Kubernetes service is created, and traffic starts getting routed to it. So, the packet per second on the edge network increases just as expected. Once clients start to shut down, the number of flows and bytes/s in the net_edge network decreases, and the server requests the deletion of the Kubernetes service and the traffic monitoring. Both the Kubernetes service and its routes are deleted, and the original ones restored, and traffic begins to circulate again on the external network until all clients stop its message exchange process.
There are two metrics to be tested only on trigger-based mode, namely the detection time and the flow monitoring removal time. Detection time is the time in seconds from the client’s first message until the Network Controller gets the cloned packet requesting the service instantiation. The flow monitoring removal time is the time in seconds it takes to remove the rule for flow monitor from the P4 switch. These values are only meaningful and exist when the server is run in trigger-based mode. The obtained values are presented on the graphs displayed in Figure 8.
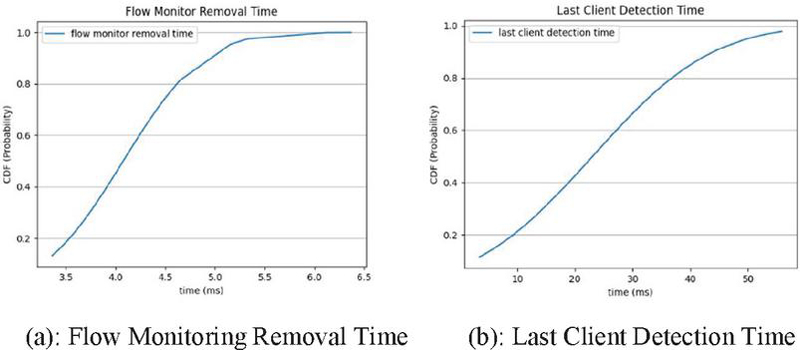
Figure 8 Trigger-based specific metrics.
The process of detection of the last client that makes the number of flows higher than that stated as the maximum from the server, takes on average 24.535 4.642 milliseconds calculated with a 95% CI. The average required time for flow monitor removal is 4.075 0.183 milliseconds with a 95% CI. If we sum each run’s gathered values from each one of the following metrics: service instantiation time; route creation time; that were both presented for the immediate mode of operation; and the detection time, and then we calculate the mean of these sums, we get the necessary amount of time that it takes, on average, to get a complete flow migration to a Kubernetes service functioning as the original server on trigger-based mode of operation. As for the average deletion time it is possible to do the same, by summing the time for flow monitor removal, service deletion and route deletion. The following values are the obtained result times for the trigger-based mode.
| (4) |
4.4 Results Discussion
With these time values we can observe that for both the immediate and the trigger-based modes of operation, the migration time is almost in its entirety based on the Kubernetes service instantiation time. As this metric for the immediate mode of operation is about 99,45% of the migration time, and for the trigger-based mode of operation it is about 98,24%. After all the results gathered from the testing phase, we can observe that the most time-consuming process is the process of creating the Kubernetes deployment and services and waiting for its ready state so that the communication is assured. This is to be expected as it is the most computationally complex task, as the deployment and service instantiated need to be checked for errors. The image passed to the Kubernetes cluster needs to be initialized on a container, and the container needs to start and transition to the READY state, in which the application contained in the image will begin. Also, we can analyse that the migration and deletion times are both superior on the trigger-based mode of operation. The migration time is 0,018 seconds higher on the trigger-based mode and the deletion time is 4,028 milliseconds slower compared to the immediate mode. This is due to the fact that there are more processes occurring in the trigger-based mode. For the trigger-based mode, the migration time includes the time of detection of the last client, which makes up 1,66% of the time; and the deletion time includes the time of removal of the flow monitoring rules that is 11,49% of the total time.
Also, in the context of our testing services and our system environment set-up it is possible to analyse that the time metrics obtained are good enough for the correct execution of the solution testing system. As the graphs in the Figures 4 and 7, demonstrate the expected and correct execution of the system in both operation modes. However, it is possible that, in the face of a real-world use case where multiple new flows could arrive at the server in a single moment, these migration times may not be sufficient for preventing the server from being congested with traffic. The obtained deletion times for both the immediate and trigger-based modes are good results has they are low millisecond magnitude values, which won’t likely prompt any issues in real use cases. These aspects also have to be taken into account considering testing environment setup, and the software switch utilized and its non-production grade performance.
5 Conclusions
This paper presented a flexible and efficient solution for managing and deploying services in complex environments, particularly by enabling operators to perform dynamic instantiation of third-party services. The solution based on SDN and cloud-native principles enhances security and reliability by providing fine-grained control over service configuration and operation, as well as enabling real-time monitoring and management of service performance.
We concluded that flow monitoring and service instantiation requesting on the data plane is feasible, effective and relatively simple to implement. Being capable of performing these monitoring actions on the data plane with currently evolving technologies, saves the control plane (and even the services themselves) a significant amount of computation. Seamless joint communication and computation systems can be done for many scenarios. The introduction of trigger-based operation shows the potential of dynamic third-party service provisioning. With the time values measured through testing we could observe that for both the immediate and the trigger-based modes of operation, the migration time is almost in its entirety based on the Kubernetes service instantiation time.
Overall, the proposed solution paves the way towards the joint communication and computing vision and represents an important direction for future research and development in the telco industry. Future works in this line should consider the utilization of programmable hardware switches, as well as the integration of the proposed mechanism in standard telco solutions (e.g., integrate with an existing UPF P4 implementation).
Acknowledgements
This work is funded by the EU SNS JU IMAGINE-B5G Project (grant no. 101096452), FCT/MCTES through national funds and when applicable co-funded EU funds under the project UIDB/50008/2020-UIDP/50008/2020.
References
[1] Logota, E., Corujo, D., Jeon, S., Rodriguez, J. and Aguiar, R.L. (2015). The 5G Internet. In Fundamentals of 5G Mobile Networks, J. Rodriguez (Ed.). https://doi.org/10.1002/9781118867464.ch2.
[2] Walid Saad and Mehdi Bennis and Mingzhe Chen. ‘A Vision of 6G Wireless Systems: Applications, Trends, Technologies, and Open Research Problems’. IEEE Network, 34(3), 2020.
[3] Syed Danial Ali Shah and Mark A. Gregory and Shuo Li. ‘Cloud-Native Network Slicing Using Software Defined Networking Based Multi-Access Edge Computing: A Survey’. IEEE Access, vol. 9, 2021.
[4] ETSI White Paper No. 11 and X. Chen and H. Zhang and C. Wu and S. Mao and Y. Ji and M. Bennis. ‘Mobile edge computing – A key technology towards 5G’. ETSI White Paper. IEEE Internet of Things Journal, 11(11), 2015.
[5] Rashid Mijumbi and Joan Serrat and Juan Luis Gorricho and Niels Bouten and Filip De Turck and Raouf Boutaba. ‘Network function virtualization: State-of-the-art and research challenges’. IEEE Communications Surveys and Tutorials, 18(1), 2016.
[6] Open Networking Foundation. Advancing the SDN Substrate for Networking. https://opennetworking.org/reference-designs/ng-sdn/, Accessed: 2022-10-18.
[7] P. Bosshart and D. Daly and G. Gibb and M. Izzard and N. McKeown and J. Rexford and C. Schlesinger and D. Talayco and A. Vahdat and G. Varghese and D. Walker. ‘P4: Programming protocol-independent packet processors’. Computer Communication Review, 44(3), 2014.
[8] Xiaowen Cao and Feng Wang and Jie Xu and Rui Zhang and Shuguang Cui. ‘Joint computation and communication cooperation for energy-efficient mobile edge computing’. IEEE Internet of Things Journal, 6(3), 2019.
[9] J. Quevedo, D. Corujo, R. Silva, D. Santos, Hao Ran Chi, A. Radwan, R. L. Aguiar, O. Abboud and A. Hecker. ‘Towards efficient provisioning of dynamic edge services in mobile networks’. Accepted to Global Communications Conference (ICC 2023), 2023.
[10] L. Baresi, D. F. Mendonça, M. Garriga, S. Guinea, and G. Quattrocchi. 2019. ‘A Unified Model for the Mobile-Edge-Cloud Continuum’. ACM Trans. Internet Technol. 19, 2, Article 29 (May 2019), 21 pages. https://doi.org/10.1145/3226644.
[11] Tsozen Yeh, Shengchieh Yu. ‘Realizing dynamic resource orchestration on cloud systems in the cloud-to-edge continuum’. Journal of Parallel and Distributed Computing, Volume 160, 2022, Pages 100–109, ISSN 0743-7315, https://doi.org/10.1016/j.jpdc.2021.10.006.
[12] A. Radwan et al., ‘Multi-Criteria Modeled Live Service Migration for Heterogeneous Edge Computing’. GLOBECOM 2022 – 2022 IEEE Global Communications Conference, Rio de Janeiro, Brazil, 2022, pp. 5031–5036, doi: 10.1109/GLOBECOM48099.2022.10001668.
[13] K. Fu, W. Zhang, Q. Chen, D. Zeng and M. Guo. ‘Adaptive Resource Efficient Microservice Deployment in Cloud-Edge Continuum’. in IEEE Transactions on Parallel and Distributed Systems, vol. 33, no. 8, pp. 1825–1840, 1 Aug. 2022, doi: 10.1109/TPDS.2021.3128037.
[14] Robert MacDavid, Carmelo Cascone, Pingping Lin, Badhrinath Padmanabhan, Ajay Thakur, Larry Peterson, Jennifer Rexford, Oguz Sunay. 2021. ‘A P4-based 5G User Plane Function’. In The ACM SIGCOMM Symposium on SDN Research (SOSR) (SOSR ’21), September 20–21, 2021, Virtual Event, USA. ACM, New York, NY, USA, 7 pages. https://doi.org/10.1145/3482898.3483358.
[15] A. Aghdai, M. Huang, D. Dai, Y. Xu and J. Chao. ‘Transparent Edge Gateway for Mobile Networks’. 2018 IEEE 26th International Conference on Network Protocols (ICNP), Cambridge, UK, 2018, pp. 412–417, doi: 10.1109/ICNP.2018.00057.
[16] P. Palagummi and K. M. Sivalingam. ‘SMARTHO: A Network Initiated Handover in NG-RAN using P4-based Switches’. 2018 14th International Conference on Network and Service Management (CNSM), Rome, Italy, 2018, pp. 338–342.
[17] Naveen Kr Sharma and Antoine Kaufmann and Thomas Anderson and Changhoon Kim and Arvind Krishnamurthy and Jacob Nelson and Simon Peter. ‘Evaluating the power of flexible packet processing for network resource allocation’. Proceedings of the 14th USENIX Symposium on Networked Systems Design and Implementation, NSDI 2017, 2017.
[18] Byoungjin Seok and Jose Costa Sapalo Sicato and Tcydenova Erzhena and Canshou Xuan and Yi Pan and Jong Hyuk Park. ‘Secure D2D communication for 5G IoT network based on lightweight cryptography’. Applied Sciences (Switzerland), 10(1), 2020.
[19] Hong Ren and Cunhua Pan and Yansha Deng and Maged Elkashlan and Arumugam Nallanathan. ‘Resource Allocation for Secure URLLC in Mission-Critical IoT Scenarios’. IEEE Transactions on Communications, 68(10), 2020.
[20] Lucas Castanheira and Ricardo Parizotto and Alberto E. Schaeffer-Filho. ‘FlowStalker: Comprehensive Traffic Flow Monitoring on the Data Plane using P4’. IEEE International Conference on Communications, May, 2019.
[21] A. Cobos, C. Guimarães, A. De La Oliva and A. Zabala. ‘OpenFlowMon: A Fully Distributed Monitoring Framework for Virtualized Environments’. 2021 IEEE Conference on Network Function Virtualization and Software Defined Networks (NFV-SDN), Heraklion, Greece, 2021, pp. 141–147, doi: 10.1109/NFV-SDN53031.2021.9665014.
[22] T. Holterbach and E. C. and M. Apostolaki and A. Dainotti and S. Vissicchio and L. Vanbever. ‘Blink: Fast connectivity recovery entirely in the data plane’. Proceedings of the 16th USENIX Symposium on Networked Systems Design and Implementation, NSDI 2019.
[23] C. Kim and A. Sivaraman and N. Katta and A. Bas and A. Dixit and L. J. Wobker and Barefoot Networks. ‘In-band Network Telemetry via Programmable Dataplanes’. Sosr, (2), 2015.
[24] Naga Katta and Mukesh Hira and Changhoon Kim and Anirudh Sivaraman and Jennifer Rexford. ‘HULA: Scalable load balancing using programmable data planes’. Symposium on Software Defined Networking (SDN) Research, SOSR 2016, 2016.
[25] R. Kundel et al. ‘P4-BNG: Central Office Network Functions on Programmable Packet Pipelines’. 2019 15th International Conference on Network and Service Management (CNSM), Halifax, NS, Canada, 2019, pp. 1–9, doi: 10.23919/CNSM46954.2019.9012666.
[26] Jan Kuèera and Diana Andreea Popescu and Han Wang and Andrew Moore and Jan Ko¡renek and Gianni Antichi. ‘Enabling event-triggered data plane monitoring’. SOSR 2020 – Proceedings of the 2020 Symposium on SDN Research, 2020.
[27] V. Atlidakis, P. Godefroid and M. Polishchuk. ‘Checking Security Properties of Cloud Service REST APIs’. 2020 IEEE 13th International Conference on Software Testing, Validation and Verification (ICST), Porto, Portugal, 2020, pp. 387–397, doi: 10.1109/ICST46399.2020.00046.
[28] Fathoni, H., Yang, C. T., Chang, C. H., and Huang, C. Y. (2019). ‘Performance Comparison of Lightweight Kubernetes in Edge Devices’. Communications in Computer and Information Science, 1080 CCIS. https://doi.org/10.1007/978-3-030-30143-9\_25.
[29] Cormode, G., and Muthukrishnan, S. (2004). ‘An improved data stream summary: The Count-Min Sketch and its applications’. Lecture Notes in Computer Science (Including Subseries Lecture Notes in Artificial Intelligence and Lecture Notes in Bioinformatics), 2976, 2004. https://doi.org/10.1007/978-3-540-24698-5\_7.
Footnotes
1https://github.com/p4lang/behavioral-model.
Biographies

Rodrigo Santos concluded is master’s degree in Computer and Telematics Engineering in 2023, from the University of Aveiro in Portugal. His master’s dissertation’s topic was on the service instantiation and flow monitoring on Next-Generation Software Defined Networks. The development of his dissertation lead to the writing of this paper which is also his first paper submission.

Daniel Corujo is an Associate Professor from the University of Aveiro, where he concluded his PhD on Communication Middleware for the Future Mobile Internet, in 2013. He was the coordinator of the Telecommunications and Networking research team at the Instituto de Telecomunicações, in Aveiro, Portugal, a team of over 50 people, from 2017 to 2018. He has been an active researcher and contributor to standardization in the fields of mobility management, through the IETF/IRTF, and Media Independent Handovers, through the IEEE. He has pursued such concepts under the scope of a broad range of EU FP7 research projects since 2007, such as DAIDALOS, OneLab2, 4WARD, MEDIEVAL, OFELIA and 5GROWTH, where he also played key roles from proposal elaboration to task and workpackage co-leading. He is currently WP leader in the national 5G Mobilizer project. Parallel to his 13 years of experience on mobility management research, he has been more recently developing work on the areas of the 5G, Network Function Virtualization, Software Defined Networking and Information Centric Networking, deploying new visions and enhancements of such concepts over wireless networks, in national and international research projects. He is Vice-chair for the IEEE ComSoc PT Chapter.

José Quevedo received his PhD in Telecommunications from the MAP-tele Doctoral Programme in Telecommunications in 2020. His early research activities were focused on Information-Centric Networking (ICN) approaches for supporting Internet of Things (IoT) scenarios. This work, conducted in the Telecommunications and Networking – Av Group (TN-Av) at Instituto de Telecomunicações (IT-Av) and University of Aveiro (UA), Portugal, has been disseminated in book chapters, conference and journal papers, and as contributions to open-source software. He has been involved in the different stages of several research projects (e.g., H2020 5Growth, H2020 5GASP). He has been further involved in the academy by working as an Invited Adjunct Professor at the University of Aveiro – Águeda School of Technology and Management (ESTGA). Currently he is the executive manager of the 5GAIner laboratory and a Senior Researcher at IT-Av working in areas related to networking protocols, network programmability and 5G and beyond systems.

Rui Aguiar is currently a Full Professor at Universidade de Aveiro. He was the founder of the ATNOG research group, an advanced telecommunication research group at the Universidade de Aveiro and is currently co-coordinating a research line in Instituto de Telecomunicações, on the area of Networks and Services. He has been an advisory for the portuguese Secretaria de Estado das Comunicações and member of the task force for 5G cybersecurity. He is a Chartered Engineer, a Senior Member of IEEE, and a member of ACM. He has served as the Portugal Chapter Chair of IEEE Communications Society and has been serving as Steering Board Chair of Networld Europe, the European ETP representing the telecommunications community, engaged in the discussions of the future European R\&D workprogrames for telecommunications. As further community engagement, he has served as Technical and General (co)Chair of several conferences (ICNS, ICT, ISCC, Mobiarch, Monami, NTMS, etc). He is a regular keynote speaker in the future of mobile communications and digital society, with dozens of talks across the whole world. He is an associated editor of Wiley’s Emerging Telecommunication Technologies and Springer’s Wireless Networks.
Journal of Mobile Multimedia, Vol. 20_1, 215–238.
doi: 10.13052/jmm1550-4646.2019
© 2024 River Publishers