Gradient Boosting for Predicting the Relation Between Bio-medical Signals and Seizures Using LGBM and XGBoost
Bhaskar Kapoor1, 2,* and Bharti Nagpal3
1AIACT&R, Guru Gobind Singh Indraprastha University, Delhi, India
2MAIT, GGS IP University, Delhi
3NSUT (East Campus) (Formerly AIACT&R), Delhi, India
E-mail: bhaskarkapoor@gmail.com
*Corresponding Author
Received 11 February 2023; Accepted 12 June 2023; Publication 29 March 2024
Abstract
Background and aim: In recent years, research in the fields of brain-computer interfacing techniques and related areas are developing at a very rapid rate with the help of exploding of Artificial Intelligence, Machine Learning and Deep Learning. A new concept of Gradient Boosting has become popular research area among the researchers related to the field of automatic classification of Electroencephalograph (EEG) signals for predication of mental health issues like seizures.
Methods: However effective feature extraction from EEG and accurately classify them with efficient classifiers is still an important task and attracted wide attention in this area. Therefore in this paper, we presented the detailed mathematical analysis of these methods and ensemble learnings based EEG signals classification method for seizures classification in EEG using Extreme Gradient Boosting Model such as Light Gradient Boosting Machine Learning (LGBM) and XGBoost.
Results: Time-frequency domain based non-linear features are selected from preprocessed EEG Dataset, and PCA (Principal Component Analysis) is used for dimensionality reduction for features engineering, then optimized feature based training and testing is done for two class classification in ensemble learning method i.e. LGBM and XGBoost. Finally, both models are tested with dataset of University of Bonn, Germany to classify the signals.
Conclusions: In addition this paper highlights the Correlation Analysis Methodology to Identify Strong Predictor and Attributes Correlation-based Attribute Ranking for the Feature Engineering which has proved to be more efficient in EEG signals Classification and provide comparative analysis with other existing models for performance evaluation in terms of accuracy which is 87.34 and 92.31 for LBGM and XGBoost, sensitivity of 85.21 and 90.18 and specificity of 83.0 and 90.04 for LBGM and XGBoost.
Keywords: Electroencephalogram, ensemble learnings, seizure prediction, XGBoost, LGBM, attribute ranking.
1 Introduction
The great discovery in methods for measuring brain activity is electroencephalography (EEG) which is based on the technique by measuring the potential of neurons by placing a series of electrodes in a non-invasive manner over the scalp and doctors, scientist, and researchers using it for a long time to help in the findings of abnormalities in the brain, sleep disorders, epilepsy [1], uncontrolled seizures, Alzheimer [2] by looking at the electroencephalographic activity. Berg et al. [3] in their work aided that by classification of the data in the early stage to predict something out of it where certain EEG activities occur before the onset of seizures. For seizures, fits or brain signals (EEG) are helpful in detection and which is very costly as the acquisition method for getting these signals of data is not so common these days. So, the aim of the research work is to Learn and analyze Bio-psychological signals (EEG) collected from University of Bonn, Germany and apply Ensemble Learnings for the fastest prediction of early stage prediction of seizure (i.e. epileptic condition) in a person and in future we can try to design and develop a low-cost personalized wearable which can be used to detect seizures or epilepsy fits before its occurrence. A bio-sensor based wearable device will be used to train for the characteristics of fits in a patient. After training that wearable device it can detect fits before its start and alert him/her [4, 5]. So we can combine the use of bio-sensors with ensemble learnings technique for fast and early prediction and with high computational classification techniques [6] together to overcome the mental health issues in the suffering patients.
Epilepsy is a disorder in brain, which is featured with the incidence of unexpected anomalous activity of brain that originates from the unnecessary activation of neurons either in whole brain or some parts of the brain. Around 50 million people are identified to experience the disease of epilepsy throughout the world, out of which around half of this population suffers with the problem of active epileptic seizures. This can lead the patients with problems that vary either as minor changes in behavior to complete failure of muscular control and consciousness. Epileptic patients are at increased risk of accidents and damage due to the incidents related to seizure alone, in addition with higher depression rates [7]. The patients, who undergo epileptic seizure, can be recovered using medicines or with surgical treatments. However, it is found that more than 32% of the cases cannot be controlled using the treatments methods that incorporate surgical or medicine process. Hence, it is particularly imperative to envisage the subsequent seizures before occurrence in such a way to prevent the patients from seizure through medication. As epileptic seizure is related to the action of human brain, Electroencephalogram (EEG) signals are generally utilized for identifying it.
The electrical activity inside the human brain can be recorded using the EEG signals, which is recorded by introducing the EEG electrodes over the scalp of patients or by inserting the electrodes inside the tissues of the brain. When a human undergoes neurological disorder, a sudden variation in the electrical signals of the brain can be detected using the EEG signals. The EEG provides temporal decision and is tedious to be applied for applications requiring continuous examination. The conventional EEG monitoring components require motionless locations and it limits mobility. Number of distinctive features, like sharp fine module, physiological area, electrocerebral negativity, and interrupted background are suggested for inspecting the epileptic seizure with the analysis of EEG signal.
1.1 Organization of Paper
The paper is organized as: Section 1 portrays a brief introduction to the research, and Section 2 surveys the existing techniques of seizure classification and their limitations. Section 3 explains premiere work done and methodology with description of dataset in detail and section portrays the proposed strategy of seizure prediction using EEG signals through LGBM and XGBoost. Section 4 explains the results generated by the system and finally, Section 5 concludes the paper.
2 Motivation for the Research
Our paper deliberates the review of the conventional methods employed for the prediction of the seizure disease with their challenges in detail. We also done the comparative analysis of ensemble learning techniques with pre-existing models which can be applied in the research of BCI technology. We also highlighted the Correlation Analysis Methodology to Identify Strong Predictor and Attributes Correlation-based Attribute Ranking is also discussed for the Feature Engineering.
2.1 Literature Review
2.1.1 Contribution based review
Barkin et al. [8] provides Hilbert Vibration Decomposition-oriented Epileptic Seizure Prediction using Neural Network (HVD-NN) methods which offers enhanced sensitivity and better rates of false alarm but it need more number of labeled samples to assure accurate prediction. Hirald Dwaraka Praveena, et al. [9] worked on long short term memory classification method which is effective in removing the redundant features that assists in achieving enhanced performance in classification but the time needed for training the classifier is high. Athar A. Ein Shoka et al. [10] gave an idea of Ensemble classifier technique that provided enhanced classification in terms of metric parameters as compared to single classifiers. Their work detected all the seizure cases without any error, but there exist some complexity in predicting all the normal cases. Ratnaprabha Ravindra Borhade et al. [11] worked on Deep Recurrent Neural Network (Deep-RNN) with Quick rate of convergence, easy implementation, less complexity, and increased speed but it need high cost for initial set up and expensive in training complex data sets. Banu Priya Prathaban et al. [12] introduced Grey Wolf Optimized Model Driven (GWO-MD) method which reduced the time needed for computation and less complexity but it has slow rate of convergence. Mustafa Sameer and Bharat Gupta [13] worked with combination of Alpha features, KNN, NB, DT, SVM, Adaboost, Random forest classifier to enhance the accuracy and high classification capability. However, it need the optimization of results in case of larger datasets. Thara D K et al. [14] contributed as Stacked Bidirectional Long Short Term Memory which overcomes the problem of vanishing gradient identified in RNN but error in prediction increases with the time of prediction. Marzieh Savadkoohi et al. [15] worked with SVM and KNN methods which are consistent and proficient in seizure prediction but this is not suitable for the dataset of larger size.
2.1.2 Performance based review
Table 1 cover a detailed Review of previous work done in the field of EEG signal classification and seizure prediction using their proposed algorithms and some novel techniques for classification with results and advantages. This section presents additional analytical study for comparison of the research done in recent years based on ensemble machine learning model and techniques used for analysis, classification and prediction of seizures based on various EEG dataset publicacally available for the researchers in the field of design and development of automated seizures prediction applications in the early stage and highlights some observations in future research issues, challenges, and needs in this area.
Table 1 EEG data based review of various techniques for seizure prediction in EEG
| Reference | Technique | Objective | Algorithm(s) | Results | Advantages | Dataset |
| [16] | Deep Neural Net in addition to convolutional Autoencoder. | Seizure detection with handcrafted features. | SVM with rbf kernel+KNN+CNN-AE | Achieved high accuracy using hybrid model and CNN-AE | Features can be computation of feature become cheap for hardware or software implementations. | Bonn dataset |
| [17] | Boosting, AdaBoost, MultiBoosting, Rotation Forest, Random Subspace Method (RSM) | Measuring performance (accuracy F-measure and ROC curve) of the ensemble machine learning methods. | MSPCA+AR Burg Algorithm | Patients were classified up to 99% accuracy in this experiment. | Useful in identification of the brain regions containing epileptic focus compared to non-focal regions. | iEEG |
| [18] | Bagging & Boosting (AdaBoost, Gradient Boosting, XG-Boosting) with stacking, Extra tree Bagging Classifiers | Categorization of EEG signals based on different channel’s recordings in classification/prediction epileptic Seizures. | DT, RF, Ridge Classifier, Logistic Regression, KNN & KSVM | RF accuracy score is 95%. Extra Tree bagging is better among all bagging. Gradient Boosting, XGBoosting and stacking has same accuracy. | Comparative analysis of all Ensemble Learnings and Traditional Machine Learning is presented in the paper. | Bonn dataset |
| [19] | Statistical Analysis using digital band-limiting filters | Seizure Prediction in EEG using AI with aid of statistical analysis for digital band-limiting filters. | k-means clustering Multi-Layer Perceptron(MLP) | Moving Average Post-Processing with Decision fusion help for reducing the false alarm rate. | Proposed seizure prediction approach can be used for large prediction horizons. | CHB-MIT database |
| [20] | Black-Box (SVM & KNN) Non-Black-Box (DT & Ensemble of Trees i.e. bagging, random subspace, boosting) | Presented an overview Based on Taxonomy of Features(statistical) with detailed view of classifiers( Black-Box & Non-BlackBox). | DF-RF (Decision Forest–Random Forest (Ensemble of decision Trees) vs. KNN+SVM+ANN+ DT(Single) | Their findings says that that Non-Blackbox Classifiers (Decision Forest) is the most effective. | Comprehensively Review of ML Approaches for seizure detection. | CHB-MIT |
| [21–23] | I-ICA and MC-SVM | For feature Selection and classification method is proposed which detect epileptic seizure very rapidly and very and in a very precise manner. | I-ICA, MC-SVM and Random Subspace Ensemble Classification | This framework(pervasive) designed to implement cloud-based service to simultaneous run detection algorithms with data aggregation by multiple users. | Framework has high security and good accessibility with low c.ost. | iEEG |
| [24] | Ensemble Extreme Learning Machine using Hybrid Feature Extraction method | The method based on idea of Ensemble Learning for enhancing generalization performance and stable machine learning. | LDA_EELM | Proposed feature extraction method(hybrid) which join Linear & Nonlinear features for higher class seperability. | This method can be applied on other biomedical signals | UCI Database + Bonn University Dataset |
| [25] | Ensemble learning approach based on Feature extraction(Entropy, HOS and Non Linear) and Meta Learning algorithm (SCANN) | Author select the best interclass variation for their work i.e. wavelet based entropy for Non-linear features and Higher Order Spectra. | K-Nearest Neighbor NaiveBayes SCANN SVM Meta Classifier | Diagnose and classify epilepsy from EEG signal in to normal, interictal, and ictal using ensemble learnings. | This method can be further Extended for heterogeneous real-time data obtained in hospitals. | University of Bonn |
| [26] | EMD (Empirical Mode Decomposition) and SVM(superior performance in term of sensitivity) | Reliable method in feature extraction in time and frequency domain and Preprocessing. | KNN NB SVM IMF’s | Detecting seizure in the start of the preictal state(anticipation time 33 min(max) and prediction time 23.6 min(avg)) with higher true positive rate 92.23% | This model is giving more time to the patients suffering with epilepsy for their medication well in advance. | EEG CHB-MIT dataset |
| [27] | Adaptive Autoregressive Coefficients with FFNN (Feed Forward Neural Network) | Performance based Analysis of Ensemble Methods based Classification (Multi-class) of Motor Imagery Signals. | AdaBoost, RUSBoost, LPBoost Bagging & Random Subspaces | In all ensemble methods RUSBoost performs higher than one FFNN Classifier with higher accuracy in multi-class classification of EEG. | Optimized Feature Extraction, Selection & Classification can be used in BCI applications | 7- person data by 19 channel EEG amplifier (NeuroWin, Make-NASAN) |
2.2 Challenges
The challenges identified in the methods of prediction of the seizure disease are enlisted below:
• The major drawbacks that arise in the Generative Adversarial Networks Long Short Term Memory [28] units are the occurrence of the right or left amplitude predominance in EEG signals.
• Support Vector Machine (SVM) and K-nearest neighbors (KNN) based epileptic seizure prediction technique inherit the problem of deprived directionality and data related to phases [29].
• The prediction strategy based on spike rate [30] technique in EEG signal does not use deep learning strategy for predicting the seizure. Hence, the correct evaluation of epileptic seizure cannot be obtained using this method.
• Seizure prediction using deep learning [31] techniques get affected with reduced SNR and in addition, it uses increased number of parameters.
• The main issue experienced in the LSTMs are they are prone to overfitting and it is difficult to apply the algorithm to curb this issue.
• Vanishing gradient is the main issue encountered in long term RNN for the epileptic seizure prediction.
3 Methodology
Most of the work done in this field is based on various classical machine learning algorithms, their comparison of ACC, Specificity, sensitivity and combination of more than two model to improve the performance using various techniques and methods [32–34]. The new way in this area are Ensemble Methods which is based on the concept of combining different tree based Algorithms for enhancement of the predictive performance rather than algorithm which is based on a single tree [35]. Also it is based on the concept of grouping weak learners to make a strong learner in a model with enhanced accuracy. In prediction using any machine learning noise bias, noise (irreducible error) and variance create a gap between actual and predicted values that can be reduced by ensemble methods [36]. Presence of Noise bias and variance in our data create under fitting or overfitting problem in the model that lead us to use ensemble learning which minimize the Generalization Gap (difference of Training and Generalization Error) to overcome this problem. The basic prediction model based on labelled or unlabeled data is shown in Figure 1.
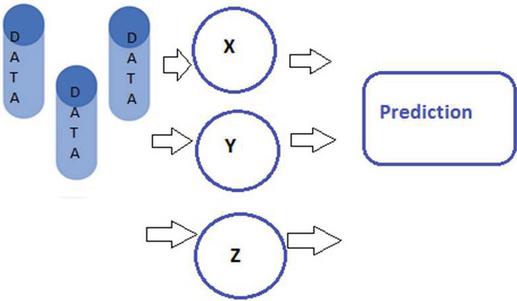
Figure 1 Labelled/unlabeled data with model X, Y and Z for prediction using ensemble learning.
In ensemble learning Stacking is use to build a new model using test set which is based on the predictions from multiple models [37]. All types of ensemble learnings are explained in Figure 2. Blending is similar as stacking but it uses validation set from the train set along with predictions for making model run on test set. The concept of Bagging is based on combination of results by multiple models to achieve a result (generalized). If the input data set is same then the probability of getting the same result from this technique, So there is a technique called Bootstrapping (a sampling approach) that uses the newly created subsets of observations from the original dataset which are equal to size of original dataset [38]. Now the Bagging (or Bootstrap Aggregating) technique use these subset whose size is less than original set to get deep information of the distribution (complete set). If some data point incorrectly predicted initially by first model, the overall predictions will be least accurate. Now here the concept of Boosting comes which is like a sequential process in which every next model remove the error of previous model to improvise the overall performance [39, 40]. Basic building block of bagging and boosting are shown in Figure 3.
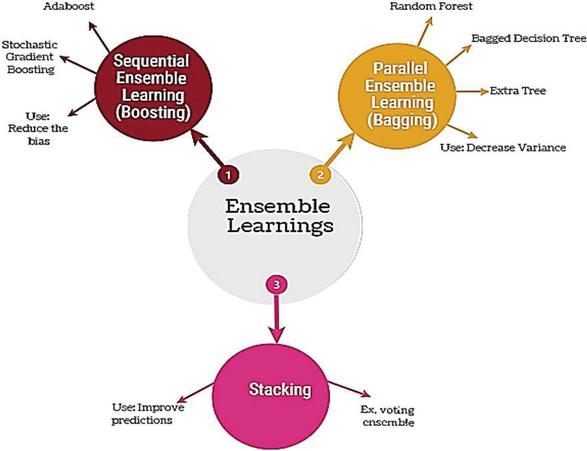
Figure 2 Ensemble learning types.
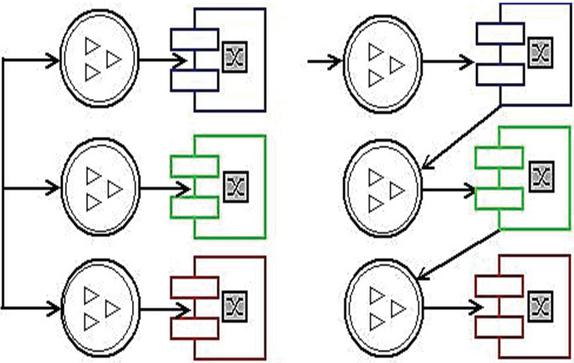
Figure 3 Bagging (parallel) vs. boosting (sequential).
Adaboost (or Adaptive Boosting) is simplest algorithm use decision trees in creation of multiple sequential models and each model correct the errors from the last. It gives some weights based on incorrect prediction for the observations and subsequent model correct the predicted value [39, 40]. Gradient Boosting (or GBM) can be used in Regression and Classification problems. In this boosting technique weak learners are combined to form strong learner. Base learners are built using Regression tress and each tree in series is created using errors calculated by previous tree [60, 61]. XGBoost (or extreme Gradient Boosting or regularized boosting) is highly effective Machine Learning Algorithm and can be treated as advanced implementation of GBM with high prediction power and faster because of its variety of regularization, less overfitting and high performance [39, 40].
The data selection is based on the availability and the used by researcher in this field [41]. The flow chart of the work done carried out in this paper is presented in Figure 4. The data collected by University of Bonn and the preprocessing is done for the feature extraction and selection for the classification purpose. Training set is about 80% and 20% is used for the testing purpose. The result is based on 10-fold cross validation presented in the paper.
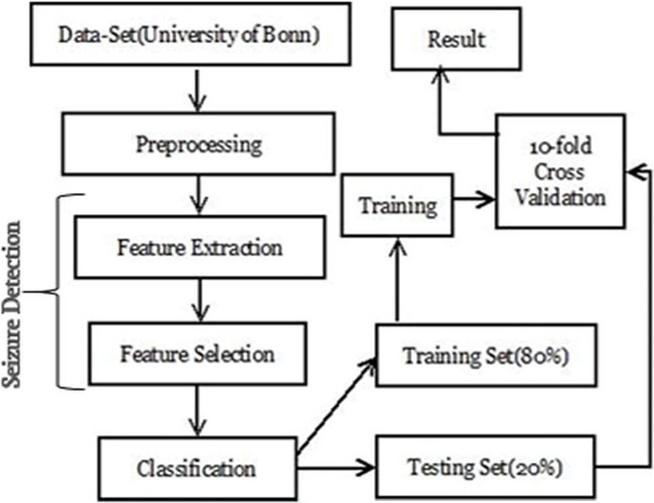
Figure 4 Block diagram for seizure prediction.
Gradient boosting is a machine learning method used for classification and regression tasks. It builds a prediction model as an amalgam of various weak prediction models, most often decision trees. Adding new models to rectify the mistakes caused by older ones is essentially how boosting works. It is important to note that both XGBoost and LGBM are regarded as gradient boosting techniques. Although there are many distinctions between the two, they function similarly. A gradient boosting model called XGBoost predicts its final value using methods for creating trees. Peak performance typically necessitates additional adjustment. The highly effective, adaptable, and portable XGBoost algorithm is built with these qualities. For machine learning tasks like classification and regression, Microsoft developed the light gradient boosting machine algorithm, often known as LGBM or LightGBM. Given that it also employs decision trees to categorize data, it resembles XGBoost quite a bit. However, one of the key distinctions between these two algorithms is that the XGBoost algorithm tree develops depth-wise, whereas the LGBM tree grows leaf-wise. Tree generation for seizure prediction in XGBoost or LGBM is shown in Figure 5.
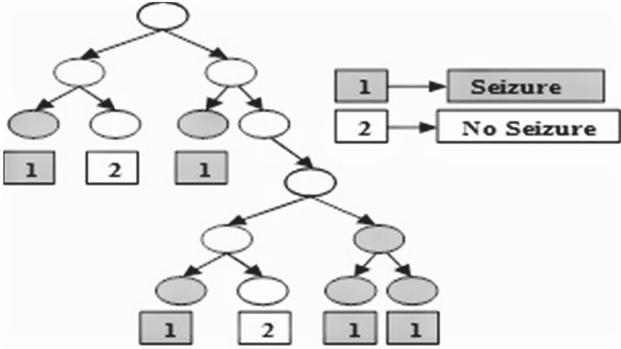
Figure 5 Tree for seizure prediction in XGBoost or LGBM.
3.1 Dataset Description
A publically available dataset used in this study that is database of Bonn University (UoB), Germany (Andrzejak et al., 2001) [42, 43] that is publically available to so research in the EEG Signals and can be used for the modeling of seizure detection. Summary of Bonn Data set is given here in Table 2 for the in-depth analysis of statistic of the dataset. All subset of this database have 100 segments of EEG and each for 23.6 s duration contained 4097 samples with sampling rate of 173.610 Hz.
Set A Seizure Free of 5 healthy person (open eye)
Set B Seizure Free of 5 healthy person (closed eye)
Set C Person with epilepsy (during seizure free using intracranial electrodes in epileptogenic zone)
Set D Person with epilepsy (during seizure free using intracranial opposite in epileptogenic zone)
Set E Person with epilepsy (during activity with in epileptogenic zone)
Table 2 Summary of datasets obtained from EEG Database of University of Bonn, Germany (Andrzejak et al., 2001)
| Subject | Person(Healthy) | Person(With Epilepsy) | |||
| Detail | Set A | Set B | Set C | Set D | Set E |
| State | Normal person(awake with eye open) | Normal person(awake with eye closed) | Seizure free (interictal) | Seizure free (interictal) | Seizure activity (ictal) |
| Electrode placement | 10–20 International System | 10–20 International System | Within epileptogenic zone | Opposite to epileptogenic zone | Within epileptogenic zone |
| Electrode type | Surface | Surface | Intracranial | Intracranial | Intracranial |
| Total epochs | 100 | 100 | 100 | 100 | 100 |
| Duration | 23.6 s | 23.6 s | 23.6 s | 23.6 s | 23.6 s |
The visualization of a sample of EEG from each subset obtained from UoB database is given in the figure. The Y axis in graph represents attribute and the x-axis in graph represent corresponding weight. The weight table of University of Bonn datset for LGBM model and Extreme Gradient Boosting (XGBoost) model is depicted in the Figure 6.
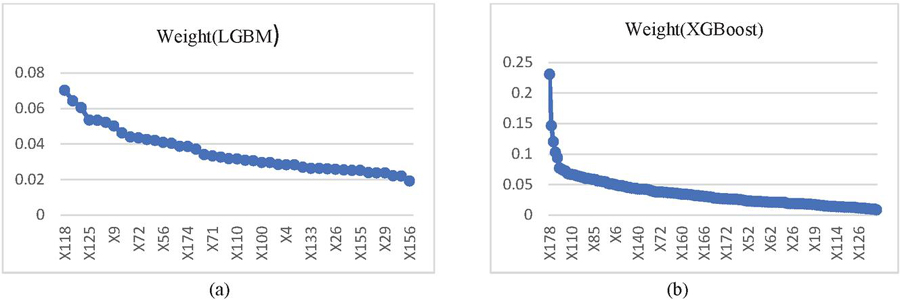
Figure 6 Weight table (a) LGBM and (b) XGBoost.
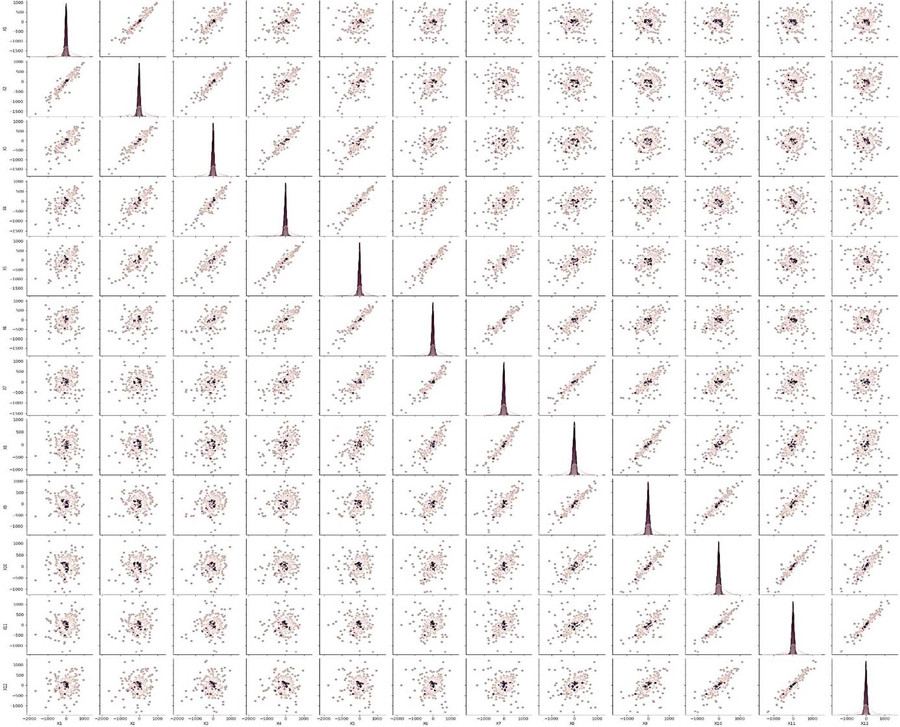
Figure 7 Visualization of distribution between all twelve features with five classification category in Bonn dataset.
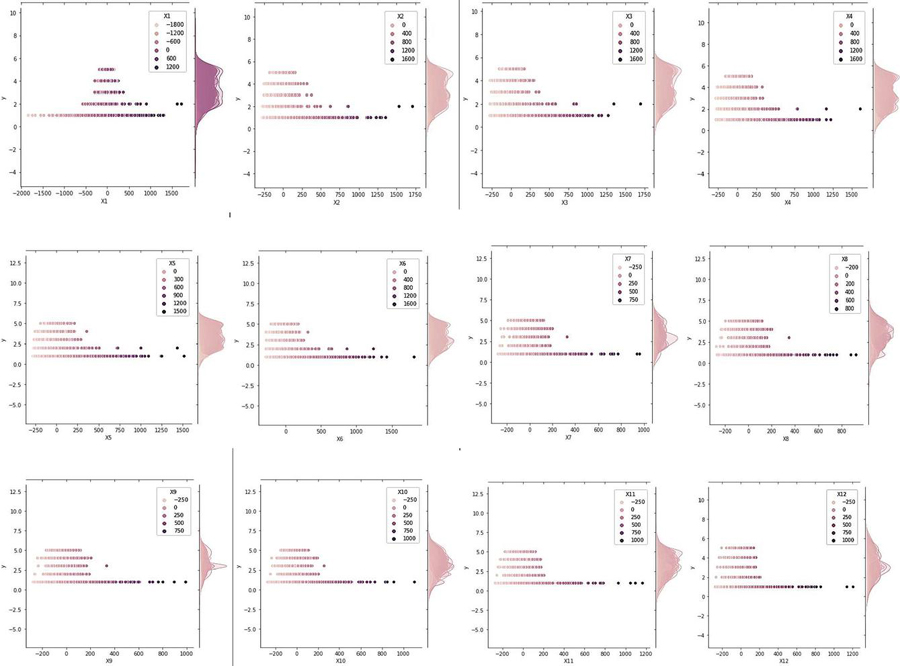
Figure 8 Correlation matrices of extracted features from dataset by University of Bon, Germany.
4 Results and Discussion
The results attained using the proposed seizure prediction module and the comparative evaluation for proving the efficiency of hybrid seek-based ensemble classifier in seizure prediction module is discussed in this section.
4.1 Experimental Setup
The analysis is executed in PYTHON tool installed in Windows 10 OS and 64-bit OS with 16GB RAM and performance analysis is done on rapid miner tool for scientific visualization.
4.2 Evaluation Metrics
The performance measures on the basis of accuracy sensitivity and specificity are presented in the Table 4. it is based on the comparative analysis of the results after running the models for both LGBM and XGBoost of the feature extracted from the dataset of University of Bonn, Germany used in the analysis and prediction of seizures present or absent.
Performance indicators: all the performance indictor used in comparative analysis for both models with their recoded value are presented here from (i) to (viii) with standard parameter.
(i) Accuracy LGBM accuracy: 77.34% 1.30% (micro average: 89.88%) XGBoost accuracy: 92.31% 1.34% (micro average: 92.94%)
| (1) |
(ii) Classification error LGBM accuracy: 40.12% 1.30% (micro average: 40.12%) XGBoost classification error: 34.06% 1.30% (micro average: 40.06%)
| (2) |
(iii) AUC: It represent the area under the receiver operating characteristic curve. LGBM AUC: 0.784 0.019 (micro average: 0.784) (positive class: range1) XGBoost AUC: 0.868 0.017 (micro average: 0.868) (positive class: range1)
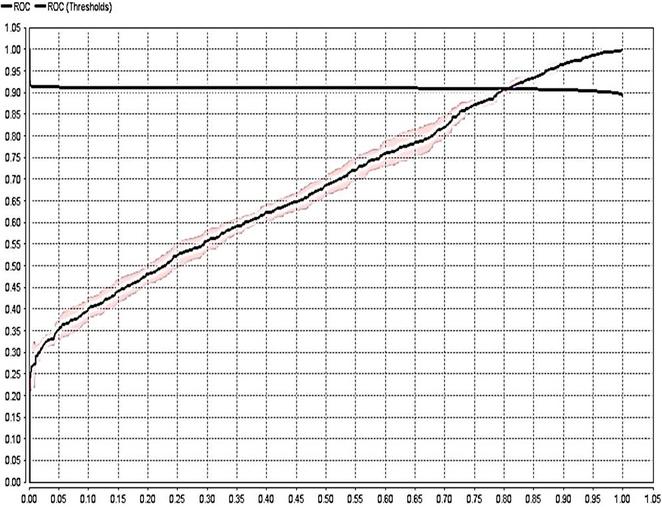
Figure 9 ROC Curve for LGBM.
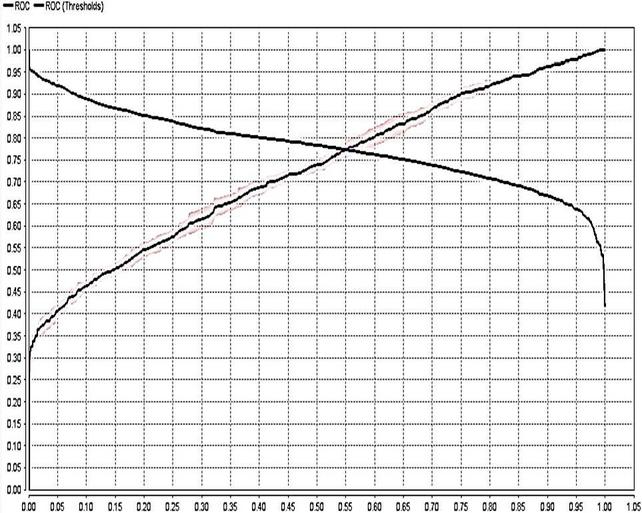
Figure 10 ROC curve for XGBoost.
(iv) Precision LGBM Precision: 100% 1.30% (micro average: 100.0%) (positive class: range1) XGBoost Precision: 99.85% 1.32% (micro average: 94.85%) (positive class: range1)
| (3) |
Table 3 Confusion matrix of LGBM vs. XGBoost
| LGBM | XGBoost | |||||
| True | True | Class | True | True | Class | |
| Value | Range2 | Range1 | Precision | Range2 | Range1 | Precision |
| pred. range2 | 0 | 0 | 0.00% | 5 | 3 | 62.50% |
| pred. range1 | 1318 | 1967 | 59.88% | 1313 | 1964 | 59.93% |
| class recall | 0.00% | 100.00% | 0.38% | 99.85% |
(v) Recall LGBM Recall: 100.00% 0.00% (micro average: 100.00%) (positive class: range1) XGBoost Recall: 99.85% 0.23% (micro average: 99.85%) (positive class: range1)
| (4) |
(vi) F1-Measure LGBM F1-Measure: 84.90% 1.02% (micro average: 74.90%) (positive class: range1) XGBoost F1-Measure: 85.0% 1.04% (micro average: 74.90%) (positive class: range1)
| (5) |
(vii) Sensitivity LGBM Sensitivity: 75.21% 0.00% (micro average: 100.00%) (positive class: range1) XGBoost Sensitivity: 90.18% 0.23% (micro average: 100.0%) (positive class: range1)
| (6) |
(viii) Specificity LGBM Specificity: 83.0% 0.00% (micro average: 0.00%) (positive class: range1) XGBoost Specificity: 90.4% 0.38% (micro average: 0.38%) (positive class: range1)
| (7) |
Table 4 Performance measure dataset of Bonn university data set using LGBM and XGBoost
| LGBM | XGBoost | |||
| Criterion | Value | Standard Deviation | Value | Standard Deviation |
| Accuracy | 77.34 | 1.30 | 92.31 | 1.34 |
| Classification Error | 40.12 | 1.30 | 34.06 | 1.30 |
| AUC | 78.40 | 1.90 | 86.80 | 1.70 |
| Precision | 100.0 | 1.30 | 99.85 | 1.32 |
| Recall | 100.0 | 0.00 | 99.85 | 0.23 |
| F1-Measure | 84.90 | 1.02 | 85.00 | 1.04 |
| Sensitivity | 75.21 | 0.00 | 90.18 | 0.23 |
| Specificity | 83.00 | 0.00 | 90.04 | 0.38 |
In our findings we observed that for LGBM model accuracy is 77.34% 1.30% (micro average: 59.88%) and for XGBoost model accuracy is 92.31% 1.34% (micro average: 59.94%). Classification error in LGBM accuracy: 40.12% 1.30% (micro average: 40.12%) And for XGBoost classification error is 34.06% 1.30% (micro average: 34.06%). AUC which represent the area under the receiver operating characteristic curve present in the figure 9 and figure 10 and measure for LGBM AUC is 0.784 0.019 (micro average: 0.784) (positive class: range1) And for XGBoost AUC is 0.868 0.017 (micro average: 0.868) (positive class: range1). The observed Precision for LGBM Precision: 100.0% 1.30% (micro average: 100.0%) (positive class: range1) and for XGBoost Precision it is 99.85% 1.32% (micro average: 99.85%) (positive class: range1). Recall in case of LGBM is almost 100.00% 0.00% (micro average: 100.00%) (positive class: range1) but in case of XGBoost Recall is around 99.85% 0.23% (micro average: 99.85%) (positive class: range1). F1-Measure for LGBM is 84.90% 1.02% (micro average: 84.90%) (positive class: range1) and in XGBoost F1-Measure calculated as 85.0% 1.04% (micro average: 85.90%) (positive class: range1). Sensitivity value for LGBM is 75.21% 0.00% (micro average: 71.21%) (positive class: range1) and for XGBoost Sensitivity is 90.18% 0.23% (micro average: 90.18%) (positive class: range1). In last Specificity calculated for LGBM is 83.0% 0.00% (micro average: 0.00%) (positive class: range1) and for XGBoost Specificity is 90.04% 0.38% (micro average: 90.04%) (positive class: range1).
4.3 Scientific Discussion of Findings of Gradient Boosted model with Hyperparameter Optimization
Stochastic Gradient Boosting Machine Learning Algorithm can be implemented by Extreme Gradient Boosting or XGBoost or Tree Boosting in a very efficient technique with a very high performance over a large range of challenging machine learning problems [44]. Evaluation of the model and reports the mean and standard deviation of the classification accuracy is reported in the above section with all the performance indicator in comparison with the LGBM model. Next for tuning of hyper-parameters in XGBoost Model [45], we can use an optimization algorithm named stochastic hil climbing which focus on four key hyper-parameters in ensemble (i) Learning Rate: it controls the contribution of each tree with sensible values in range of 0 and 1 (i.e. 1e-8) (ii) Number of Trees: it controls the size (i.e. more trees create more impact to a point of diminishing returns),with sensible values are in range of 1 tree to thousands of trees. (iii) Subsample Percentage: this define the random sample size used for training each tree (i.e. percentage of the size of original dataset) and values are in range of 1 and 0 (e.g. 1e-8) and last is (iv) Tree Depth: which is the number of levels in each tree as we know the deeper trees are more specific to the training dataset and perhaps overfit while shorter trees often generalize better [46]. Sensible values are in range of 1 and 10 or 20. Now we designed a standard deviation of distribution (i.e. step size) separately in line rather than as arguments because each hyper-parameter has different range and we want to keep things simple [47]. So we chose step sizes arbitrary and values are rounded after a small trial and error which shows the best result with learning rate of about 0.10, no. of trees are 150, subsample rate of about 50 percent, and large depth of 7 levels. This configuration resulted in mean accuracy of about 99.9 percentage, better than the default configuration that achieved an accuracy of about 76.8 percentage. The Lift chart which represent the tradeoff between population and targets are depicted in Figure 11.

Figure 11 Lift chart representing trade-off between population and targets.
LGBM Parameter set: classification error: 38.55% 1.26% (micro average: 38.55%) and Confusion Matrix is presented here as:
Table 5 Confusion matrix (row labels: actual class; column labels: predicted class)
| Range2 | Range1 | Error | Rate | |
| Range2 | 2414 | 2314 | 0.0067 | 42/4,140 |
| Range1 | 346 | 1826 | 0.0071 | 71/6,210 |
| Totals | 2760 | 4140 | 0.0083 | 84/10,350 |
Other parameters value and range are as follow: Model PO.number_of_trees 60 & Model PO.maximal_depth 7.
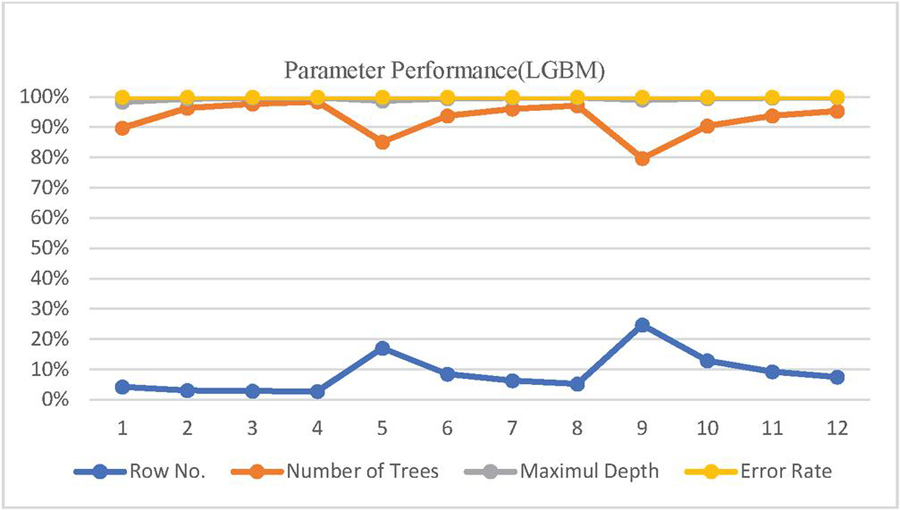
Figure 12 Parameter performance of LGBM.
In comparison with XGBoost Model the Metrics Type is Binomial, model id is rm-h2o-model-.production_model_po-35983 and frame id is rm-h2o-frame-production_model_po-35983 the value of MSE is 0.020399252, value of RMSE is 0.14282595, calculated R2 is 0.9150031, the value of AUC is equal to 0.9998297, pr_auc is 0.99988544, log loss calculated as 0.1083806, mean_per_class_error is around 0.005273752 and default threshold is around 0.6076560616493225. The confusion Matrix which depict the Row labels, Actual class, Column labels and predicted class, is presented here as:
Table 6 Confusion matrix (row labels: actual class; column labels: predicted class)
| Range2 | Range1 | Error | Rate | |
| Range2 | 4117 | 23 | 0.0056 | 23/4,140 |
| Range1 | 31 | 6179 | 0.0050 | 31/6,210 |
| Totals | 4148 | 6202 | 0.0052 | 54/10,350 |
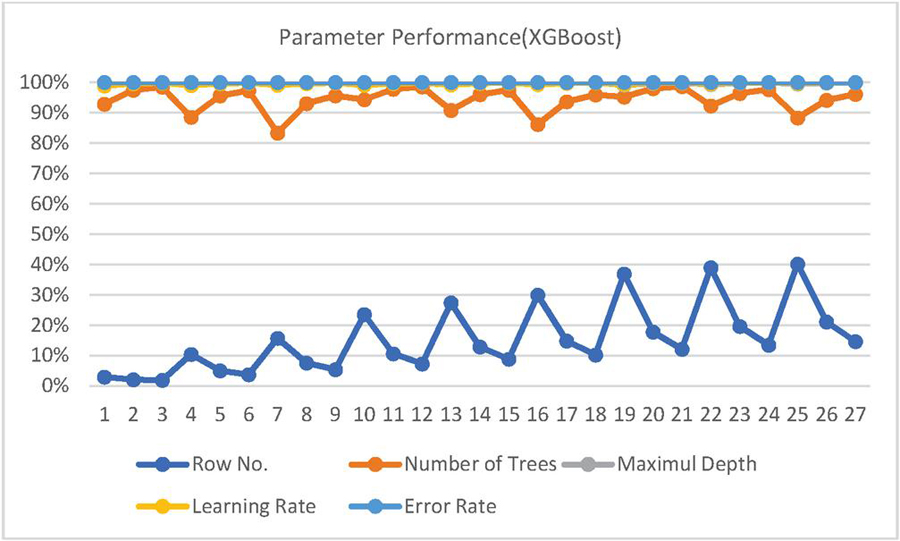
Figure 13 Parameter performance of XGBoost.
Gains/Lift Table (Avg response rate: 60.00%, avg score: 60.00%).
Model Summary (XGBoost) of the XGBoost Model is concluded here with its findings as: Number of generated Trees are 150 with Number of Internal Trees are having the same value as 150. The total size of the model build in bytes is 202079. Minimum depth is equal to 7 and maximum depth is also same as 150 with Mean Depth is equal to 7.00000. The minimum leaves observed are 43 and maximum leaves are 122 with mean leaves is equal to 102.69334.
4.4 Correlation Analysis Methodology to Identify Strong Predictor Attributes
Correlation analysis is used in determination of the strength of a relationship between even two independent variables or in dependent and an independent variable [48]. Correlation coefficient is the key parameter which is depends on a certain predetermine range of the particular algorithm to identify the value of the strength which is based on dispersion strength, form and direction and can be identified from the Figure 14. Based on the value of the correlation coefficient in the given range we can identify which independent variables can have stronger impacts on the dependent variables which leads us to predict the outcome of a dependent variable more efficiently. Pearson’s correlation coefficient can be calculated using the following formula for two variable X and Y is:
| (8) |
Where : Correlation coefficient, Covariance(A,B) is covariance is standard deviation of X and is is standard deviation of Y. If we have dataset with two different sets i.e. {x, x,…x} and {y, y,…y} the we can calculate the correlation coefficient using formula:
| (9) |
Where n is represented here as sample size x and y are the i data value and and are representing the mean value, the range of C is 1 (strong negative correlation) (strong positive correlation) and zero is for no relation [49].
In our research for seizure analysis and prediction, the independent attributes come from the available dataset for University of Bonn Germany (physiological signals dataset). For correlation coefficient evaluation are combined with the results based on ensembles methods of machine learnings for observation of the changes in accuracies which was consistent with the result of the correlation analysis.
4.5 Correlation-based Attribute Ranking
The Rapid miner platform provides some mechanisms for feature selection and techniques to select relevant parameters in order to optimize the performance the machine learning models. This technique assigns weights basis on evaluation criteria to the given features which are most suitable and involved in model for their ranking and filteration. There are many such techniques like Gain ratio attribute, Chi square and Classifier subset evaluation. On the basis of this, features which are highly correlated with dependent class and not correlated with each other are considered for Ensemble Learnings and Machine Learning models. Feature set and their merits are evaluated on the formula:
| (10) |
Here Merit is the ranking criteria for evaluation of feature set and shows the correlation between dependent class and feature set shown in Figure 13. In the formula is the number of features, the average of correlations between dependent class and features is represented as and is the average of correlations between features [50].

Figure 14 Correlation between dependent class and feature set.
Factors which are considered for the evaluation of feature set in this equations are as (a) If the value of correlation among the features is very high then it shows that correlation between dependent class and feature set is low. (b) If correlation between the features and dependent class is high then it shows that correlation between dependent class and feature set is high. (c) If number of features are high then correlation between dependent class and feature set is high. This ranking technique is used in rapid miner tool for feature selection and presented this research paper.
5 Conclusion
In this paper, we presented a detailed review of techniques used in predicting seizures in EEG and we also discussed some method for classification of EEG signals based on the Ensemble Learning method LGBM and XGBoost by preprocessing the dataset of university of Bonn with feature engineering using Principal component analysis (PCA) in rapid miner for dimensionality reduction and Correlation-based Attribute Ranking for performance evaluation in the UoB data set in binary classification based on most likely range is done. To validate the result a performance based analysis is performed and presented for the evaluation. Results are compared with models like LGBM and XGBoost for evaluation based on same data set and presented with ROC curves and other parameters for the comparison purpose. A comparative analysis with other existing models for performance evaluation in terms of accuracy which is 87.34 and 92.31 for LBGM and XGBoost, sensitivity of 85.21 and 90.18 and specificity of 83.0 and 90.04 for LBGM and XGBoost. In last, this method indicates that the ensemble learning methods has significant high practical value compared to other existing methods and can be applied in the research of BCI technology which may improve the life of the person suffering from the mental health issues like seizures which is some time a life treating if proper analysis and treatment is not done and this research work can be helpful in this direction and improve the quality of life of such peoples.
Declaration and Statements
Author Contributions: Conceptualization, Bhaskar Kapoor; Data curation, Bhaskar Kapoor; Formal analysis, Bhaskar Kapoor; Methodology, Bhaskar Kapoor; Supervision, Bharti Nagpal; Visualization, Bhaskar Kapoor and Bharti Nagpal; Writing – original draft, Bhaskar Kapoor; Writing – review & editing Bharti Nagpal. Results analysis by Bhaskar Kapoor and Bharti Nagpal. The entire work have been done under the supervision of Bharti Nagpal. All authors have read and agreed to the published version of the manuscript.
Credit Author Statement: The authors declare that they have no known competing financial interests or personal relationships that could have appeared to influence the work reported in this paper.
Conflicts of Interest: The authors declare that there are no conflicts of interest regarding the publishing of this paper.
Availability of Data and Material: All relevant data are included in the paper or its Supplementary Information.
Funding: Not applicable.
References
[1] Bairagi, V. EEG signal analysis for early diagnosis of Alzheimer’s disease using spectral and wavelet based features. Int. j. inf. tecnol. 10, 403–412 (2018). https://doi.org/10.1007/s41870-018-0165-5 (Journal).
[2] Chakraborti, S., Choudhary, A., Singh, A. et al. A machine learning-based method to detect epilepsy. Int. j. inf. tecnol. 10, 257–263 (2018). https://doi.org/10.1007/s41870-018-0088-1 (Journal).
[3] Berg, A.T., Berkovic, S.F., Brodie, M.J., Buchhalter, J., Cross, J.H., Van Emde Boas, W., Engel, J., French, J., Glauser, T.A., Mathern, G.W., Moshé, S.L., Nordli, D., Plouin, P. and Scheffer, I.E. (2010), Revised terminology and concepts for organization of seizures and epilepsies: Report of the ILAE Commission on Classification and Terminology, 2005–2009. Epilepsia, 51: 676–685. https://doi.org/10.1111/j.1528-1167.2010.02522.x (Journal).
[4] Dias, N. S., Kamrunnahar, M., Mendes, P. M., Schiff, S. J., and Correia, J. H. (2007). Comparison of EEG pattern classification methods for brain-computer interfaces. Annual International Conference of the IEEE Engineering in Medicine and Biology – Proceedings, 2540–2543. (Conference).
[5] Gotman J. Automatic seizure detection: improvements and evaluation. Electroencephalogr Clin Neurophysiol. 1990;76(4):317–324. (Journal).
[6] Gupta, M.K., Chandra, P. A comprehensive survey of data mining. Int. j. inf. tecnol. 12, 1243–1257 (2020). https://doi.org/10.1007/s41870-020-00427-7 (Journal).
[7] Le Van Quyen, M., Martinerie, J., Navarro, V., Boon, P., D’Havé, M., Adam, C., Renault, B., Varela, F. and Baulac, M., “Anticipation of epileptic seizures from standard EEG recordings”, The Lancet, vol. 357, no. 9251, pp. 183–188, 2001. (Journal).
[8] Büyükçakır, B., Elmaz, F. and Mutlu, A.Y., “Hilbert vibration decomposition-based epileptic seizure prediction with neural network”, Computers in biology and medicine, vol. 119, pp. 103665, 2020. (Journal).
[9] Hirald Dwaraka Praveena, C. Subhas and K. Rama Naidu, “Automatic epileptic seizure recognition using reliefF feature selection and long short term memory classifier”, Journal of Ambient Intelligence and Humanized Computing, 2020. (Journal).
[10] Athar A. Ein Shoka, Monagi H. Alkinani, A. S. El-Sherbeny, Ayman El-Sayed and Mohamed M. Dessouky, “Automated seizure diagnosis system based on feature extraction and channel selection using EEG signals,” Brain Informatics, vol. 8, no. 1, 2021. (Journal).
[11] Ratnaprabha Ravindra Borhade and Nagmode, M.S., “Modified Atom Search Optimization-based Deep Recurrent Neural Network for epileptic seizure prediction using electroencephalogram signals”, Biocybernetics and Biomedical Engineering, vol. 40, no. 4, pp. 1638–1653, 2020. (Journal).
[12] Prathaban, B.P. and Balasubramanian, R., “Prediction of epileptic seizures using Grey Wolf Optimized Model Driven mathematical approach”, Microprocessors and Microsystems, pp. 103370, 2020. (Journal).
[13] Mustafa Sameer and Bharat Gupta, “Detection of epileptical seizures based on alpha band statistical features”, Wireless Personal Communications, vol. 115, pp. 909–925, 2020.
[14] Thara, D.K., PremaSudha, B.G. and Xiong, F., “Epileptic seizure detection and prediction using stacked bidirectional long short term memory”, Pattern Recognition Letters, vol. 128, pp. 529–535, 2019.
[15] Marzieh Savadkoohi, Oladunni, T. and Thompson, L., “A machine learning approach to epileptic seizure prediction using Electroencephalogram (EEG) Signal”, Biocybernetics and Biomedical Engineering, vol. 40, no. 3, pp. 1328–1341, 2020.
[16] Afshin Shoeibi, Navid Ghassemi, Roohallah Alizadehsani, Modjtaba Rouhani, Hossein Hosseini-Nejad, Abbas Khosravi, Maryam Panahiazar, Saeid Nahavandi, A comprehensive comparison of handcrafted features and convolutional autoencoders for epileptic seizures detection in EEG signals, Expert Systems with Applications, Volume 163, 2021, 113788, ISSN 0957-4174, https://doi.org/10.1016/j.eswa.2020.113788 (Journal).
[17] Jukic S, Saracevic M, Subasi A, Kevric J. Comparison of Ensemble Machine Learning Methods for Automated Classification of Focal and Non-Focal Epileptic EEG Signals. Mathematics. 2020; 8(9):1481. https://doi.org/10.3390/math8091481 (Journal).
[18] Rekha Sahu, Satya Ranjan Dash, Lleuvelyn A Cacha, Roman R Poznanski, Shantipriya Parida. Epileptic seizure detection: a comparative study between deep and traditional machine learning techniques. Journal of Integrative Neuroscience, 2020, 19(1): 1–9. (Journal).
[19] Saleh A. Alshebeili, Ahmed Sedik, Basma Abd El-Rahiem, Turky N. Alotaiby, Ghada M. El Banby, Heba A. El-Khobby, Mahmoud A.A. Ali, Ashraf A.M. Khalaf, Fathi E. Abd El-Samie, Inspection of EEG signals for efficient seizure prediction, Applied Acoustics, Volume 166, 2020, 107327, ISSN 0003-682X, https://doi.org/10.1016/j.apacoust.2020.107327 (Journal).
[20] Siddiqui, M. K., Morales-Menendez, R., Huang, X., and Hussain, N. (2020). A review of epileptic seizure detection using machine learning classifiers. Brain informatics, 7, 1–18. (Journal).
[21] Hosseini, M. P., Hajisami, A., and Pompili, D. (2016, July). Real-time epileptic seizure detection from eeg signals via random subspace ensemble learning. In 2016 IEEE international conference on autonomic computing (ICAC) (pp. 209–218). IEEE. (Conference).
[22] Hosseini, M. P., Pompili, D., Elisevich, K., and Soltanian-Zadeh, H. (2018). Random ensemble learning for EEG classification. Artificial intelligence in medicine, 84, 146–158. (Journal).
[23] Hosseini, M. P., Hosseini, A., and Ahi, K. (2020). A Review on Machine Learning for EEG Signal Processing in Bioengineering. IEEE reviews in biomedical engineering. (Journal)
[24] Ren, W., Han, M. Classification of EEG Signals Using Hybrid Feature Extraction and Ensemble Extreme Learning Machine. Neural Process Lett 50, 1281–1301 (2019). https://doi.org/10.1007/s11063-018-9919-0 (Journal).
[25] Abdulhay, E., Elamaran, V., Chandrasekar, M., Balaji, V. S., and Narasimhan, K. (2017). Automated diagnosis of epilepsy from EEG signals using ensemble learning approach. Pattern Recognition Letters. (Journal).
[26] Usman, S. M., Usman, M., and Fong, S. (2017). Epileptic seizures prediction using machine learning methods. Computational and mathematical methods in medicine, 2017. (Journal).
[27] Bhattacharyya, S., Konar, A., Tibarewala, D. N., Khasnobish, A., and Janarthanan, R. (2014, January). Performance analysis of ensemble methods for multi-class classification of motor imagery EEG signal. In Proceedings of The 2014 International Conference on Control, Instrumentation, Energy and Communication (CIEC) (pp. 712–716). IEEE. (Conference).
[28] Khakon Das, Debashis Daschakladar, Partha Pratim Roy, Atri Chatterjee, Shankar Prasad Saha, “Epileptic seizure prediction by the detection of seizure waveform from the pre-ictal phase of EEG signal,” Biomedical Signal Processing and Control, Vol. 57, 2020. (Journal).
[29] Marzieh Savadkoohi, Timothy Oladunni, and Lara Thompson, “A machine learning approach to epileptic seizure prediction using Electroencephalogram (EEG) Signal”, Biocybernetics and Biomedical Engineering, vol. 40, no. 3, pp. 1328–1341, 2020. (Journal).
[30] Itaf Ben Slimen, Larbi Boubchir, and Hassene Seddik, “Epileptic seizure prediction based on EEG spikes detection of ictal-preictal states”, The journal of biomedical research, vol. 34, no. 3, 2020. (Journal).
[31] Syed Muhammad Usman, Shehzad Khalid, and Zafar Bashir, “Epileptic seizure prediction using scalp electroencephalogram signals”, Biocybernetics and biomedical engineering, vol. 41, pp. 1–10, 2021 (Journal).
[32] Satapathy, S. K., Dehuri, S., and Jagadev, A. K. (2016). An empirical analysis of different machine learning techniques for classification of EEG signal to detect epileptic seizure. International Journal of Applied Engineering Research, 11(1), 120–129. (Journal).
[33] Imah, E. M., and Widodo, A. (2017, October). A comparative study of machine learning algorithms for epileptic seizure classification on eeg signals. In 2017 International Conference on Advanced Computer Science and Information Systems (ICACSIS) (pp. 401–408). IEEE. (Conference).
[34] Usman, S. M., Usman, M., and Fong, S. (2017). Epileptic seizures prediction using machine learning methods. Computational and mathematical methods in medicine, 2017. (Journal).
[35] Sun, S., Zhang, C., and Zhang, D. (2007). An experimental evaluation of ensemble methods for EEG signal classification. Pattern Recognition Letters, 28(15), 2157–2163. (Journal).
[36] Abbasi, B., and Goldenholz, D. M. (2019). Machine learning applications in epilepsy. Epilepsia, 60(10), 2037–2047. (Journal).
[37] Abualsaud, K., Mahmuddin, M., Saleh, M., and Mohamed, A. (2015). Ensemble classifier for epileptic seizure detection for imperfect EEG data. The Scientific World Journal, 2015. (Journal).
[38] Bhattacharyya, S., Konar, A., Tibarewala, D. N., Khasnobish, A., and Janarthanan, R. (2014, January). Performance analysis of ensemble methods for multi-class classification of motor imagery EEG signal. In Proceedings of The 2014 International Conference on Control, Instrumentation, Energy and Communication (CIEC) (pp. 712–716). IEEE. (Journal).
[39] Sun, S., Zhang, C., and Zhang, D. (2007). An experimental evaluation of ensemble methods for EEG signal classification. Pattern Recognition Letters, 28(15), 2157–2163. (Journal).
[40] Jukic S, Saracevic M, Subasi A, Kevric J. Comparison of Ensemble Machine Learning Methods for Automated Classification of Focal and Non-Focal Epileptic EEG Signals. Mathematics. 2020; 8(9):1481. https://doi.org/10.3390/math8091481 (Journal).
[41] Wang, S., Li, Y., Wen, P., and Lai, D. (2016). Data selection in EEG signals classification. Australasian physical & engineering sciences in medicine, 39(1), 157–165. (Journal).
[42] Andrzejak, R. G., Lehnertz, K., Mormann, F., Rieke, C., David, P., and Elger, C. E. (2001). Indications of nonlinear deterministic and finite-dimensional structures in time series of brain electrical activity: Dependence on recording region and brain state. Physical Review E, 64(6), 061907. (Journal).
[43] University of bonn Database, https://epilepsy.uni-freiburg.de/database (Accessed on June 2022).
[44] Putatunda, S., and Rama, K. (2018, November). A comparative analysis of hyperopt as against other approaches for hyper-parameter optimization of XGBoost. In Proceedings of the 2018 International Conference on Signal Processing and Machine Learning (pp. 6–10). (Conference).
[45] S.-E. Ryu, D.-H. Shin and K. Chung, “Prediction Model of Dementia Risk Based on XGBoost Using Derived Variable Extraction and Hyper Parameter Optimization,” in IEEE Access, vol. 8, pp. 177708–177720, 2020, doi: https://doi.org/10.1109/ACCESS.2020.3025553 (Journal).
[46] Sommer, J., Sarigiannis, D., and Parnell, T. (2019). Learning to Tune XGBoost with XGBoost. arXiv preprint arXiv:1909.07218. (Journal).
[47] Wang, Y., and Ni, X. (2019). A XGBoost risk model via feature selection and Bayesian hyper-parameter optimization. ArXiv, abs/1901.08433. (Journal).
[48] Han, J., Pei, J., and Kamber, M. (2011). Data mining: concepts and techniques. Elsevier. (Journal).
[49] Kumar, S., and Chong, I. (2018). Correlation Analysis to Identify the Effective Data in Machine Learning: Prediction of Depressive Disorder and Emotion States. International journal of environmental research and public health, 15(12), 2907. https://doi.org/10.3390/ijerph15122907. (Journal).
[50] Hall, M.A. (2003). Correlation-based Feature Selection for Machine Learning (Web source).
Biographies

Bhaskar Kapoor is PhD Scholar in Department of Computer Science Engineering Guru Gobind Singh Indraprastha University Delhi. He has done Master of Engg in (CTA) from Delhi College of Engineering (Delhi University) and Bachelor of Engg (CSE) from J.S.S. Noida. He is Member of ISTE, IEEE. He taught Courses for B.Tech. (CSE/IT/AI&DS/ITE). His research areas of interest include EEG Signal Processing, Machine Learning & Deep Learning, Brain Computer Interface (BCI) Devices, Computer Vision, Semantic Web & Ontologies. He has presented & published various research papers in International Journals and International Conferences (Elsevier Springer, IEEE Xplore, MDPI and IET).

Bharti Nagpal is currently working as Assistant Professor in CSE Department at Netaji Subhas University of Technology East Campus, Delhi, India. She has 21 years of teaching experience. Her areas of interest are Machine Learning, Information Security, Data Science.
Journal of Mobile Multimedia, Vol. 20_2, 359–390.
doi: 10.13052/jmm1550-4646.2025
© 2024 River Publishers