Determining Smart Phone Sensing and K-Means Clustering for Accurate and Timely Railway Track Joint Fault Diagnosis
Ali Akbar Shah1, Abi Waqas Memon2, M. A. Uqaili1, Bhawani Shankar Chowdhry2, Tanweer Hussain3 and Tauha Hussain Ali4
1School of Mechanical and Manufacturing Engineering, Dublin City University, Ireland
2Department of Telecommunication Engineering, MUET, Jamhoro, Pakistan
3Department of Mechanical Engineering, MUET, Jamshoro, Pakistan
4Department of Civil Engineering, MUET, Jamshoro, Pakistan
E-mail: shah.aliakber32@gmail.com; abi.waqas@faculty.muet.edu.pk; aslam.uqaili@faculty.muet.edu.pk; bhawani.chowdhry@faculty.muet.edu.pk; tanweer.hussain@faculty.muet.edu.pk; vc@admin.muet.edu.pk
*Corresponding Author
Received 22 February 2023; Accepted 17 August 2023; Publication 07 February 2024
Abstract
The railway track joint is an important component that connects two sections of the rail and ensures a smooth and safe operation of trains. However, the joint is also a critical point of failure that can lead to train derailments and accidents. Therefore, accurate and timely detection of joint faults is crucial for ensuring the safety and reliability of railway transportation. In this paper, we propose a novel approach for railway track joint fault diagnosis using smart phone sensing and k-means clustering. Our approach utilizes the accelerometer sensor of a smart phone to measure the vibrations and movements of a specifically developed railway shoe stick that is employed on an actual railway track for the condition monitoring of the railway tracks. More than 60000 data values are collected and are then processed and analysed using k-means clustering, a popular unsupervised machine learning technique that groups similar data points together. The K means clustering in this study forms 3 clusters as a result. The 3 clusters after being validated on the track by virtue of visual inspection are determined to be acceleration values of the healthy track, track with higher joint gap than the standardized value and super-elevated railway track joint fault(s), respectively. In addition to its high accuracy and efficiency, our approach has several advantages over traditional methods, such as low cost, easy deployment, and high scalability. Moreover, the smart phone sensing technology can be easily integrated with existing train monitoring systems, making it a useful tool for real-time joint fault diagnosis and maintenance. Overall, this study demonstrates the potential of smart phone sensing and k-means clustering for railway track joint fault diagnosis and highlights the need for further research in this field.
Keywords: Railway track joint, derailment railway shoe stick, mobile sensing, accelerometer, K-means clustering, healthy track, track with higher joint gap, super-elevated railway track joint fault.
1 Introduction
For many developing nations, like Pakistan, the railway network is an essential means of transportation. The effective and quick movement of people and cargo through the railway system is essential to a nation’s economy [1]. The railroad network is getting increasingly complex, loaded, and prone to damage as a result of the rise in passengers. Environmental factors and mechanical causes both hasten the deterioration of railroad rails concurrently [2]. In order to prevent accidents and minimize injuries and casualties, it is crucial to examine rail tracks which is the most vital and important components of the railway network [3].
In Pakistan, a significant percentage of the population relies on the railroad for a risk-free and secure means of transportation. But from 2012 to 2017 [4], there were 757 train accidents in Pakistan, with 125 accidents on an average per year. The United States (US) also experiences more accidents than other countries, despite developing nations having a larger ratio of train accidents. In 2019, a total of 11,434 train accidents were reported in USA, resulting in 937 fatalities and 7730 injured [5].
Figure 1 provides an annual breakdown of accidents in the US. Due to neglect or human mistake, the examination of rail tracks can result in an increase in fatalities and injuries. This is demonstrated by the train accidents in Pakistan and the US, which put the lives of hundreds of thousands of people in danger. Numerous lives can be saved and the financial losses to the railway network can be reduced with proper inspection and prompt defect identification [6].
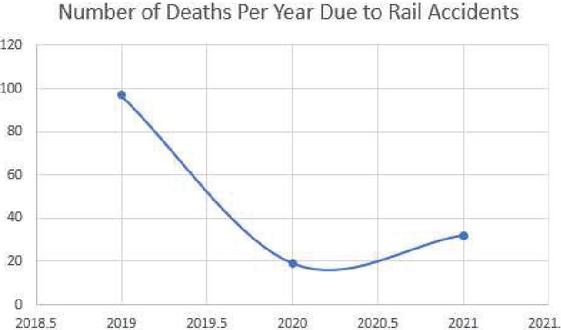
Figure 1 Number of deaths per year due to rail accidents [7].
There are several technologies currently used for railway track condition monitoring. One of the most common is ultrasonic testing, which uses high-frequency sound waves to detect internal defects in the rails. This method is non-destructive and can detect cracks, fissures, and other defects that may not be visible to the naked eye [8, 9].
Another technology used for railway track condition monitoring is eddy current testing [10]. This method uses electromagnetic fields to detect surface and subsurface defects in the rails. Eddy current testing is also non-destructive and can detect cracks, corrosion, and other defects [11].
Thermography is also used for railway track condition monitoring. This method uses infrared cameras to detect hot spots in the rails, which can indicate the presence of internal defects [12]. Thermography can also be used to detect issues with the track’s infrastructure, such as problems with the ballast or the subgrade.
Yet another technology used for railway track condition monitoring is ground-penetrating radar [13]. This method uses radar waves to create a map of the subgrade beneath the tracks, which can be used to detect subsidence, landslides, and other issues that can affect track stability.
Finally, Acoustic Emission Testing is also used for railway track condition monitoring. This method listens for sounds emitted from the rail and can be used to detect defects such as fatigue, micro-cracks, and other issues that can lead to rail failure [14].
All of these technologies have their own advantages and disadvantages, and they are often used in combination to provide a comprehensive picture of track condition by virtue of walk by inspection or drive by inspection.
2 Types of Railway Track Condition Monitoring
A railway track is typically made up of rails, sleepers (also called ties), and ballast. Rails are the steel bars that the trains run on, sleepers are the wooden or concrete blocks that the rails are laid on, and ballast is the crushed stone that the sleepers are laid on to provide a stable foundation for the track. Some railway tracks also have additional components such as signal systems and electrical systems [15].
To inspect the condition of the railway track, the algorithms and techniques as discussed in the previous section are either applied, using either walk by inspection or drive by inspection [16, 17].
Walk-by inspection is a method of inspecting railway tracks where an inspector physically walks along the track, visually inspecting the track for any defects or issues. This method allows for a detailed examination of the track but can be time-consuming and labour-intensive.
Drive-by inspection, also known as “flangeway inspection,” is a method of inspecting railway tracks where an inspector travels along the track in a vehicle, usually at slow speeds. This method allows for a quick assessment of the track’s condition, but may not be as detailed as a walk-by inspection [18].
Walk-by inspection is generally considered to be more effective than drive-by inspection for diagnosing super elevation faults in rail joints because it allows for a more thorough examination of the rail and the surrounding area. During a walk-by inspection, the inspector is able to closely examine the rail and any potential defects, such as cracks or misalignment, and can also observe the surrounding area for any potential issues that may be contributing to the fault. Additionally, a walk-by inspection allows for a more detailed examination of the ballast and subgrade, that are the main reason for causing super elevation in a rail joint [17].
A super elevation fault in a railway track joint is a problem that can occur when one rail is higher than the other. This can cause issues with the smooth operation of trains and can also lead to increased wear and tear on the tracks and trains. Super elevation faults are typically caused by improper installation or maintenance of the track and can be corrected by adjusting the height of the rails or realigning them to ensure they are at the same level. If super elevation rail joint faults are not diagnosed in a timely manner, it can lead to several problems. The most significant of these is the risk of a derailment. Super elevation rail joint faults can cause the rails to shift or move out of alignment, which can lead to a train running off the tracks. This can cause serious injury or death to passengers and crew, as well as significant damage to the train and the railway infrastructure. Additionally, undiagnosed super elevation rail joint faults can lead to increased wear and tear on the trains, which can result in costly repairs and downtime.
3 Design and Development of a Rail Shoe Stick for Rail Joint Fault Diagnosis
Visual inspection for the inspection of the railway track’s condition is an outdated technique that is prone to human errors. To mitigate these errors an instrumentation is developed to substitute visual inspection for the diagnosis of a super-elevation rail joint faults by using an ordinary smartphone to measures the acceleration.
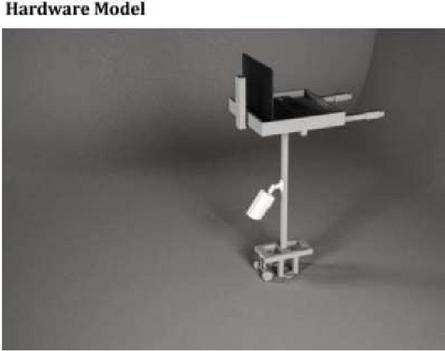
Figure 2 CAD model of novel rail shoe stick.
For that the stick was developed by considering all the railway track parameters and is shown as follow:
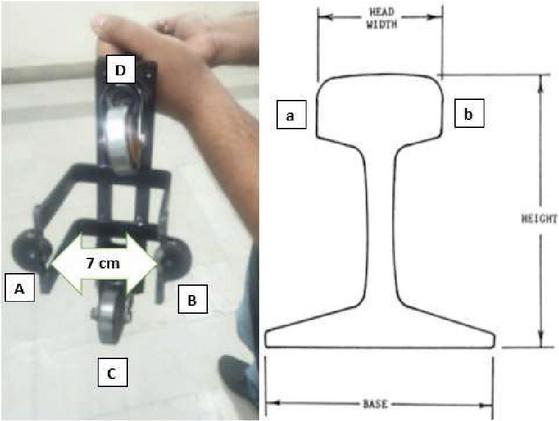
Figure 3 Design parameters of the novel rail shoe stick.
As illustrated in the above figure, A,B,C and D are the metallic wheels (Stainless Steel is considered for this instrumentation due to its minimalist friction ratio) that are used for hovering over the track. A and B cover the entire rail head therefore, they are 7 cm apart from one another for a smooth operation as well as they make sure that the two tracks connected by a rail joint are perfectly aligned. Whereas, D and C are used for moving the stick on a track.
The final developed instrumentation was tested and validated on an auxiliary railway track of National Center of Robotics and Automation – Condition Monitoring Lab, MUET. The readings were recorded in a csv file on a mobile app that was modified for this purpose.

Figure 4 Testing the developed instrumentation in field.
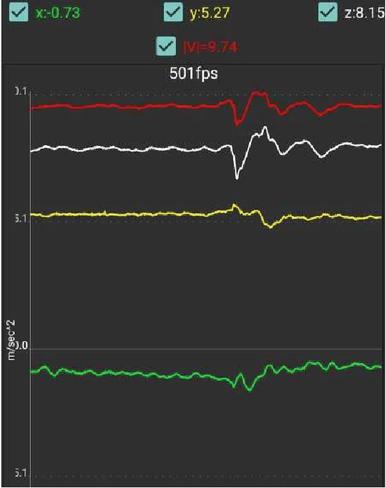
Figure 5 Data acquisition from the accelerometer of the mobile phone.
The mobile phone employed for this data collection was OnePlus 9 5G, which has the following parameters mentioned in the figure below:
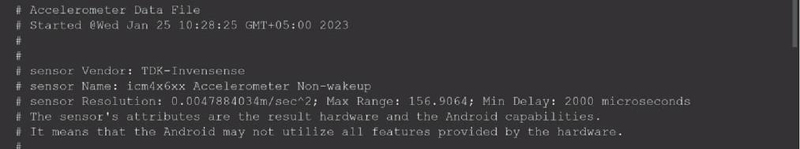
Figure 6 Parameters through which mobile sensing is employed.

Figure 7 Position of mobile.
3.1 Data Collection and Filtration
Data was collected in an operational railway junction of Pakistan. The model of data collection and filtration is mentioned in the block diagram as shown below:
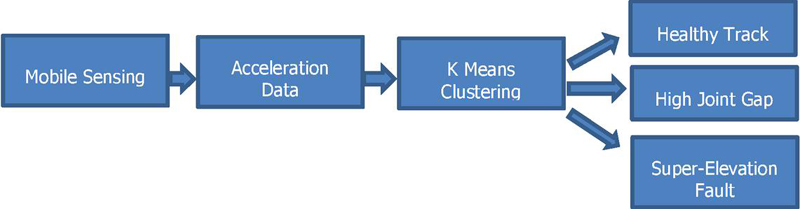
Figure 8 Block diagram.
The data collected from mobile phone was stored in a txt file. The time duration (milli-seconds) was noted along with x, y and z axes of vibrational motion in terms of acceleration (m/(sxs)) were being recorded, during the inspection. The values were separated from one another by a “space”. Therefore for the data filtration, the data in txt was iterated and values were stored in empty arrays of x, y and z by using line.split(“ ”) function of Python IDE. After this operation was performed, the file was saved in a csv format for the further analysis.
The stored was analyzed using graphical representation using matplotlib.pyplot API of Python, result of which is shown in the figure below:
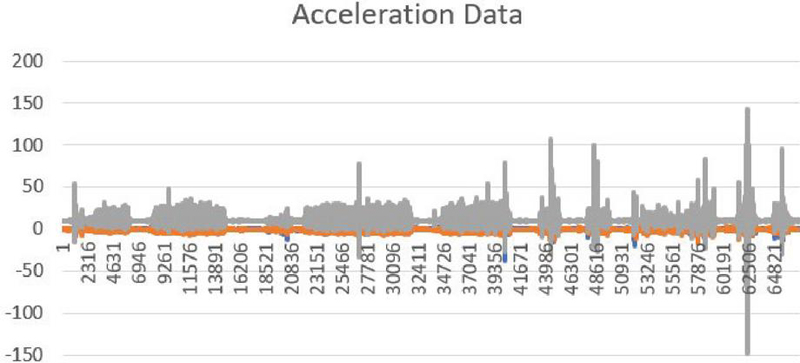
Figure 9 Time vs acceleration graph.
As, the data was collected by walk by inspection so there is noise likely added into this data. Using the traditional techniques, the algorithm would not be able to correctly predict the super-elevation fault. It is because of this; K means clustering for chosen for this approach.
4 K-means Clustering
K-means clustering is a method of vector quantization that is commonly used in machine learning for data compression and clustering analysis. The role of K-means is to partition a set of data points into K clusters, where each cluster is defined by its centroid (i.e. the mean of all the points in the cluster).
To classify super elevation rail joint fault from accelerometer data collected on a railway track using developed instrumentation, K-means clustering is employed on the csv file to identify patterns in the data that are indicative of a fault. For example, the accelerometer data may contain specific patterns or features that are only present when a rail joint is faulty. By clustering the data into different groups, the algorithms/analyst can identify which clusters contain data that is indicative of a fault. After the clusters are being identified, a classifier is trained to recognize the patterns in these clusters as being indicative of a fault, thus allowing the algorithm to classify new data as either faulty or non-faulty.
5 Results
The results of the instrumentation using mobile sensing (accelerometer) and k means clustering showed the following:
Distribution plot of accelerometer’s x, y, and z axes: the plot showed the distribution of acceleration data along each axis and how the data was spread out.
Time vs acceleration graphs of each axis: the graphs showed how the acceleration changed over time for each axis.
Computation of centroids: the centroids were computed to represent the centre of the clusters in the data.
Final graph with 3 clusters: the final graph showed the 3 clusters containing the response of acceleration in healthy track, response of acceleration while there is a rail joint involved, and response of acceleration when there is a super elevated fault.
Overall, the instrumentation and k-means clustering provided a clear representation of the different responses of acceleration for various conditions of the rail joint, allowing for more efficient identification and diagnosis of faults as mentioned as follow:
5.1 Distribution Plot of Accelerometer’s X, Y, and Z Axes
The distribution plot of accelerometer’s x, y, and z axes is a visual representation of the distribution of the acceleration data along each axis. This plot displays how the data is spread out across the x, y, and z axes.
For example, if the x-axis represents the horizontal movement, the y-axis represents the vertical movement, and the z-axis represents the forward/backward movement, then the distribution plot would show the spread of acceleration data along these three directions.
The plot can be used to determine the range of acceleration values, the central tendency (e.g., mean or median), and the spread of the data (e.g., standard deviation or interquartile range). This information can be used to understand the general pattern of the acceleration data and to identify any unusual values or outliers.
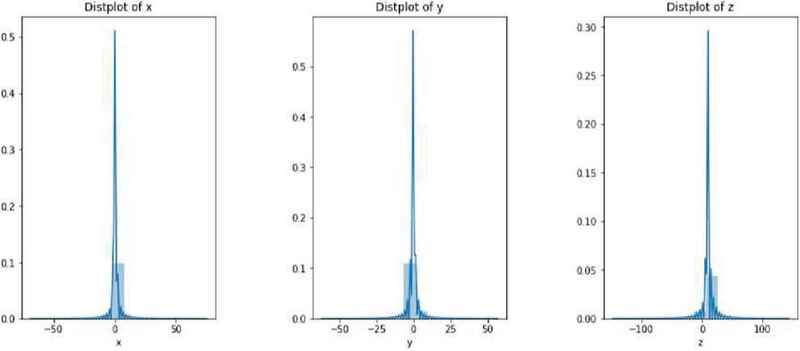
Figure 10 Distribution plot of X, Y and Z axes.
5.2 Time vs Acceleration
The time vs acceleration graphs are line plots that show how the acceleration changed over time for each of the x, y, and z axes. These graphs provide a visual representation of the temporal behaviour of the acceleration along each axis.
In the graph mentioned as below the x-axis represents time, and the y-axis represents acceleration in the result to that, the graph shows the change in acceleration over time for the x-axis, y-axis, and z-axis, respectively. The graphs are employed to identify any irregularity in the trends or patterns in the acceleration data over time, such as a steady increase or decrease, fluctuations, or sudden spikes or drops.
This information is analysed to understand how the acceleration is behaving in response to changes in the rail joint and to identify any unusual behaviours that may indicate a fault or problem as shown in the below figures:
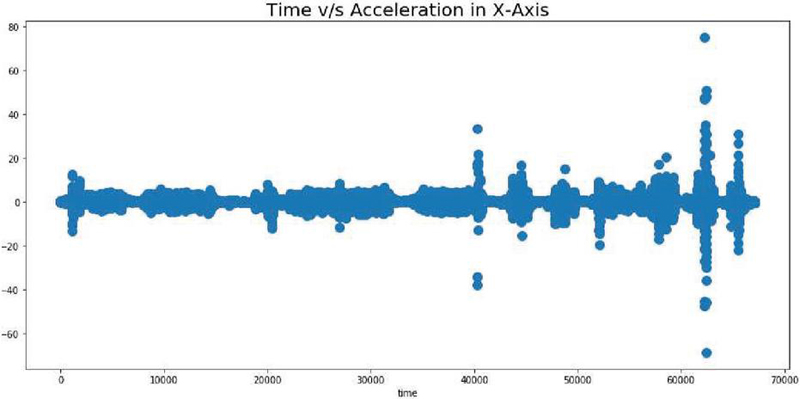
Figure 11(a): Time v/s acceleration in x-axis.
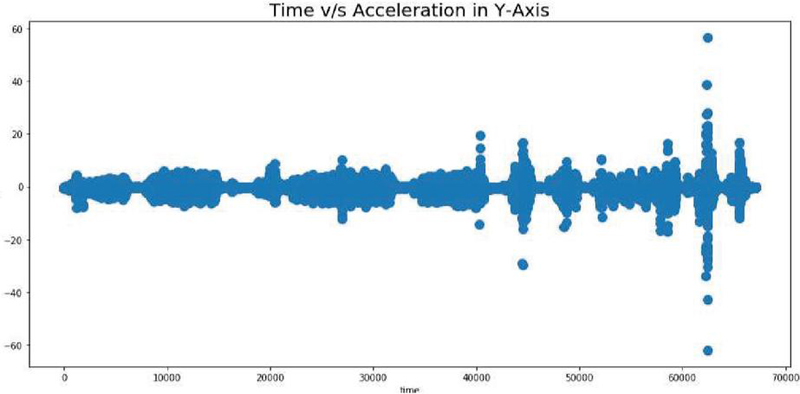
Figure 11(b): Time v/s acceleration in y-axis.
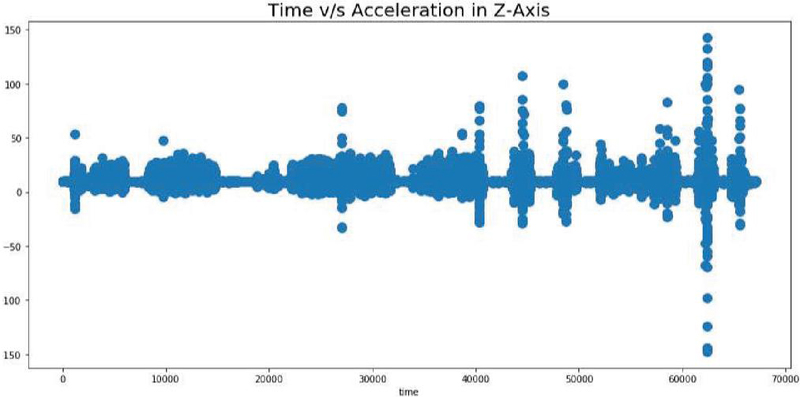
Figure 11(c): Time v/s acceleration in z-axis.
As seen in the mentioned above figures, the response of all the axes is almost identical but the most of detailed amongst them is Time v/s Acceleration Graph in Z-Axis. Therefore, we will focus this on our study.
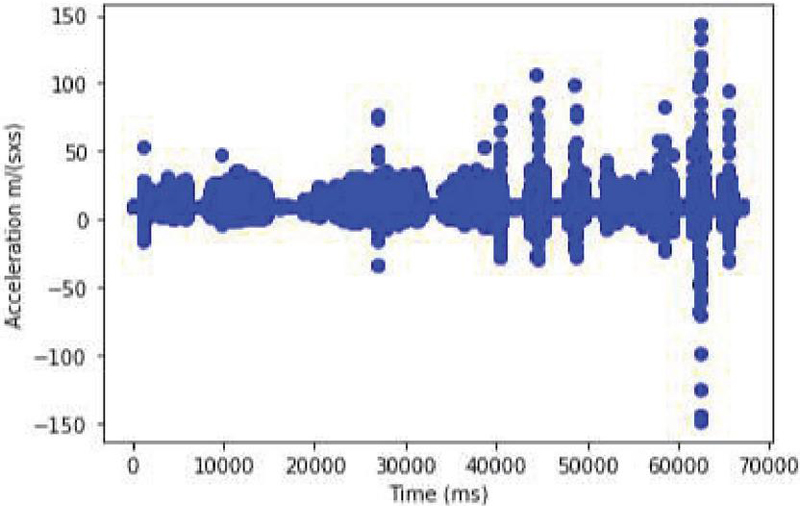
Figure 11(d): Time v/s acceleration in z-axis.
5.3 Computation of Centroids
The computation of centroids is a process used in k-means clustering to identify the centre of each cluster in the data. A centroid is a representative value or point that summarizes the data in a cluster.
In the context of the instrumentation for measuring super elevated rail joint faults, the centroids were calculated for the acceleration data along each axis (x, y, and z). The centroids represent the average acceleration value for each cluster and can be used to identify the most common type of acceleration behaviour within each cluster.
The data was divided into three clusters, one for healthy tracks, one for rail joints with gaps, and one for super elevated faults, then the centroids for each cluster would represent the average acceleration value for healthy tracks, rail joints with faults, and super elevated faults, respectively.
The computation of centroids is an important step in k-means clustering as it provides a way to identify the centre of each cluster, which can then be used to make predictions or make decisions based on the data.
The computed centroids based on Time vs Accelerations in Z-axis are mentioned as follow:
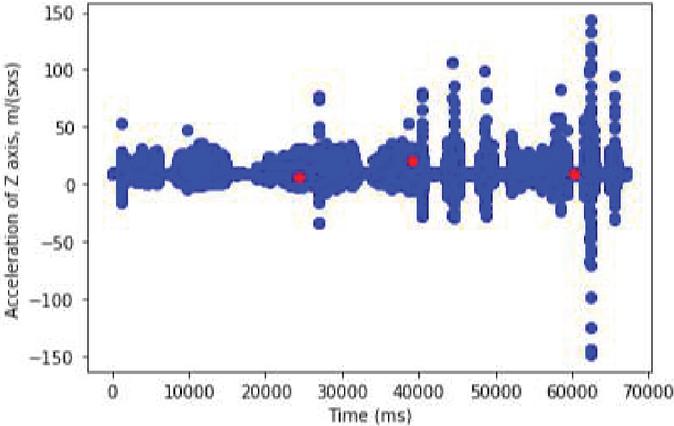
Figure 12 Determination of the centroids.
5.4 After Executing K-Means Clustering
The final graph with 3 clusters is a visual representation of the results of the k-means clustering algorithm applied to the acceleration data. The graph shows the different clusters of acceleration data, with each cluster representing a different type of response to the conditions of the rail joint.
In this case, the 3 clusters represent the response of acceleration in a healthy track, the response of acceleration while there is a rail joint with a gap, and the response of acceleration when there is a super elevated fault.
The graph may be presented as a scatter plot using Matplotlib.pyplot API of the Python, with each data point representing a measurement of acceleration and being coloured based on the cluster it belongs to. Alternatively, the graph may be presented as a histogram, with each bar representing the distribution of acceleration data for a particular cluster.
The final graph provides a clear visual representation of the different types of acceleration behaviour for different conditions of the rail joint, making it easier to identify faults and to make decisions based on the data.

Figure 13 Result of K-means clustering.
6 Validation
All the data collected were marked on an actual location so that the clusters obtained from the algorithms can be verified and validated using visual inspection by the help of professional rail technicians. As evident from the above graph that shows the results in terms of clusters after the data is processed in K means clustering, the first cluster that is represented in green colour is a healthy railway track that maintains the standardized rail joint gaps.
Whereas the second cluster represented in the blue colour is of the railway track that has two rail joints which exceed the standardized values and at the last there is super elevated rail joint, which represented in the red colour as shown in the Figure 13.
The clusters were verified, and the results in the Table 1.
Table 1 Validating the identified clusters using visual inspection
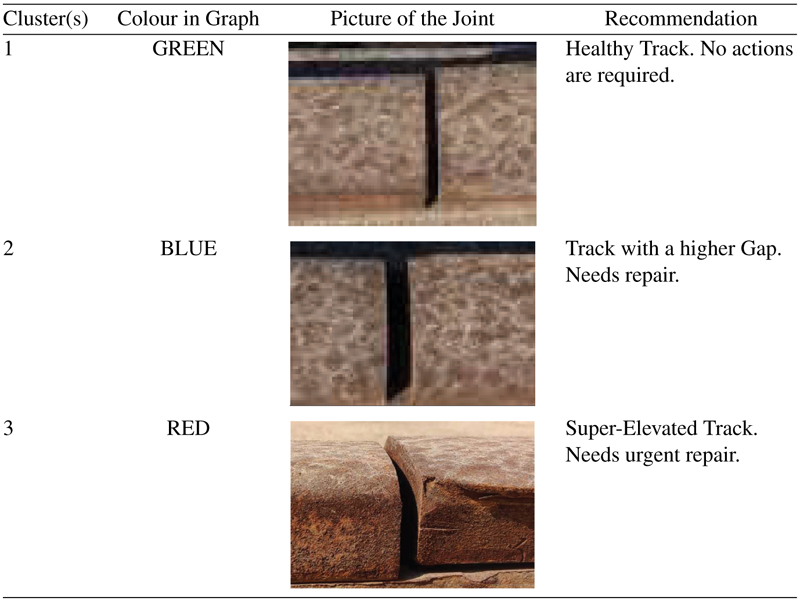
The clusters were verified with the help of rail technicians. The errors can visibly show the reliability of the mobile sensing for the identification of the railway track faults like super-elevation. Thus, the results obtained from K-means clustering are satisfactory and more such research are encouraged to be conducted in the similar domain.
7 Conclusions and Future Works
In this paper, the developed instrumentation is employed to measure super elevated rail joint faults using mobile sensing (accelerometer) and k-means clustering, which ultimately results in providing a powerful tool for identifying faults in rail joints. The process involves collecting acceleration data along the x, y, and z axes, creating time vs acceleration graphs, computing centroids, and presenting the results in a final graph with 3 clusters.
K-means clustering is an unsupervised machine learning technique used to group similar data points into clusters based on their similarity. In the context of identifying railway faults, the accelerometer data collected from the rail joints is used as input for the k-means algorithm.
The algorithm divides the data into a specified number of clusters (in this case, 3), based on the similarity of the acceleration data along each axis (x, y, and z). The result is a visual representation of the different types of acceleration behaviour for different conditions of the rail joint, making it easier to identify faults.
The clusters in this study are divided as follows: first cluster represents the response of acceleration in a healthy track whereas the second cluster represents the response of acceleration when there is a rail joint fault due to gap (when the gap is more than the standard size for a rail joint gap that can range from 1/8 inch to 1/4 inch), then any data point that falls into the latter cluster would be an indication of a possible fault in the rail joint. This process allows for quick and accurate identification of faults in railway systems, enabling timely and effective maintenance.
In summary, the role of clusters in k-means clustering is to group similar data points and provide a visual representation of the different types of acceleration behavior, which can be used to identify faults in railway systems.
Whereas the clusters obtained from k-means clustering can be used in the future to diagnose super elevated rail joint faults in several ways:
a. Real-time monitoring: The results of k-means clustering can be used to develop real-time monitoring systems for rail joints. By continuously collecting accelerometer data from the joints, the system can identify any deviation from the normal behavior and trigger an alarm or send a notification to the maintenance crew if a fault is detected.
b. Predictive maintenance: By analyzing the historical data of accelerometer readings, it’s possible to predict when a rail joint is likely to fail. This information can be used to plan maintenance activities proactively, reducing downtime and avoiding more serious and costly faults.
c. Remote monitoring: With advances in IoT and wireless communication technologies, it’s possible to deploy remote monitoring systems that can collect and analyze accelerometer data from rail joints in real-time. This information can be used to diagnose faults and take appropriate action, even if the maintenance crew is not physically present at the site.
d. Integration with other systems: The results of k-means clustering can be integrated with other systems such as GIS, track inspection systems, and maintenance management systems to provide a more comprehensive view of the rail network and help prioritize maintenance activities.
References
[1] World Bank, “Railway.”
[2] M. Chenariyan Nakhaee, D. Hiemstra, M. Stoelinga, and M. van Noort, “The recent applications of machine learning in rail track maintenance: A survey,” in Reliability, Safety, and Security of Railway Systems. Modelling, Analysis, Verification, and Certification: Third International Conference, RSSRail 2019, Lille, France, June 4–6, 2019, Proceedings 3, 2019, pp. 91–105.
[3] F. Imdad, M. T. Niaz, and H. S. Kim, “Railway track structural health monitoring system,” in 2015 15th International Conference on Control, Automation and Systems (ICCAS), 2015, pp. 769–772.
[4] “British Broadcasting Corporation. Pakistan Train Fire: Are Accidents at a Record High?,” 2019. https://www.bbc.com/news/world-asia-50252409.
[5] “Statista. Number of Rail Accidents and Incidents in the United States from 2013 to 2020,” 2020.
[6] “Audit Report on the Accounts of Pakistan Railways Audit Year 2019–2020,” 2020.
[7] “A timeline of major train accidents in the past two decades,” DAWN, 2021.
[8] M. Masmoudi, S. Yaacoubi, M. Koabaz, M. Akrout, and A. Skaiky, “On the use of ultrasonic guided waves for the health monitoring of rails,” Proc. Inst. Mech. Eng. Part F J. Rail Rapid Transit, vol. 236, no. 5, pp. 469–489, 2022.
[9] D. Bombarda, G. M. Vitetta, and G. Ferrante, “Rail Diagnostics Based on Ultrasonic Guided Waves: An Overview,” Appl. Sci., vol. 11, no. 3, p. 1071, 2021.
[10] P. Chandran, F. Thiery, J. Odelius, H. Lind, and M. Rantatalo, “Unsupervised Machine Learning for Missing Clamp Detection from an In-Service Train Using Differential Eddy Current Sensor,” Sustainability, vol. 14, no. 2, p. 1035, 2022.
[11] Y. Liu et al., “Depth quantification of rolling contact fatigue crack using skewness of eddy current pulsed thermography in stationary and scanning modes,” NDT E Int., vol. 128, p. 102630, 2022.
[12] A. A. Shah et al., “Development of a Wireless Track Recording Vehicle with a Low Environmental Impact: An Approach for Enhancing Railway Track Safety Standards,” in 2022 Global Conference on Wireless and Optical Technologies (GCWOT), 2022, pp. 1–7.
[13] Y. Jiang, H. Wang, S. Chen, and G. Tian, “Visual quantitative detection of rail surface crack based on laser ultrasonic technology,” Optik (Stuttg)., vol. 237, p. 166732, 2021.
[14] R. Shafique et al., “A novel approach to railway track faults detection using acoustic analysis,” Sensors, vol. 21, no. 18, p. 6221, 2021.
[15] G. D’Angelo, N. Thom, and D. Lo Presti, “Bitumen stabilized ballast: A potential solution for railway track-bed,” Constr. Build. Mater., vol. 124, pp. 118–126, 2016.
[16] A. A. Shah, N. A. Bhatti, K. Dev, and B. S. Chowdhry, “MUHAFIZ: IoT-based Track Recording Vehicle for the Damage Analysis of the Railway Track,” IEEE Internet Things J., 2021.
[17] A. A. Shah, B. S. Chowdhry, T. D. Memon, I. H. Kalwar, and J. A. Ware, “Real Time Identification of Railway Track Surface Faults using Canny Edge Detector and 2D Discrete Wavelet Transform,” Ann. Emerg. Technol. Comput., vol. 4, no. 2, pp. 53–60, 2020.
[18] P. Quirke, D. Cantero, E. J. OBrien, and C. Bowe, “Drive-by detection of railway track stiffness variation using in-service vehicles,” Proc. Inst. Mech. Eng. Part F J. Rail Rapid Transit, vol. 231, no. 4, pp. 498–514, 2017.
Biographies
Ali Akbar Shah graduated from Mehran University of Engineering and Technology, Jamshoro, Pakistan (MUET) with a bachelor’s degree in electronics engineering in 2015, a master’s degree in mechatronics engineering in 2018, and is currently enrolled in MUET’s philosophy of doctorate degree programme in electronics engineering. Machine learning, deep learning, and mechatronics are some of his research specialties.
Abi Waqas Memon works as an assistant professor at MUET, Jamshoro. He has an engineering degree in telecommunications. He graduated from MUET, Jamshoro with an M.E. in Telecommunication Engineering and Management later that year. Afterwards, he earned a Ph.D. in Optics at the Politecnico di Milano in Italy.
M. A. Uqaili is the Former Vice Chancellor of Mehran University of Engineering and Technology, Jamshoro, Pakistan and a Meritorious Professor in the Department of Electrical Engineering. Prof. Uqaili graduated with a Bachelor of Engineering in Electrical and Electronics Engineering from NED University of Engineering and Technology in 1986. He has earned masters and doctoral degrees in electrical engineering and master’s in economics.
Bhawani Shankar Chowdhry is a Distinguished National Professor and the former Dean Faculty of Electrical Electronics and Computer Engineering at Mehran University of Engineering & Technology, Jamshoro, Pakistan. His list of research publications crosses to over 60 in national and international journals, IEEE and ACM proceedings in the area of Intelligent Instrumentation, WSN, Embedded systems, simulation & Modelling, Internet Technologies, Smart Civil Structures.

Tanweer Hussain is currently serving as Professor, Department of Mechanical Engineering, Mehran University of Engineering and Technology, Jamshoro. Dr. Hussain received his B.Eng. in Mechanical Engineering, Postgraduate Diploma in Manufacturing Engineering from Mehran UET, and PhD in Mechanical Engineering from The University of Nottingham, UK. He is specialist in design, modelling and analysis of mechanical assemblies, stochastic and uncertainty analysis of mechanical system.

Tauha Hussain Ali is currently serving as a Vice Chancellor of Mehran University of Engineering and Technology (MUET). He did his bachelor’s in civil engineering discipline from Mehran University of Engineering & Technology, and master’s in project management from National University of Singapore. Thereafter, he did PhD in Construction Health & Safety Management from Griffith University, Australia.
Journal of Mobile Multimedia, Vol. 20_1, 1–22.
doi: 10.13052/jmm1550-4646.2011
© 2024 River Publishers